• 概要
  • レビュー
  • コメント (4)
  • 最新情報

Pairs Arbitrage Correlation

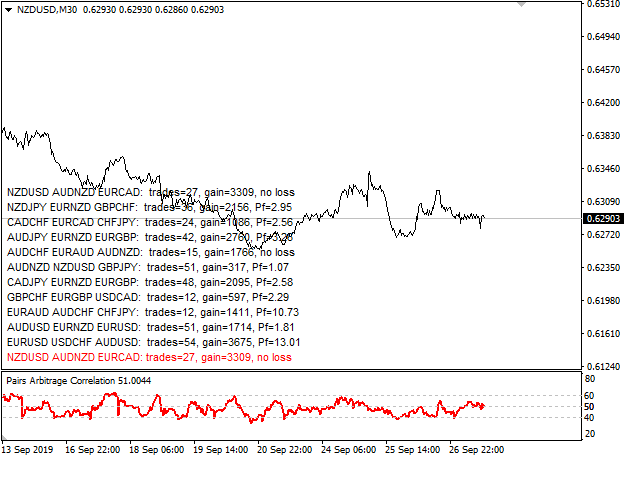
The cross-correlation indicator calculates the relationship between the specified pairs for the previous period. Automatically selects the instruments with the highest and the lowest correlation, and then simulates trading on the selected pairs on the same test period. Then indicator displays the pairs that have shown the best trading results. Visualizes the PAC (Pairs Arbitrage Correlation) criterion for the pairs selected by the trader. The signal to open trades is set by the PAC levels. When a signal appears, it sends a message to the e-mail or mobile terminal.

Telegrams channel to discuss the preferences and suggestions of improvements: https://t.me/joinchat/FZd4EhXEiEnAx7sybTh01Q

If you do not want to follow the indicator signals and manually open trades use the PACman expert Advisor https://www.mql5.com/ru/market/product/41991

Main parameters

  • Main pair - main instrument;
  • First pair - the first instrument with minimal correlation;
  • Second pair - the second instrument with low correlation;
  • suffix - additional suffix to pairs names;
  • Start at - the start time of the period used to analyze and find the correlation;
  • Finish at - period end time;
  • Exclude days - excluded days of the week from analysis and correlation search;
  • Lowest negative, % - minimal correlation for First pair;
  • Neutral, % - neutral correlation for Second pair;
  • Send mobile mt4 notification - send message to mobile mt4$
  • Send e-mail if below levels crossed - send email in case of signal;
  • Level for sell - PAC level for sale tradings;
  • Close all sells - PAC level to close all sells;
  • Level for buy - PAC level to buy tradings;
  • Close all buys- PAC level to close all buys;
Next is a list of pairs by which the indicator calculates the correlation and from which it selects pairs according to the criterion
  • symbol 1 - USDCHF
  • symbol 2 - GBPUSD
  • ...

  • symbol 23 - NZDUSD


おすすめのプロダクト
Smart News Trading – is a fully automated trading expert advisor for trading important economic news. Usually, after the release of macro-financial economic data, there are significant price fluctuations, which in some cases can lead to long-term upward or downward trends. Just at such moments, it is possible to earn considerable income in a relatively short period of time. To do this, it is enough to install this trading expert on the relevant asset(s) some time before the news release and set
This is a simple PriceTMA bands, non repaint! it can be used for a trend following system or sometimes reversals. as a main signal or a filter for others strategies, it depends on the trader main strategy. calculations for this indicator are a combined Algorithm between moving averages "MA" and average true range"ATR". good luck with your trading! i hope it is helpful Cheers
Fibonacci Currency Strength Meter (FCSM) Early Access Sale!! This new product is still in the process of adding new features and settings. For early bird buyers. The Price will be 50% Sale. In a few weeks, the product will be done. Go Grab your copy while it's still cheap. More details will be added soon. Things to be added. Alert Levels Mobile and Email Alert From it's name, Fibonacci Currency Strength Meter is a combination of Fibonacci levels and Currency Strength Meter. The plot of Fib
What Is The Buy OR Sell MT4 Indicator? As the name suggests, the   Buy-Sell Indicator   is an indicator that tells traders about when to take the buy and sell position on the Forex price chart. This tool is a preference of many traders because it can provide solid indications of the trend and its reversals. In addition, it helps them simplify the hassle of choosing one or more indicators because this one tool alone is enough to provide them with a straight answer.  When you apply this indicator
Modified Parabolic SAR: Your Reliable Market Assistant This enhanced version of the Parabolic SAR indicator effectively reflects the trend direction and can serve as an excellent addition to your trading strategy. Advantages: Trend Direction Reflection: The indicator accurately depicts the market trend direction, aiding you in making informed trading decisions. Signal Filtering: It can serve as an effective filter, complementing your strategy by helping to eliminate false signals and execute mo
FREE
スーパーエントリーはオールインワンの矢印タイプのインジケーターで、ロングシグナルとショートシグナルだけでサイドtpとslレベルを与え、ATR値に基づいて変更および微調整することができます。このインジケーターは、勝率やその他の統計を表示するバックテストパネルを提供します。どの程度の精度が期待できるかを明確に把握できます。 このインジケーターは再ペイントまたはバックペイントを行わず、信号は遅延なくバーオープンで表示されます。 パラメーター : 設定: インジケーター tp および sl 値、履歴および信号周期 通知 : アラート/電子メール/プッシュ 表示設定: 矢印の色/tp と sl の線の色と幅/矢印の種類 =============================================
The indicator sends messages to e-mail and mobile terminal when the price approaches the horizontal levels and trend lines that are drawn using the handy panel! The levels and trend lines are deleted and placed to the chart using one click on the panel, and they can be dragged on the chart by mouse! It is possible to set the interval between messages in the settings, the interval is applied to each object separately! Indicator Settings ===*** Main settings ***=== - below is the list of the mai
Indicator for binary options arrow is easy to use and does not require configuration works on all currency pairs, cryptocurrencies buy signal blue up arrow sell signal red down arrow tips do not trade during news and 15-30 minutes before their release, as the market is too volatile and there is a lot of noise it is worth entering trades one or two candles from the current period (recommended for 1 candle) timeframe up to m 15 recommended money management fixed lot or fixed percentage of the depo
The Momentum Standard/Hidden Divergence indicator will plot the momentum, and will also identify and plot standard (regular) divergences between the indicator and the price action, OR it can be set to identify and plot hidden (reverse) divergences between the indicator and the price action. The divergences themselves are implemented as lines (default green for bullish divergence and red for bearish divergence) drawn in the indicator pane. If activated via the Inputs dialog, alerts will be genera
Oscillator helps determine the direction of the market Shows the direction of the price movement and is painted in the appropriate color. Allows you to conduct trend and counter trend trading It works on all timeframes, on any currency pairs, metals and cryptocurrency Can be used when working with binary options Distinctive features Does not redraw; Simple and clear settings; It works on all timeframes and on all symbols; Suitable for trading currencies, metals, options and cryptocurrency (Bitco
FREE
Ema Dashboard is an innovative dashboard that allows you to monitor Moving Average on multiples symbols and different timeframes. This dashboard allows you to analyze information on 28 pairs on an unique chart. Its functionality includes analysis of All Time Frames. This configuration allows you to identify the Long Term Trend with extreme ease. This panel allows you to take very important directional movements. A click on button opens a new chart (symbol and timeframe). Graphic Object Symbol
Gold BB PRO
Vojtech Svobodnik
1 (1)
Gold BB PRO is a professional version of Gold BB FREE, which uses a portfolio of strategies based on Bollinger Bands . Gold BB PRO was developed for XAUUSD . This Expert Advisor has been tested from year 2006 to 2021 .  Doesn't use Martingale or other dangerous strategies. Backtest, which you can see bellow in screenshots section, used the real tick data with 99,90% accuracy. With this strategy one can trade using fixed lots  or using a risked percentage of the balance . Recommendations Symb
Floating peaks oscillator - it the manual trading system. It's based on Stochastik/RSI type of oscillator with dynamic/floating  overbought and oversold levels. When main line is green - market is under bullish pressure, when main line is red - market is under bearish pressure. Buy arrow appears at the floating bottom and sell arrow appears at floating top. Indicator allows to reverse signal types. Main indicator's adjustable inputs : mainTrendPeriod; signalTrendPeriod; smoothedTrendPeriod; tre
What Is Currency StrengtT Indicator? A currency strengthT indicator is a graphical tool that shows the strength of a currency. Common indicators usually show the strength of a currency in relation to another currency, however, with some calculations it is possible to find the absolute strength of each individual currency. Therefore, a currency strength matrix indicator (or meter) is a tool that tries to express the absolute strength of a currency, so that you can compare this strength with
^With Mixin Combiner. ^You Can Combine 10 Indicators Together To Make One Arrow In The End ^You Can Filter Time You Want To Trade. ^You Can Control Which Candle Arrow Apear On It " Bullish Or Bearsh". ^There Is An Statistics To Can Filter "What success rate of the indicators you Combined? ". ^You Also Can Control The Appearance Of The Arrows At Any Time Of The Candle , "Is It In The Beginning Or At Any Time In Particular? ".
Arrows appear after Reversal-Pattern and when the confirmation-candle reaches its value, it won't disappear (no repaint). but with fix settings no additional settings necessary Entry : immediately after arrow Stop loss : a few pips above the high of the arrow - candle / below the low of the arrow - candle Take Profit : at least the next candle / move to break even after candle closed / trail the SL works on : Major Forex-pairs / M15 and higher time-frames The Value of the  confirmation-candle =>
The CCI Dashboard is an information panel which allows you to have a global market vision through a Commodity Channel Index. CCI Dashboard analyzes and tracks all the actives you want to invest in. Take advantage of this useful dashboard where you can open in a few seconds the chart and quickly invest on it. Main Features of CCI Dashboard Graphic panel that allows you to know the situation of many assets. 7 Different Commodity Channel Index situations to discover when an asset is overbought or
This is a Price Action based EA. No martingale or hedging strategy is used here. The EA is for EURUSD Only. Entry Logic: Support resistance to determine the area of buying and selling. We don't enter market if its a ranging market.we filter ranging market with Bollinger band and ADX. Also we check the market trend.only enter for buy if its an uptrend and sell if its a sell market. Exit Logic: Usually, we have a fixed stop loss which is very low according to the Take profit. Also we have trailin
[75% OFF! - SALE ENDS SOON] -  RevCan Trend Entry Point is a trend based trade alert indicator for serious traders. It does all the price and chart analysis all by itself, and whenever it finds any potential high quality trading opportunity(Buy or Sell) using its revolutionized price prediction algorithms, it sends instant trade alert directly on the chart, MT4 terminal and on the mobile device.  The trade signals will be visible on the chart as Up and Down arrows, while the instant audible aler
Scalping Arrows with Exit Generation is an independent trading system for scalping. Works in trend mode, configured for each time interval (TF). Entry arrows are calculated using mathematical algorithms and displayed when the candle opens. It is possible to change the settings for generating signal arrows. The indicator provides a three-level progression of exiting trades. Points with exit options do not depend on the market situation; they are built according to the Fibonacci model, whic
Mr Beast Cross Distance
Luis Mariano Vazquez Marcos
MR BEAST 3 MA CROSS DISTANCE RECOMENDED EUR USD TIMEFRAME H1 Este robot de trading de Forex ha sido desarrollado por MRBEAST como una herramienta para facilitar el trading intradía. Tenga en cuenta que el uso de este robot implica ciertos riesgos y no garantiza ganancias consistentes en el mercado de divisas. El robot de trading se basa en algoritmos y estrategias que he diseñado, los cuales se han creado utilizando mi conocimiento y experiencia en el campo del trading. Sin embargo, el rendimien
Bank Expert Indicator Uses A Simple method of tracking price as it moves across the chart and signals when a potential long or short position is active and indicates this to the trader giving you the opportunity to take a position on the market. Or you can simply use this indicator to give yourself signals and determine if you want to take the trade or learn the strategy on your own. The Signals From this indicator are targeted at long-term positions and focus on top quality call outs. 
Developed methods for trading collected in one indicator. In the form of arrows, it defines entries in the direction of the trend. It has 2 types of arrows - trend and signal guides, informing about the potential movement in the direction of the trend. Works without redrawing, ready for use on all symbols/tools. The most suitable time frames to use are M15, M30, H1, H4. How to use The indicator finds the direction of the trend in the form of a signal arrow, a graphic rectangle stretches
Before working, watch the video and how to make the expert settings .............. very important ....... Do it Multiplication=true ...... It works on opening   SELL STOP and BUY STOP With distance control of step When one trade is activated, the other trade moves with the trend With the closing of the winning trade from win_USD When the winning deal is closed, it works again in the same way There is also a loss in dollars that can be controlled by closing all together at a loss in dollars Lo
Pyro Trend is a new product that allows you to identify the current market phase (uptrend, downtrend or flat). The indicator is applicable for any data and periods. The middle of the trend wave, as well as the edges, are places of special heat and market behavior; when writing the indicator, an attempt was made to implement precisely finding the middle. Pyro Trend is a trend indicator that uses an original calculation algorithm. This indicator paints arrows in different colors depending on th
indicator named "MTRADER" designed to be used with the MetaTrader 4 trading platform. It appears to be a technical analysis tool for forex or stock market trading. Here's a breakdown of its key components and functionalities: Indicator Properties and Inputs : The code begins by setting up basic properties of the indicator, such as its name, version, and drawing styles. It defines two indicator buffers with blue and red colors, likely used for graphical representation on charts. Input parameters
Global Trend Indicator, shows the signals for entry. Displays both entry points and the trend itself. Shows statistically calculated moments for entering the market with arrows. When using the indicator, the risk factor can be optimally distributed. Settings: Uses all one parameter for settings. Choosing a parameter, it is necessary to visually resemble it so that the appropriate graph has a projection of extremes. Parameters: Length - the number of bars for calculating the indicator.
This is an arrow indicator for binary options. It does not redraw, arrows do not disappear. The indicator implements an optional tester for visual monitoring of the number of signal and win rate. Does not require adjustment or fitting. Works on all pairs and gold. The signal appears at the close of a candle. Entry is made on the next bar. Optional alert. For trading with robots, there is a setting for the number of bars in history. If 0, the entire history is used. The EA operation time: 24/5 Wo
The RBCI hist indicator is an adaptive trend histogram, that eliminates noise using a Low-pass filter, which passes the lower frequencies and cuts off hight frequencies of the price fluctuations. The signal (depending on the strategy chosen by trader) is the intersection of the zero line by the indicator, as well as the change in the histogram color. The change in the histogram color serves as an early signal for opening positions towards the trend. The position of the indicator relative to the
このプロダクトを購入した人は以下も購入しています
Gann Made Easy は、ミスター・ギャンの理論を使用した取引の最良の原則に基づいた、プロフェッショナルで使いやすい外国為替取引システムです。 W・D・ガン。このインジケーターは、ストップロスとテイクプロフィットレベルを含む正確な買いと売りのシグナルを提供します。 PUSH通知を利用して外出先でも取引可能です。 購入後はご連絡ください!私の取引のヒントと素晴らしいボーナスインジケーターを無料で共有します! おそらく、ギャンの取引手法についてはすでに何度も聞いたことがあるでしょう。通常、ギャンの理論は初心者のトレーダーだけでなく、すでにある程度の取引経験がある人にとっても非常に複雑なものです。なぜなら、ギャンの取引手法は理論的にはそれほど簡単に適用できるものではないからです。私はその知識を磨き、最良の原則を私の外国為替インジケーターに組み込むために数年を費やしました。 このインジケーターは非常に簡単に適用できます。必要なのは、それをチャートに添付し、簡単な取引推奨事項に従うだけです。このインジケーターは常に市場分析の仕事を行い、取引の機会を探します。適切なエントリーポイントを検出
驚異的なFXインジケーター「Miraculous」をご紹介します。完璧な結果を得るための1時間足を含むすべてのタイムフレームで効果的に機能する、最強の強力な特殊MT4フォレックスインジケーターです。 すべてのタイムフレームで優れた結果を提供する最高のFXインジケーターを探し続けるのに疲れましたか?これ以上探す必要はありません!「Miraculous」フォレックスインジケーターをご紹介します。このインジケーターは、トレーディングの経験を変革し、収益を新たなレベルに引き上げるために設計されました。 先進のテクノロジーと長年にわたる緻密な開発に基づいて構築された「Miraculous」フォレックスインジケーターは、FX市場における力と正確さの頂点となります。この素晴らしいツールは、すべてのレベルのトレーダーのニーズを満たすように設計されており、一貫した収益性を追求する上で比類のない優位性を提供します。 「Miraculous」フォレックスインジケーターの他との違いは、その非常に適応性にあります。デイトレーダー、スウィングトレーダーであろうと、長期ポジションを好む方であろうと、このインジケータ
現在20%OFF! 初心者やエキスパートトレーダーのためのベストソリューション! このダッシュボードソフトウェアは、28の通貨ペアで動作しています。それは私達の主要な指標(高度な通貨の強さ28と高度な通貨インパルス)の2に基づいています。それは全体の外国為替市場の大きい概観を与えます。それは、すべての(9)時間枠で28の外国為替ペアのための高度な通貨の強さの値、通貨の動きの速度と信号を示しています。チャート上で1つのインディケータを使用して市場全体を観察し、トレンドやスキャルピングの機会をピンポイントで見つけることができたら、あなたのトレードがどのように改善されるか想像してみてください。 このインディケータには、強い通貨と弱い通貨の識別、潜在的な取引の識別と確認がより簡単になるような機能が搭載されています。このインディケータは、通貨の強さや弱さが増加しているか減少しているか、また、すべての時間枠でどのように機能しているかをグラフィカルに表示します。 新機能として、現在の市場環境の変化に適応するダイナミックなマーケットフィボナッチレベルが追加され、すでに当社のAdvan
A key element in trading is zones or levels from which decisions to buy or sell a trading instrument are made. Despite attempts by major players to conceal their presence in the market, they inevitably leave traces. Our task was to learn how to identify these traces and interpret them correctly. Reversal First Impulse levels (RFI)   -  Version MT5                INSTRUCTIONS                 RUS                 ENG                                       R ecommended to use with an indicator   -  
TPSpro TRENDPRO  - is a trend indicator that automatically analyzes the market and provides information about the trend and each of its changes, as well as giving signals for entering trades without redrawing! The indicator uses each candle, analyzing them separately. referring to different impulses - up or down impulse. Exact entry points into transactions for currencies, crypto, metals, stocks, indices!  -  Version MT5               DETAILED DESCRIPTION        /       TRADING SETUPS           
まず第一に、この取引インジケーターは再描画されず、再描画されず、遅延しないことを強調する価値があります。これにより、手動取引とロボット取引の両方に理想的なものになります。 アトミックアナリストは、価格の強さとモメンタムを利用して市場でより良いエッジを見つけるためのPA価格アクションインジケーターです。ノイズや誤ったシグナルを除去し、取引ポテンシャルを高めるための高度なフィルターを備えています。複雑なインジケーターの複数のレイヤーを使用して、アトミックアナリストはチャートをスキャンし、複雑な数学的計算をシンプルなシグナルと色に変換します。これにより、どのような初心者トレーダーでも理解して使用し、一貫した取引の決定を行うことができます。 「アトミックアナリスト」は、新規および経験豊富なトレーダー向けにカスタマイズされた包括的な取引ソリューションです。プレミアムインジケーターとトップノッチの機能を1つの取引戦略に組み合わせ、すべてのタイプのトレーダーにとって汎用性のある選択肢にします。 デイリートレーディングとスキャルピング戦略:高速で正確なデイトレーディングおよび短期トレード
現在26%オフ 初心者やエキスパートトレーダーに最適なソリューション! このインジケーターは、独自の機能と新しい計算式を取り入れた、ユニークで高品質、かつ手頃な価格のトレーディングツールです。たった1枚のチャートで28の為替ペアの通貨強度を読み取ることができます。新しいトレンドやスキャルピングチャンスの引き金となるポイントを正確に特定することができるので、あなたのトレードがどのように改善されるか想像してみてください。 ユーザーマニュアルはこちら  https://www.mql5.com/en/blogs/post/697384 これが最初の1本、オリジナルだ! 価値のないクローンを買わないでください。 特別な サブウィンドウの矢印で強い通貨の勢いを表示 GAPがあなたのトレードを導く! 基準通貨や気配値が売られすぎ・買われすぎのゾーン(外相フィボナッチレベル)にあるとき、個別チャートのメインウィンドウに警告表示。 通貨がレンジの外側から反落した場合、プルバック/リバーサルのアラート。 クロスパターンの特別なアラート 複数の時間枠を選択可能で、トレンドを素早く
An exclusive indicator that utilizes an innovative algorithm to swiftly and accurately determine the market trend. The indicator automatically calculates opening, closing, and profit levels, providing detailed trading statistics. With these features, you can choose the most appropriate trading instrument for the current market conditions. Additionally, you can easily integrate your own arrow indicators into Scalper Inside Pro to quickly evaluate their statistics and profitability. Scalper Inside
ご紹介   クォンタム トレンド スナイパー インジケーターは 、トレンド反転を特定して取引する方法を変革する画期的な MQL5 インジケーターです。 13年以上の取引経験を持つ経験豊富なトレーダーのチームによって開発されました。     クォンタムトレンドスナイパーインジケーター   は、非常に高い精度でトレンドの反転を識別する革新的な方法で、あなたのトレーディングの旅を新たな高みに押し上げるように設計されています。 ***Quantum Trend Sniper Indicatorを購入すると、Quantum Breakout Indicatorを無料で入手できます!*** クォンタム ブレイクアウト インジケーターは、トレンドの反転を特定するとアラートを発し、矢印を示し、3 つのテイクプロフィットレベルを提案します。 初心者トレーダーにもプロのトレーダーにも適しています。 量子EAチャネル:       ここをクリック MT5のバージョン:       ここをクリック 推奨事項: 期間: すべての時間枠。最良の結果を得るには、
TrendMaestro
Stefano Frisetti
5 (2)
note: this indicator is for METATRADER4, if you want the version for METATRADER5 this is the link: TRENDMAESTRO recognizes a new TREND in the bud, he never makes mistakes. The certainty of identifying a new TREND is priceless. DESCRIPTION TRENDMAESTRO identifies a new TREND in the bud, this indicator examines the volatility, volumes and momentum to identify the moment in which there is an explosion of one or more of these data and therefore the moment in which prices have strong probability of f
まず第一に、この取引ツールはノンリペイント、ノンリドロー、ノンラグの指標であり、プロの取引に理想的ですことを強調する価値があります。 スマートプライスアクションコンセプトインジケーターは、新米から経験豊富なトレーダーまで、非常 に強力なツールです。Inner Circle Trader AnalysisやSmart Money Concepts Trading Strategiesなど、20以上の有用な指標を1つに組み合わせています。このインジケーターはスマートマネーコンセプトに焦点を当て、大手機関の取引方法を提供し、彼らの動きを予測するのに役立ちます。 特に、流動性分析に優れており、機関がどのように取引しているかを理解しやすくしています。市場のトレンドを予測し、価格の動きを慎重に分析するのに優れています。機関の戦略とトレードを合わせることで、市場の動向についてより正確な予測ができます。このインジケーターは多目的であり、市場構造を分析し、重要な注文ブロックを特定し、さまざまなパターンを認識するのに優れています。 このインジケーターはBOSやCHoCHなどのパターンの識
通貨強さウィザードは、取引を成功させるためのオールインワン ソリューションを提供する非常に強力な指標です。このインジケーターは、複数の時間枠のすべての通貨のデータを使用して、このまたはその外国為替ペアのパワーを計算します。このデータは、使いやすい通貨インデックスと通貨パワーラインの形式で表され、特定の通貨のパワーを確認するために使用できます。 必要なのは、取引したいチャートにインジケーターを接続することだけです。インジケーターは、取引する通貨の実際の強さを示します。このインジケーターは、トレンドに合わせて取引するときに有利に利用できる売買高の圧力の極値も示します。このインジケーターには、フィボナッチに基づく可能なターゲットも表示されます。 このインジケーターは、PUSH 通知を含むあらゆるタイプのアラートを提供します。 購入後ご連絡下さい。私の取引のヒントをあなたと共有し、素晴らしいボーナスインジケーターを無料で提供します! 幸せで有益な取引をお祈りします。
Step into the realm of Forex trading with confidence and precision using XQ, a cutting-edge Forex indicator designed to elevate your trading game to unprecedented heights. Whether you're a seasoned trader or just stepping into the world of currency exchange,   XQ Forex Indicator   empowers you with the insights and signals needed to make informed trading decisions. The signal conditions are a combination of three indicators, and XQ Forex Indicator only display  medium and long-term trends . The
カスタムMT4インジケーターで外国為替取引を成功させるための秘密を発見してください! 外国為替市場で成功を達成し、リスクを最小限に抑えながら一貫して利益を得る方法を疑問に思ったことはありますか? これがあなたが探している答えです! 取引へのアプローチに革命をもたらす独自のMT4インジケーターを導入できるようにします。 ユニークな汎用性 私たちのインジケータは、RenkoとRangeBarのろうそくのフォーメーションを好むユーザー向けに特別に設計されています。 これらのチャートタイプは多くの経験豊富なトレーダーに好まれていることを理解しています。そのため、私たちのインジケーターはそれらとシームレスに統合され、比類のない市場分析を提供します。 クリアトレンドシグナル 複雑な分析を忘れてください! 私たちのインジケーターは、鮮やかな色と明確なドット構造を利用して、市場の動向を明確に示しています。 赤と青の点は、価格の動きの方向性について疑いの余地がなく、取引の迅速な意思決定を可能にします。 HH/HL HL/LL戦略とのアライメント HH/HLおよびHL/LL構
Advanced Supply Demand
Bernhard Schweigert
4.92 (310)
現在33%オフ 初心者にもエキスパートトレーダーにも最適なソリューション このインジケーターは独自の機能と新しい公式を多数内蔵しており、ユニークで高品質かつ手頃な取引ツールです。このアップデートでは、2つの時間枠ゾーンを表示できるようになります。より長いTFだけでなく、チャートTFとより長いTF(ネストゾーンを表示)の両方を表示できます。すべてのSupply Demandトレーダーの皆さんのお気に召すはずです。:) 重要情報の公開 Advanced Supply Demandの可能性を最大化するには、 https://www.mql5.com/ja/blogs/post/720245 にアクセスしてください。   エントリーまたはターゲットの正確なトリガーポイントを正確に特定できれば取引がどのように改善されるか想像してみてください。新しい基盤となるアルゴリズムに基づいて構築されているため、買い手と売り手の間の潜在的な不均衡をさらに簡単に特定できます。これは、最も強い需要と供給のゾーンと、過去のパフォーマンス(古いゾーンを表示)がグラフィカルに表現されるためです。これらの機能は、最適
ご紹介     Quantum Breakout PRO は 、ブレイクアウト ゾーンの取引方法を変革する画期的な MQL5 インジケーターです。 13年以上の取引経験を持つ経験豊富なトレーダーのチームによって開発された Quantum Breakout PROは 、革新的でダイナミックなブレイクアウトゾーン戦略により、あなたの取引の旅を新たな高みに押し上げるように設計されています。 クォンタム ブレイクアウト インジケーターは、5 つの利益ターゲット ゾーンを備えたブレイクアウト ゾーン上のシグナル矢印と、ブレイクアウト ボックスに基づいたストップロスの提案を提供します。 初心者トレーダーにもプロのトレーダーにも適しています。 量子EAチャネル:       ここをクリック MT5バージョン:   ここをクリック 重要!購入後、インストールマニュアルを受け取るためにプライベートメッセージを送ってください。 推奨事項: 時間枠: M15 通貨ペア: GBPJPY、EURJPY、USDJPY、NZDUSD、XAUUSD アカウントの種類: ECN、Raw、また
Scalper Vault は、スキャルピングを成功させるために必要なすべてを提供するプロフェッショナルなスキャルピング システムです。このインジケーターは、外国為替およびバイナリー オプションのトレーダーが使用できる完全な取引システムです。推奨される時間枠は M5 です。 システムは、トレンドの方向に正確な矢印シグナルを提供します。また、トップとボトムのシグナルとギャン マーケット レベルも提供します。 インジケーターは、プッシュ通知を含むすべてのタイプのアラートを提供します。 インジケータの購入後にご連絡ください。私の個人的な取引の推奨事項と素晴らしいボーナス指標を無料で共有します! 幸せで有益な取引をお祈りします!
mql5と Telegramの モーニング・ブリーフィングで、詳細とスクリーンショットを含む毎日のマーケット・アップデートをご覧 ください! FX Power MT4 NGは 、長年の人気を誇る通貨強度計FX Powerの次世代モデルです。 この次世代ストレングスメーターは何を提供するのでしょうか?初代FXパワーの魅力すべて プラス GOLD/XAUの強さ分析 より正確な計算結果 個別に設定可能な分析期間 カスタマイズ可能な計算上限値により、さらに優れたパフォーマンスを実現 もっと見たい人のための特別なマルチインスタンス設定 すべてのチャートでお好みの色を無限に設定可能 数え切れないほどの通知オプションにより、重要なことを見逃すことはありません。 Windows 11とmacOSのスタイルで角を丸くした新しいデザイン 魔法のように動くインジケーターパネル FXパワーの主な機能 すべての主要通貨の強さの完全な履歴 すべての時間枠における通貨の強さの履歴 すべてのブローカーとチャートで同一の計算結果 100%信頼できるリアルタイム計算 -> リペイントなし ドロップダウン・リストから
ON Trade Waves Patterns Harmonic Elliot Wolfeをご紹介します。これは手動および自動の方法を使用して市場のさまざまなパターンを検出するために設計された高度なインジケーターです。以下はその動作方法です: ハーモニックパターン: このインジケーターは、チャートに表示されるハーモニックパターンを識別できます。これらのパターンは、Scott Carneyの「Harmonic Trading vol 1および2」で説明されているように、ハーモニックトレーディング理論を実践するトレーダーにとって重要です。手動で描画するか、自動検出に頼るかにかかわらず、ON Trade Waves Patternsがお手伝いします。 コントロールパネル: このインジケーターはユーザーフレンドリーなコントロールパネルを備えています。チャートと時間枠の設定を保存し、異なる構成間をスムーズに切り替えることができます。チャートスペースを最大限に活用するために最小化することもできます。他の分析ツールで作業することを好む場合、閉じるボタンをクリックするだけで、すべてのインジケーターデ
PRO Renko Systemは、特別にRENKOチャートを取引するために設計された高精度の取引システムです。 これは、様々な取引商品に適用することができる普遍的なシステムです。 システムは効果的に正確な逆転信号へのアクセスを与えるいわゆる市場の騒音を中和する。 表示器は非常に使いやすく、信号の生成に責任がある1つの変数だけがあります。 あなたは簡単にお好みの任意の取引ツールとレンコバーのサイズにツールを適応させることができます。 私はいつもあなたが私のソフトウェアで収益性の高い取引を支援するために余分なサポートを提供する準備ができています! 私はあなたに幸せで収益性の高い取引をしたいです! ご購入後にご連絡ください! 私はあなたに私のレンコチャートジェネレータを送信します。 私はまた、私の個人的な推奨事項やシステムの他のモジュールを無料で共有します!
これはMT4のインジケーターで、再描画なしで取引に参入するための正確なシグナルを提供します。 外国為替、暗号通貨、金属、株式、インデックスなど、あらゆる金融資産に適用できます。かなり正確な見積もりを提供し、取引を開始して終了するのに最適な時期を教えてくれます。1つのシグナルを処理しただけでインジケーターの元が取れた例の 動画 (6:22)をご覧ください。Entry PointsPro インジケーターの助けを借りたほとんどのトレーダーの最初の1週間の結果が改善しています。 Telegramグループ に登録してください。Entry Points Proインジケーターのメリットは次の通りです。 再描画のないエントリーシグナル 再描画されるインジケーターでは一度表示されたシグナルが削除されて大きな金銭的損失につながることがありますが、これと異なり、表示されて確認されたシグナルは消えることがありません。 エラーなしの取引開始 インジケーターアルゴリズムによって取引を開始する(資産を売買する)理想的な瞬間を見つけることができます。それを使用するすべてのトレーダーの成功率が向上します。
現在31%オフ! 初心者やエキスパートトレーダーに最適なソリューション! このインジケータは、独自の機能と秘密の数式を組み込んだ、ユニークで高品質かつ手頃な価格のトレーディングツールです。たった1枚のチャートで28の通貨ペアのアラートを表示します。新しいトレンドやスキャルピングチャンスの引き金となるポイントを正確に把握することができるので、あなたのトレードがどのように改善されるか想像してみてください! 新しい基本的なアルゴリズムに基づいて構築されているため、潜在的な取引の特定と確認がより簡単になります。これは、通貨の強さや弱さが加速しているかどうかをグラフィカルに表示し、その加速のスピードを測定するためです。加速すると物事は明らかに速く進みますが、これはFX市場でも同じです。つまり、反対方向に加速している通貨をペアにすれば、利益を生む可能性のある取引を特定することができるのです。 通貨の勢いを示す縦の線と矢印は、あなたの取引の指針となるでしょう。 ダイナミックマーケットフィボナッチ23レベルはアラートトリガーとして使用され、市場の動きに適応します。もしインパルスが黄色
まず最初に、このトレーディングシステムがリペイントされず、再描画されず、遅延しないことを強調する価値があります。これにより、プロのトレーディングに最適な状態になります。 「スマートサポートアンドレジスタンストレーディングシステム」は、新規および経験豊富なトレーダー向けにカスタマイズされた高度なインジケーターです。この包括的なシステムは、7以上の戦略、10のインジケーター、およびデイトレード戦略、スイングトレード戦略、サポートおよびレジスタンス戦略、ローソク足パターン戦略、VWAP戦略、マルチタイムフレームトレンド戦略など、さまざまなトレーディングアプローチを組み合わせています。これは、矢印信号、エントリーポイント、出口ポイント、トレードアラート、より高い時間枠のトレンド分析、リアルタイムのトレードモニタリング、そして洞察力のあるトレンドとボリュームキャンドルの着色を提供します。自動的なサポートとレジスタンスの検出により、さまざまな市況下でトレーダーが的確な決定を下すのを支援する多面的なインジケーターとなっています。 スマートサポートアンドレジスタンストレーディングシステムは、
TrendDecoder Premium
Christophe, Pa Trouillas
5 (2)
レンジと次の動きを特定    |  トレンドの最も早いシグナルと強さを得る   |  反転の前に明確な出口を得る   |  価格がテストするフィボ・レベルを見つける。 非リペイント、非遅延インディケータ - マニュアルおよび自動売買に最適 - すべての資産、すべての時間単位に対応 期間限定キャンペーン   >> 50%OFF 購入後、 推奨セッティングについては、このチャンネルで私に連絡してください。 MT5 バージョン: ここをクリック BladeSCALPER   と   PowerZONES   を使った完全な方法を入手する どのようなものですか? TrendDECODERは、トレンド監視をシンプルかつ簡単にするための複数のイノベーションを集約したものです。 Projective TrendLine (投影トレンドライン) - 今後のトレンドのスピードリファレンス。 RealTime TrendLine vs. Projective TrendLine (リアルタイムトレンドライン vs. Projective TrendLine) - 市場が同じ方
TakePropips Donchian Trend Pro
Eric John Pajarillaga Aldana
4.82 (17)
TakePropips Donchian Trend Pro   (MT4) は、ドンチャン チャネルを使用してトレンドの方向を自動的に検出し、エントリーとエグジットの取引シグナルを提供する強力で効果的なツールです! この多機能インジケーターには、トレンド スキャナー、取引シグナル、統計パネル、スクリーナー、取引セッション、およびアラート履歴ダッシュボードが含まれます。取引シグナルを提供し、チャートを分析する時間を節約するように設計されています! ユーザー マニュアルとインストール ガイドは、ブログ投稿 (   https://www.mql5.com/en/blogs/post/751368   ) からダウンロードできます。 今日は 50% オフ! 98ドルから49ドルに値下げ! このインジケーターは、ストラテジー テスターでテストできます (ビジュアル モードを有効にします)。ライブ チャートでテストしたい場合は、7 日間の試用版を入手するようにメッセージを送ることもできます。 詳細については、説明の下にあるビデオ チュートリアルも利用できます。 ご不明な点やサポートが必
Zeusインジケーターのご紹介:トレーディングでの究極の利益ブレークスルーをサポートするツール。 このインジケーターは、ブレイクアウト戦略と深い分析の必要性を排除し、トレーディングを簡素化します。設定した時間フレームに基づいてゾーンを自動的に描画し、ストップロス(SL)、テイクプロフィット(TP)、トレーリングストップのレベルを提案します。 Zeusインジケーターは、価格が買いポイントまたは売りポイントに近づいた際に、すぐに通知し、シグナル矢印を表示します。さらに、4つの異なるテイクプロフィットレベルとさまざまなトレーリングストップオプションの推奨も行います。 このツールは初心者から熟練のトレーダーまで対応しています。 チャンネルサポート: こちらをクリック ストア: こちらをクリックしてください。 MT5バージョン: こちらをクリック おすすめ: 時間枠: M5またはM15 通貨ペア: すべての通貨ペアと互換性があります アカウントタイプ: すべてのアカウントタイプと互換性があります おすすめのストップロス: Zeusインジケーターが提供するSLの提案をご利用ください おすすめの
FX Volume
Daniel Stein
4.6 (35)
mql5と Telegramの モーニング・ブリーフィングで、詳細とスクリーンショットを含む毎日のマーケット・アップデートをご覧 ください! FX Volumeは、ブローカーの視点から市場のセンチメントをリアルに洞察する、最初で唯一の出来高インジケーターです。 ブローカーのような機関投資家が外国為替市場でどのようなポジションをとっているか、COTレポートよりもはるかに速く、素晴らしい洞察を提供します。 この情報をチャート上で直接見ることは、あなたの取引にとって真のゲームチェンジャーであり、画期的なソリューションです。 以下のようなユニークなマーケットデータ洞察から利益を得てください。 比率は 、通貨のロングポジションとショートポジションの比率をパーセントで表示します。 比率の変化は 、選択した期間内のロング比率とその変化率を表示します。 Volumes Totalは 、通貨の取引量(ロングとショート)の合計をロット単位で表示します。 Volumes Long :全通貨のロングポジションの取引量を表示します。 Volumes(ショート )は、全通貨のショートポジションの取引量を表示
の紹介     Quantum平均足PRO チャート 市場のトレンドに対する明確な洞察を提供するように設計された平均足キャンドルは、ノイズを除去し、誤ったシグナルを排除する能力で知られています。混乱を招く価格変動に別れを告げ、よりスムーズで信頼性の高いチャート表現を導入しましょう。 Quantum Heiken Ashi PRO を真にユニークなものにしているのは、従来のローソク足データを読みやすい色のバーに変換する革新的なフォーミュラです。赤と緑のバーはそれぞれ弱気トレンドと強気トレンドをエレガントに強調し、潜在的なエントリーポイントとエグジットポイントを驚くほど正確に見つけることができます。 量子EAチャネル:       ここをクリック MT5のバージョン:       ここをクリック この注目すべき指標には、いくつかの重要な利点があります。 明確性の向上: 価格変動を平滑化することで、平均足バーは市場トレンドをより明確に表現し、有利な取引機会を特定しやすくします。 ノイズの削減: 誤ったシグナルを引き起こすことが多い不安定な価格変動に別れを告げます。 Quan
Cycle Sniper
Elmira Memish
4.41 (34)
NEW YEAR SALE PRICE FOR LIMITED TIME!!! Please contact us after your purchase and we will send you the complimentary indicators to complete the system Cycle Sniper is not a holy grail but when you use it in a system which is explained in the videos, you will feel the difference. If you are not willing to focus on the charts designed with Cycle Sniper and other free tools we provide, we recommend not buying this indicator. We recommend watching the videos about the indiactor and system before pu
今、147ドル(いくつかの更新後に499ドルに増加します) - 無制限のアカウント(PCSまたはMac) RelicusRoad ユーザー マニュアル + トレーニング ビデオ + プライベート Discord グループへのアクセス + VIP ステータス 市場の新しい見方 RelicusRoad は、外国為替、先物、暗号通貨、株式、および指数の世界で最も強力な取引インジケーターであり、トレーダーに収益を維持するために必要なすべての情報とツールを提供します。初心者から上級者まで、すべてのトレーダーが成功するためのテクニカル分析と取引計画を提供します。これは、将来の市場を予測するのに十分な情報を提供する重要な取引指標です。意味をなさないチャート上のいくつかの異なる指標ではなく、完全な解決策を信じています.これは、信号、矢印 + 価格アクション情報を表示するオールインワンのインジケーターで、他に類を見ない非常に正確です。 強力な AI に基づいて、RelicusRoad は不足している情報とツールを提供して、あなたを教育し、トレーディングのプロ、成功したトレーダーにします。
作者のその他のプロダクト
The utility copies trades from the signal provider accounts (master accounts, one or multiple providers) to unlimited number of receiver accounts (slave accounts). The provider is defined by the 'provider' parameter (any combination of numbers and letters). For example, there are two providers. Run the utility in master mode on them, and set different values to the provider parameter. On the account designated for copying these signals, run two utilities in slave mode in different windows, setti
LossLess Neuron
Vladimir Tkach
3.6 (10)
The Expert Advisor receives signals from an artificial neural network that uses the RSI indicator. Trades are closed by the opposite signals. Presence of a signal is checked at the closing of the bar. The EA also has the following functions: changing a position volume in proportion to the change in balance (function for the tester); transfer of unprofitable trades into breakeven; Parameters Start with lot - initial position volume increased in proportion to the balance change; Lotsize by balan
FREE
The utility copies trades from the signal provider accounts (master accounts, one or multiple providers) to unlimited number of receiver accounts (slave accounts).  Attention! Y ou need to use identifiers (Provider number) of the same length if you use several master copiers. For example. 1, 2, 3 or 11, 13, 22. The copying can be set in the opposite direction. The comments with all the recently performed actions are displayed on the screen to monitor the utility actions in slave mode. To avoid p
The indicator analyzes the change in the minimum and maximum prices of the previous bars fixing the entrance of the big players. If the change (delta) increases, a signal is displayed on the graph in the form of an arrow. At the same time, virtual trade on history is carried out. In the free version, virtual trade is performed without refills in case of a repeat of the signal. The results of virtual trading in the form of losses / losses, profitability, drawdown and transaction lines are display
FREE
Plot results
Vladimir Tkach
4.14 (7)
The indicator displays on a chart trading results. You can configure the color and font of displayed results, as well as filter trades based on the magic number. If multiple trades were closed within one bar of the current timeframe, the result is summed and output in one value. Utility parameters Plot profit in - the format of output results: wither in deposit currency taking onto account commission and swap, or in points. Start from - start processing data at the specified time. Plot last de
FREE
The indicator reads the current spread and displays it on the chart. The maximum value, the minimum value, the value at the time of opening the bar and the maximum value divided by 10 are displayed separately.  The indicator does not remember these values so the data will be lost if there is a change in the timeframe. The indicator is useful for analyzing market volatility, comparing the spread between brokers and different types of accounts. By default: Red line - maximum spread; Green bar
FREE
The utility searches the price history looking for the pattern similar to the one within a specified interval. The length of a pattern and a specified interval is the same and set in bars. Similarity is estimated by comparing the bars' body colors, size and shadows. The subsequent price movement is displayed as lines for all detected patterns. The color of the lines defines the degree of similarity. The movement length is set as a number of bars. Search for patterns and visualization are perform
FREE
The indicator displays the trading statistics of the analyzed Market signal on the chart. Signal transaction data is presented in an excel (csv) file and can be taken from the Signal>Trading history ( Export to CSV:  History ). The copied file must be saved to the directory MT4>File>Open Data Folder>MQL4>Files.  Available color management and font output.  If the currency names are different on the Signal and User accounts, use the Prefix and Suffix parameters. Utility options Prefix at Signal -
FREE
This EA trades support/resistance levels which were placed by a trader (Trend Line from toolbar). The direction of a trade is set graphically by arrows: ↑ - buy; ↓ - sell; - buy or sell in case of crossing support/resistance level. The level is off if inconsistent directions were set, like: ↑↓, ↑, or ↓. If the price is lower than a level it is a resistance level. And opposite is true for support level. There are a few methods available for levels defining, for testing with visualization as
The Expert Advisor trades the signals from an artificial neural network. Network with one hidden layer. Presence of a signal is checked at the closing of the specified period, which significantly increases the optimization and testing speed. It differs from the previous version by a number of additional features: works with pending orders; subsequent trades are opened with a lot increased by the specified step; moves the trade to breakeven a specified time after it was opened; closes trades at t
The Expert Advisor trades the signals from an artificial neural network with one hidden layer. Presence of a signal is checked at the closing of the specified period. MAIN PARAMETERS Net option - setting the order grid. When placing a market (not pending, Pending order offset=0 ) order according to a signal, the grid order is set. The following direction are available: follow the trend , against the treand and both directions . The number of placed orders is taken from the ...maximum deals with
This utility searches the history for price patterns, which are similar to those present in the intervals selected by trader (there are several intervals, see the screenshot). The length of the pattern and selected intervals is the same and is given by the number of bars. The similarity is estimated by comparing the colors of bar bodies, sizes of bars' bodies and wicks. For all identified patterns, further movement of the price is visualized as lines. The color of lines determines the degree of
The Expert Advisor opens a trade in the direction of the previous price movement or in the opposite direction (selectable). The previous direction is determined based on the chosen time interval. The interval can be set to trading session hours and thus to check the theory that the price is inactive after session close. Multiple trades can be open at a time depending on input parameters. The Expert Advisor trails the stop loss order, and is provided with multiple breakeven and trade closing func
The Expert Advisor opens a trade in the specified direction at the specified time. If the price moves in the profit direction, additional trades are opened after a preset step. Trade are closed by a Stop Loss or upon reaching a target profit. The Expert Advisor trails the stop loss order, and is provided with multiple breakeven and trade closing functions (See the description of the parameters). Test and optimize the EA in the Tester using M1 open prices. The EA parameters can be controlled via
The indicator calculates the number of times the price crossed the levels and bounced off the levels in history. The levels are defined by horizontal lines (Horizontal lines element from the Toolbar). In the free version, the levels are set manually. To calculate the number of crosses and rebounds, the indicator uses the specified tolerance to touching a level. This tolerance is sensitive to the timeframe of the bars. For example: for M5 use a tolerance about 10 pips, for М30 - 30 pips, for D1 -
The indicator calculates the historic price statistics: the number of intersections of a level and the number of rollbacks. The levels are set as horizontal lines (the 'Horizontal lines' element on the Toolbar) manually, are are drawn automatically by the indicator with the specified step. Only strong levels are drawn in the automated mode. There are two options for the automated mode: 1. Strong levels of intersection and support/resistance; 2. Strong support/resistance levels. The indicator use
The indicator analyzes the change in the minimum and maximum prices of the previous bars fixing the entrance of the big players. If the change (delta) increases, a signal is displayed on the graph in the form of an arrow. At the same time, virtual trade on history is carried out. In case of a repeat of the signal, the positions are increased (refilling). Thus the lot of positions can differ. The results of virtual trading in the form of losses / losses, profitability, drawdown and transaction li
The cut release of Top Signals Strategy EA for less price. With default parameters EA works in Assian session and scalps market. EA opens trades by RSI indicator signals in a specified time interval. In the case of a repetition of the signal opens a unidirectional transaction. The number of transactions per day can be limited. Revolves trades on the opposite signal. Displays information on trade and its results. Also you can set virtual stop loss and take profit. Telegram channel for discation p
EA trades pairs selected by correlation criterion. The choice is made in such a way that there are pairs with negative and neutral correlation to the main pair. The PAC indicator is used to automate the selection of pairs  https://www.mql5.com/en/market/product/41985 Expert is multycurrency, thus it is no use to test it in the MT4 terminal. So, watch for real signal and joing to telegram channel. After setting the pairs, the expert Advisor simulates trading for the previous period with visualiz
Simplified release of PACman EA. Expert is multycurrency, thus it is no use to test it in the MT4 terminal. So, watch for real signal and joing to telegram channel. After setting the pairs, the expert Advisor simulates trading for the previous period with visualization of the results. The user can interactively change the signal levels and observe their impact on the simulation result. In this way, you can select the optimal level values. By manually moving the vertical boundary lines to the ri
Simple and fast trade duplicator that copies trades on the same account with the reverse function. The reverse can be used for locking. You can choose to duplicate transactions for the current or all instruments.  Parameters Duplicate in reverse - the direction of duplication; Duplicate symbol - duplicate the selected tool; Manual lot size - hand size of the volume; Do not duplicate if spread > - do not duplicate a trade if the current spread is larger; List of magic to be duplicated - fi
Indicator shows the price history. The history is read for vertical lines and output for the main line. Those lines are the time cursors. You can use the indicator to analyze the price cycle over time, thereby predicting its movement. The duration of the forecast and the number of time cursors can be set in the indicator parameters. Additionally, you can link the main line to a new bar. Lines can be moved manually. Analyze the cyclical nature of the market using this indicator. Indicator pa
This expert Advisor uses the saved trading history to repeat trades in the strategy tester. Meanwhile you can set other values for take profit, stop loss, and closing time. Thus, you can check how the results of trading with other parameters would look like. The best set of parameters can be obtained using the strategy optimizer in the MT4 terminal. In addition, you can find out how the results of trading would be affected by the later opening of trades when the price went to the loss side. You
フィルタ:
レビューなし
レビューに返信
バージョン 2.8 2020.05.25
Added a pair of parameters for the pairs filtering - minimum number of trades and minimum profit.
Added the option to select pairs by correlation and profitability during the correlation period.
バージョン 2.6 2019.11.11
The method of setting correlation intervals and forward testing is simplified.
The indicator works in conjunction with the expert Advisor, displaying PAC values for the pairs selected by the expert Advisor.
Watch the video manual on my YouTube channel-PACman trading system 2.6
バージョン 2.5 2019.11.08
Fixed bugs.
Added the ability to select the period of averaging the values of the PAC indicator.
You can select the pairs to visualize the indicator from the panel on the PACman expert Advisor chart.
バージョン 2.4 2019.11.05
Added the choice of timeframe for the simulation of trade.
You can remove the third pair with neutral correlation from the analysis by specifying zero in the corresponding field.
バージョン 2.3 2019.10.21
Trios selecting method is improved.
バージョン 2.2 2019.10.08
1. Added four signal buffers: 1 buffer-signal to sell; 2 buffer-signal to close sells; 3 buffer-signal to buy; 4 buffer-signal to close buys.
2. Added blank fields in parameters to specify other pairs.
3. Added the choice of timeframe for the calculation of correlation.
4. The lines of the analyzed period can be plotted and moved. The indicator will recalculate the correlation and trios of pairs. Parameter-Use manual lines.
5. In the MT4 file/Open Data Folder/MQL4/Files/gaps_pair_name.csv indicator puts the number of inconsistencies in the price history.
6. If there is a gap in price history, the indicator displays an Alert for a specific pair.
バージョン 2.1 2019.09.27
Added a way to inform about the signal by sending a message to the mobile terminal.
バージョン 2.0 2019.09.26
Updated search algorithm for traded pairs. In this version, the pairs are selected not only by the correlation criterion, but also by the best trading results for a given historical period.
バージョン 1.6 2019.09.24
Bug fixed in correlation calculation.
バージョン 1.5 2019.09.23
You can exclude any week's day from correlation analisys and set time intermal by using dates.
バージョン 1.4 2019.09.13
Bug fixed in history period for correlation.
バージョン 1.3 2019.09.11
The code has been revised.
バージョン 1.2 2019.09.11
The code has been revised.
バージョン 1.1 2019.09.10
Informer was added.
Suffix set as a parameter.