PowerMeter Currencies Table
- インディケータ
- Mohamed yehia Osman
- バージョン: 3.0
- アップデート済み: 12 11月 2019
- アクティベーション: 5
YOU DON'T HAVE TO SHIFT ON ALL TIME FRAMES FOR EACH CURRENCY PAIR TO CONCLUDE ITS TREND AND ITS POWER
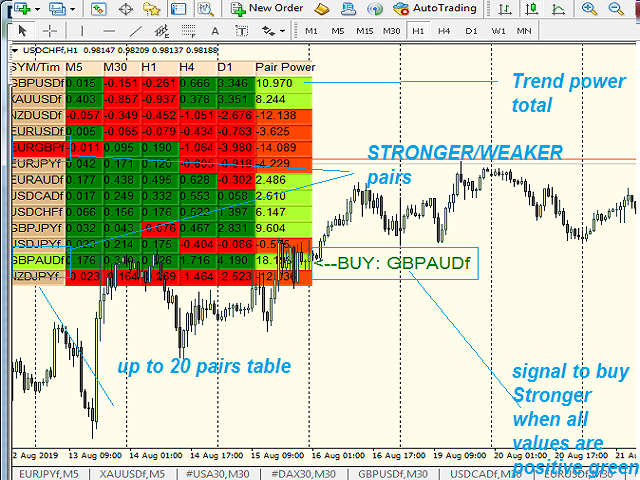
YOU HAVE IT ALL IN ONE TABLE , 20 CURRENCY PAIR WITH 5 TIME FRAMES
ALSO , COMPARE BETWEEN CURRENCIES STRENGTH
AND ALERTS THE STRONGER /WEAKER PAIR BASED ON 5 TIMEFRAMES CALCULATIONS
The Power meter currencies table is a very helpful tool to indicate the TREND strength of up to 20 currencies pairs
using 5 time frames M5 M30 H1 H4 and D1 (latest version You SELECT you own 5 timeframes from M1 to D1)
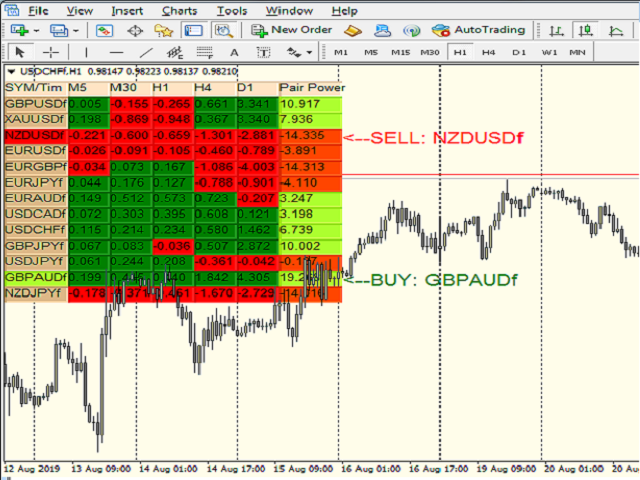
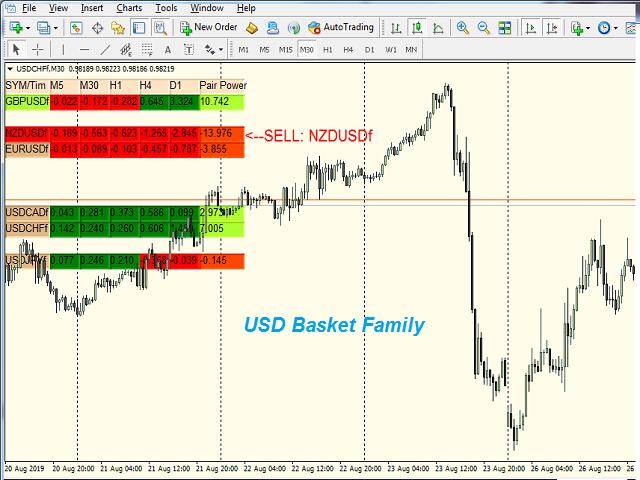
the Power Table shows the STRONG pair among all 20 pairs in GREEN
the Power Table shows the WEAKER pair among all 20 pairs in RED
An advisory label " BUY pair " is shown with the STRONGER pair calculated
An advisory label " SELL pair " is shown with the WEAKER pair calculated
Click symbol label to open its chart to trade
Click on Advisory BUY/SELL labels to open corresponding symbol chart to trade
when all cells values in a row for a pair is in RED -->indicates very BEAR Trend
when all cells values in a row for a pair is in GREEN-->indicates very BULL Trend
USE IT ON any chart TimeFrame
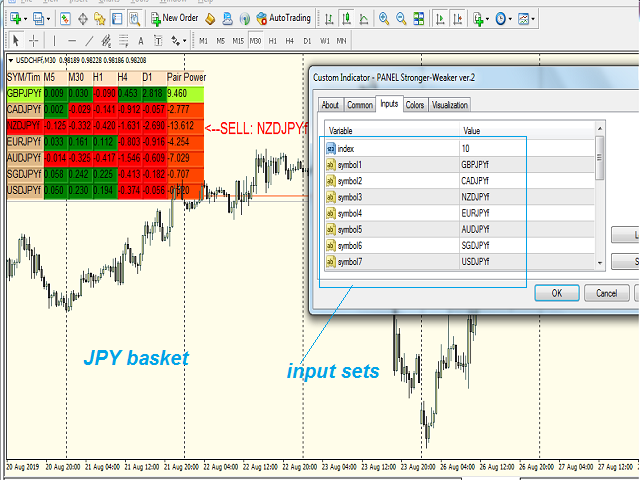
Inputs: 1- powerindex : 5/ 10/20/30.... (I use 30 !)
up to 20 pairs ( you can compare 2,3,5,....20 : but any incorrect pairs will STOP the indicator - leave unwanted symbols empty "")
2- Up to 20 different symbols pairs
3- 5 input time frames
NOTE :::EMPTY symbols will be considered as the Main Chart symbol (programming work on this issue)
STRATEGY1: BUY STRONGER PAIR / SELL WEAKER PAIR
STRATEGY2: BUY STRONGER PAIR When M5 value turns from Red to Green
SELL WEAKER PAIR When M5 value turns from Green to Red
CLOSE open BUY trade when Lower time frame M5/M1 and M5/M15/M30 color turns RED other than H1 H4 D1 (GREEN)
CLOSE open SELL trade when Lower time frame M5/M1 and M5/M15/M30 color turns GREEN other than H1 H4 D1 (RED)
You can setup your favorite strategy according to your set of inputs and trades past results
IMPORTANT NOTES:
1- BE SURE YOU ENTER CORRECT SYMBOL OR INDICATOR WILL STOP
2- BE SURE YOU HAVE M1/M5/M15/M30/H1/H4/D1 DATA HISTORY for selected symbols enough for correct indicator calculations