Clever TDI Pro
- インディケータ
- Carlos Forero
- バージョン: 2.92
- アップデート済み: 29 12月 2023
- アクティベーション: 5
Description:
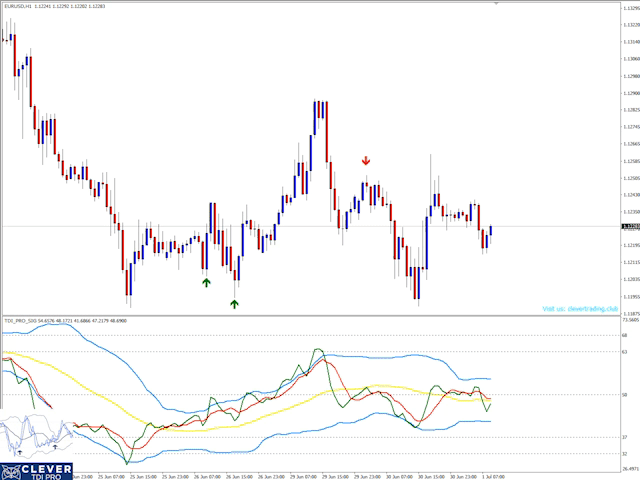
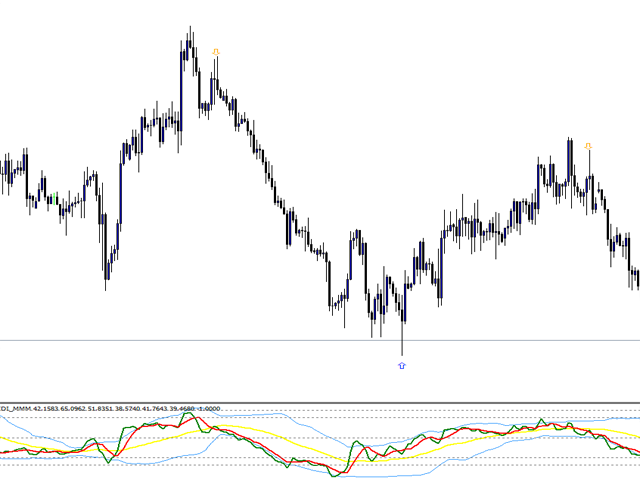
The indicator shows the TDI indicator in a separate window, and with the RSI component, the indicator finds possible divergences with M or W patterns.
KEY LINKS: How to Install - Frequent Questions - All Products
Functions:
- Finds Market Makers patterns.
- Finds extremes or exhaustion into the market.
- Looks for a trend continuation.
Content:
- TDI Indicator
- Divergence and M or W Signals
About Author:
Carlos Forero, Member of Clever Trading Club, private organization with the purpose of design clever solutions to generate constant profits with adapted risk.


ユーザーは評価に対して何もコメントを残しませんでした