Tendency Inside Bars
- ユーティリティ
- Igor Semyonov
- バージョン: 1.23
- アップデート済み: 25 3月 2020
- アクティベーション: 5
Description
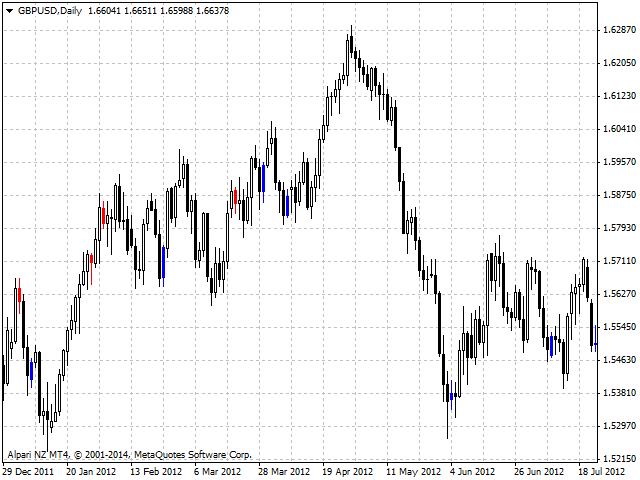
The indicator determines the appearance of internal bars on the chart, and paints them in accordance with the bullish and/or bearish mood.
The indicator can notify of the appearance of a formed internal bar by playing a beep, as well as display the time remaining until the end of the formation of the current bar in the format of <d:h:m:s, where:
- < means the current bar.
- d - days.
- h - hours.
- m - minutes.
- s - seconds.
The bullish and bearish mood can be colored.
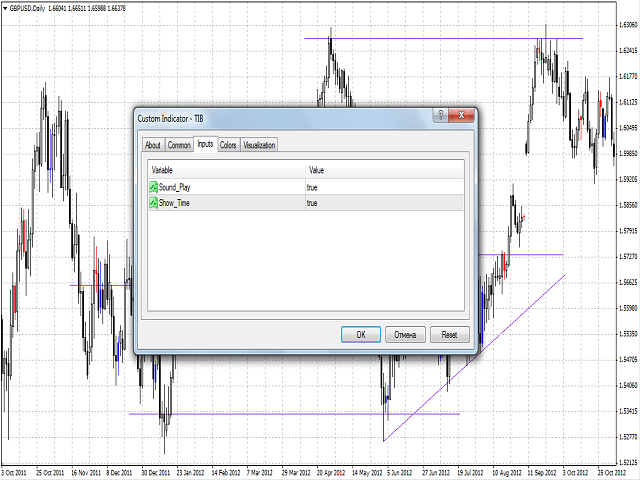
Input Parameters
- Sound_Play - a flag that allows the sound notification.
- Show_Time - a flag that allows the display of time remaining until the formation of the current bar.
Use
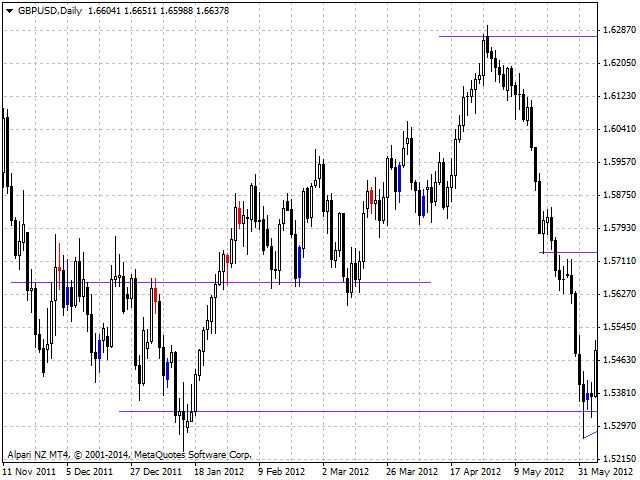
Appearance of an internal bar during a trend means that the trend is weakening and bulls and bears are in a temporary balance. This can be used as a signal for closing open positions, as well as for opening the positions opposite to the previous trend.
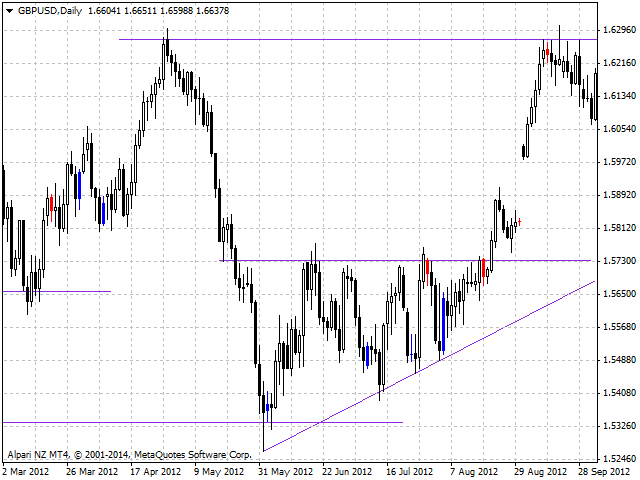
The indicator becomes more efficient if the following conditions are met:
- Closing positions or opening new ones near support/resistance levels, trend lines or Fibo levels.
- Opening positions within a day according to the bullish or bearish mood by the signal received from D1 timeframe.
See the screenshots for details.
The indicator can be used for manual or automated trading within an Expert Advisor. For automated trading it can use values of any indicator buffer of type double: 0, 1, 2 or 3. The value must not be zero!