• 概要
  • レビュー (14)
  • コメント (30)
  • 最新情報

Dual Bermaui Deviation Percent

5

Or DBD%. The indicator consists of colored tape that shows trading signals depending on two Bermaui Deviation Oscillator (BD%) and two moving averages.

Bermaui Deviation Percent is a volatility index that measures volatility in percent rather than points. The idea of BD% is to make an index depending on Classic Standard Deviation (CSD) that moves between 0 and 100 percent.

Important Information

DBD% expert advisor example:  https://www.mql5.com/en/blogs/post/731145

        If you want to know more about BD% then please read the next bog:  https://www.mql5.com/en/blogs/post/718182


        DBD% consists of two signal tapes, one is fast and the other is slow. A buy signal comes when fast and slow are bullish. A sell signal comes when both fast and slow are bearish.

        DBD% Features

               The combination of two BD% with two different periods could help at catching the different market cycles.

               Using BD% as a trend filter is a great advantage because of BD% work as a filter for low volatility movements in the market.

               Signals appear at the first opening after buy/sell conditions are met.

               Well-designed parameters to help the user easily navigate between them.

               DBD% code is revised to make sure that it will not consume the user's PC memory.

               DBD% arrows do not repaint or recalculate its results.

               DBD% sends emails and push notifications to mobile devices.

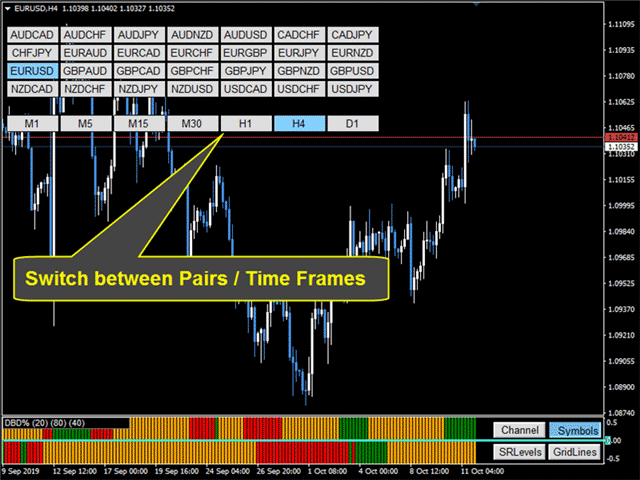
               Easily switch between different symbols or time-frames.

               Plot Standard Deviation or Linear Regression Channels to show Overbought and Oversold areas.

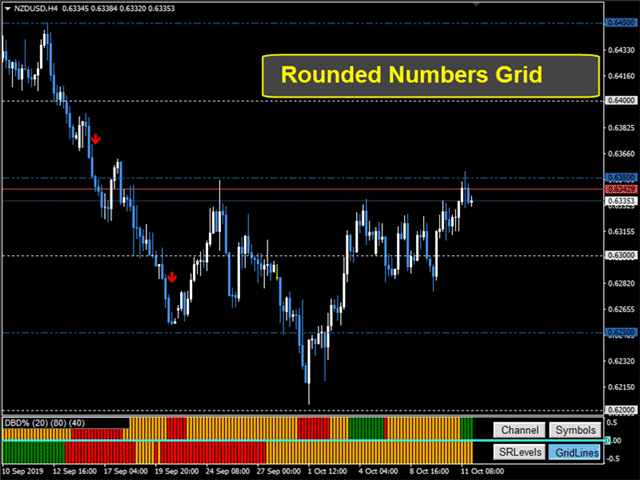
               Plot a grid of rounded numbers, which show the most important psychological levels.

               Plot Support and resistance levels that mirror supply and demand on the chart.

              DBD% Parameters Map

              1) INDICATOR SETTINGS

                    Fast DBD% Candles [Min=2]: Default is 20. Minimum is 2.

                    Slow DBD% Candles [Min=3]: Default is 80. Minimum is 3and slow should be bigger than fast at least by one candle.

                    DBD% Sideway Level: Default 40%

                  2) ALERTS & EMAIL SETTINGS

                        Alert on New Arrow: Default is true.

                        Send Email on New Arrow: Default is false.

                        Send Notification on New Arrow: Default is false.


                      3) ARROWS SETTINGS

                           Show Arrows & Lines: Default is Show Arrows Only.

                           Arrows Size: Default is one.


                          4) UTILITIES SETTINGS

                               Symbols Source From: Get symbols from custom symbol list  or from Market Watch.

                               List of symbols (separated by ";"): If you choose symbols from a custom list then separate between symbols by ";".

                               Button Font Size: Default is 10.

                               Chart on Foreground: Default is false.

                               Channel Length [ > 1 ]: Default is 100.

                               Panel Appear [Shift + Letter]: Key to press plus shift if the user wants to hide the panel. Default is " A".

                               Panel Disappear [Shift + Letter]: Key to press plus shift if the user wants to hide the panel. Default is " D".

                               Chart Colors List: Four color lists to choose from. If the user wants to use his own colors then he can choose to (Do Nothing).


                              If you have any questions then please, contact me via a private message or, write them in the comment section.
                              Muhammad Al Bermaui, CMT


                              レビュー 14
                              Hisham Ghoneim
                              296
                              Hisham Ghoneim 2021.09.22 09:39 
                               

                              I already purchase the full set EA + BD% +DBD% as i' satisfied with Elbermawi trading tool and this is not my first time dealing with his great trading tools, it is really helpful for good trading results.

                              Paulina Andrea Madariaga Figueroa
                              4107
                               

                              Very good indicator, I have spent money in another indicators and with Bermaui tools I have everything.

                              digger55
                              237
                              digger55 2020.01.15 18:08 
                               

                              Good and professional tool.

                              おすすめのプロダクト
                              "The Squeeze indicator attempts to identify periods of consolidation in a market. In general the market is either in a period of quiet consolidation or vertical price discovery. By identifying these calm periods, we have a better opportunity of getting into trades with the potential for larger moves. Once a market enters into a "squeeze," we watch the overall market momentum to help forecast the market direction and await a release of market energy." The StdATR Squeeze Channel combines standard
                              This is an intraday indicator that uses conventional formulae for daily and weekly levels of pivot, resistance and support, but updates them dynamically bar by bar. It answers the question how pivot levels would behave if every bar were considered as the last bar of a day. At every point in time, it takes N latest bars into consideration, where N is either the number of bars in a day (round the clock, i.e. in 24h) or the number of bars in a week - for daily and weekly levels correspondingly. So,
                              The indicator is the advanced form of the MetaTrader 4 standard Fibonacci tool. It is unique and very reasonable for serious Fibonacci traders. Key Features Drawing of Fibonacci retracement and expansion levels in a few seconds by using hotkeys. Auto adjusting of retracement levels once the market makes new highs/lows. Ability to edit/remove any retracement & expansion levels on chart. Auto snap to exact high and low of bars while plotting on chart. Getting very clear charts even though many ret
                              The presented indicator allows you to determine potential entry points into the market and set protective orders at reasonable levels. This product can be useful for both beginners and experienced traders. The indicator is based on calculation methods proven by time and practicing traders. The indicator is calculated in two stages: At the first stage, linear regression (LR) of the selected price type is determined for a given number of chart periods. At the second stage, the obtained data is p
                              Simple Long Short Bar A very concise and clear indicator, very easy to understand, but it is very useful for tracking trends. The usage of this indicator is very simple: Long signal: If the price shows signs of a long market, then a yellow box will appear. Short signal: If the price shows signs of a short market, then a blue box will appear. Bull strength: If the size of the box is large, it means the bull strength is strong, and vice versa. Short strength: If the size of the box is small, it m
                              The Icarus Auto Dynamic Support and Resistance  Indicator provides a highly advanced, simple to use tool for identifying high-probability areas of price-action automatically - without any manual input whatsoever. .  All traders and investors understand the importance of marking horizontal levels on their charts, identifying areas of supply and demand, or support and resistance. It is time-consuming and cumbersome to manually update all instruments, across all timeframes, and it requires regular
                              Trend formation channel is a set of lines. The two central lines of the indicator represent moving averages of the specified type and period, they also form a small channel. The large channel is formed - the central lines of the indicator plus / minus the standard deviation estimate, multiplied by the coefficient selected by the user. The basic rule for plotting is that about 5% of prices should be outside these lines, and 95% - inside. If the price crosses the upper or lower line too often, th
                              これはほぼ間違いなく、MetaTraderプラットフォームで見つけることができる最も完全な調和価格形成自動認識インジケーターです。 19種類のパターンを検出し、フィボナッチプロジェクションをあなたと同じように真剣に受け止め、潜在的逆転ゾーン(PRZ)を表示し、適切なストップロスとテイクプロフィットレベルを見つけます。 [ インストールガイド | 更新ガイド | トラブルシューティング | よくある質問 | すべての製品 ] 19の異なる調和価格形成を検出します プライマリ、派生および補完フィボナッチ投影(PRZ)をプロットします 過去の価格行動を評価し、過去のすべてのパターンを表示します この指標は、独自の品質とパフォーマンスを分析します 適切なストップロスとテイクプロフィットのレベルを表示します ブレイクアウトを使用して適切な取引を通知します すべてのパターン比をグラフにプロットします 電子メール/音声/視覚アラートを実装します スコット・M・カーニーの本に着想を得て、この指標は最も純粋で急を要するトレーダーのニーズを満たすように設計されています。ただし、トレードを
                              Fibonacci retracements can be used to draw support lines, identify resistance levels, place stop-loss orders and set target prices. The Advanced Automatic Fibonacci retracements draws automatically all the levels. You have a lot of options to choose. For exemple you can use the tracements of another time frame (MTF) in the current chart, you can also choose between the closest level or less close to draw the retracements. You can also add 2 levels of your choice. You can add levels extensions o
                              Automatic fibonacci with alerts is an indicator that automatically plots a fibonacci retracement based on the number of bars you select on the BarsToScan setting in the indicator. The fibonacci is automatically updated in real time as new highest and lowest values appear amongst the selected bars. You can select which level values to be displayed in the indicator settings. You can also select the color of the levels thus enabling the trader to be able to attach the indicator several times with d
                              Indicator FiboZag - transfer the indicator to the chart and the Fibonacci levels will be built automatically on the last ZigZag turn. The main advantage lies in the correct construction of Fibonacci levels and markup of price levels. Simple, visual and effective use. The indicator is not redrawn and does not lag. Works on all currency pairs and on all timeframes.
                              TSO Bollinger Bandit Strategy is an indicator based on the Bollinger Bandit Trading Strategy as presented in the book Building Winning Trading Systems with TradeStation by G. Pruitt and J. R. Hill. SCANNER is included . Now with Scanner you can find trading opportunities and setups easily and faster. Features A complete entry and exit strategy for trending markets. Get email / push notifications when an entry signal occurs. The indicator is not repainting. Can easily be used in an EA. (see For
                              Fibonaccitools
                              Aymn Sʿyd Ahmd Hsn Alkwmy
                              フィボナッチリトレースメントは、トレーダーがサポートラインを描き、レジスタンスレベルを特定し、ストップロス注文を出し、目標価格を設定するために使用できる人気のあるツールです。 フィボナッチリトレースメントは、株価チャートの2つの極値を取り、垂直距離を23.6%、38.2%、50%、61.8%、および100%の主要なフィボナッチ比率で割ることによって作成されます。 フィボナッチツールインジケーターはフィボナッチツールを描画します。 リトレースメント、アーク、ファン、拡張、タイムゾーン。 ジグザグインジケーターに基づく」 ʻO nā retrofement Fibonacci nā mea hana kaulana i hiki i nā mea kālepa ke hoʻohana e huki ai i nā laina kākoʻo, ʻike i nā pae kūʻē, hoʻonohonoho i nā kauoha kū-lilo, a hoʻonohonoho i nā kumukūʻai pahuhopu. Hoʻokumu ʻia kahi Fibonacci r
                              Crazy Dancing moving RES/SUP Levels Automatic redrawing of moving Supports and resistances levels  to indicate price breaking supports (signal SELL)  or breaking resistance levels (signal BUY) Very simple appearing indicator but very clever and smart too !!!! Main Inputs: # of bars for the support and resistances levels + the initial shift from start + moving average for filter signaling Smaller values for bars /shift inputs when using Higher Time frames (D1-H4) and the reverse higher values for
                              VR Cub
                              Vladimir Pastushak
                              VR Cub は、質の高いエントリーポイントを獲得するためのインジケーターです。このインジケーターは、数学的計算を容易にし、ポジションへのエントリーポイントの検索を簡素化するために開発されました。このインジケーターが作成されたトレーディング戦略は、長年にわたってその有効性が証明されてきました。取引戦略のシンプルさはその大きな利点であり、初心者のトレーダーでもうまく取引することができます。 VR Cub はポジション開始ポイントとテイクプロフィットとストップロスのターゲットレベルを計算し、効率と使いやすさを大幅に向上させます。取引の簡単なルールを理解するには、以下の戦略を使用した取引のスクリーンショットを見てください。 設定、設定ファイル、デモ版、説明書、問題解決方法は、以下から入手できます。 [ブログ] レビューを読んだり書いたりすることができます。 [リンク] のバージョン [MetaTrader 5] エントリーポイントの計算ルール ポジションをオープンする エントリーポイントを計算するには、VR Cub ツールを最後の高値から最後の安値までストレッチする必要があります。
                              The indicator displays Renko bars on the chart, uses them to plot the ZigZag - trend lines connecting the local Lows and Highs of the price movement, and highlights them based on the Gartley patterns, showing the potential price reversal points. Renko - specialized display of the price action, in which the graph is displayed not every bar of the time frame, but only under the condition that the price had passed more than the specified number of points. Renko bars are not bound to a time frame, s
                              Bermaui Bands
                              Muhammad Elbermawi
                              4.94 (89)
                              Bermaui Bands(BB)は、レンジとトレンドの価格変動をフィルタリングするのに役立つテクニカル分析ツールです。この指標の背後にある考え方は、次のステップで説明できます。 標準偏差を0〜100の間で移動するオシレーターとして計算します。これをBermaui偏差パーセント(BD%)と名付けます。 「BD%」がゼロに近い場合、ボラティリティは極端になります。さらに、「BD%」が100に近い場合、ボラティリティは非常に低くなります。 ボラティリティが高いということは、トレンド市場の可能性が高いことを意味し、ボラティリティが低いということは、横向きまたはレンジング市場を意味します。 標準偏差はSMAに基づいて計算されるため、中央の線は単純移動平均(SMA)です。 計算で同じバー数の単純移動平均に「BD%」を追加して、アッパーベルマウイバンドを取得します。 計算で同じ数のバーを使用した単純な移動平均から「BD%」を減算して、Lower BermauiBandsを取得します。 重要な情報 Bermaui Bandsユーザーズマニュアル: https://www.mql5.com/en/b
                              The Sextet Scalper Pro  is an MT4 indicator that gives signals when new waves are starting in a trend. The trends are calculated using the original " The Sextet " indicator method. You get a free EA to trade with The Sextet Scalper Pro: Free EA . Default settings were optimized on GBPUSD H1 from 2017. EA could be tested on free demo version of The Sextet Scalper Pro, before purchase. Key Features: Uses The Sextet Trend Detection Method which is already a good strategy in itself for detecting l
                              PABT Pattern Indicator - it's classical system one of the signal patterns. Indicator logic - the Hi & Lo of the bar is fully within the range of the preceding bar, look to trade them as pullback in trend. In the way if indicator found PABT pattern it's drawing two lines and arrow what showing trend way.  - First line - it's entry point and drawing at: 1. On the high of signal bar or on middle of the signal bar (depending from indicator mode) for buy; 2. On the low of signal bar or on middle of t
                              Noize Absorption Index - is the manual trading system that measures the difference of pressure between bears forces and bulls forces. Green line - is a noize free index that showing curent situation. Zero value of index shows totally choppy/flat market.Values above zero level shows how powerfull bullish wave is and values below zero measures bearish forces.Up arrow appears on bearish market when it's ready to reverse, dn arrow appears on weak bullish market, as a result of reverse expectation. S
                              This is a well-known ZigZag indicator. But it differs by the fact that its plot is based on values of the middle line which is set by a user. It can display Andrews’ Pitchfork and standard or Bobokus Fibo levels. NO REPAINTING. Parameters Period МА — middle line period. Default value is 34. Minimum value is 4. Maximum value is set at your discretion. Used to calculate price - base price to calculate the middle line. The averaging method - method of smoothing the middle line. Turning pitchfork
                              A top-quality implementation of the famous  Zig Zag  indicator, which needs no introduction. It is completely coming from original algorithm.  After you have this indicator, you will no need any more indicator for opposite direction of trend. Trading direction of TREND Very easy to understand and set  It implements a multi-timeframe dashboard Buy and Sell signals on same chart  Working M5-M15-M30-H1-H4 and D1  After the purchase, please contact me for to learn how to use it. 
                              "The trend is your friend" is one of the best known sayings in investing, because capturing large trendy price movements can be extremely profitable. However, trading with the trend is often easier said than done, because many indicators are based on price reversals not trends. These aren't very effective at identifying trendy periods, or predicting whether trends will continue. We developed the Trendiness Index to help address this problem by indicating the strength and direction of price trend
                              LordTrendSignal is a financial market indicator for Meta Trader that checks signals through trends and candles, works on all TimeFrames (M1, M5, M15, M30, H1, H4, D1). LordTrendSignal checks the signal through trends and candles and informs you via notification, alerts via email and push on the automatic screen. The trend flexibility of LordTrendSignal is high, however, together with other of our indicators LordAutoFibonacci and LordAutoTrendLine you will be able to work very well to obtain
                              The Arrows Forecasters indicator is simple, visual and effective trend detection. The intelligent algorithm of the indicator determines the trend with a good probability. Uses just one parameter for settings. The indicator shows the points of potential market reversal. Ready-made trading system. The indicator does not redraw and does not lag. Works on all currency pairs and on all timeframes. You should remember that using a combination of forecasting tools, it is advisable to choose 2-3 indi
                              Níveis de suporte ou resistência formados quando a ação do preço de um mercado reverte e muda de direção, deixando para trás um pico ou vale (ponto de oscilação) no mercado. Os níveis de suporte e resistência podem criar faixas de negociação. O indicador identifica High e Low com base no Período. Características principais Um conceito chave da análise técnica é que quando um nível de resistência ou suporte é quebrado, seu papel é invertido. Se o preço cair abaixo de um nível de suporte, esse
                              Trend Divergence Finder – индикатор, позволяющий выявлять дивергенции цены и графика выбранного индикатора. С помощью Trend Divergence Finder вы сможете подобрать тот индикатор, который наиболее эффективен для Вас, и использовать его с наглядным отображением на графике. В индикатор включены 9 базовых индикаторов : 1.        RSI 2.        MACD 3.        MOMENTUM 4.        RVI 5.        STOCHASTIC 6.        CCI 7.        Standard Deviation 8.        Derivative 9.        William Blau Присутст
                              This is a new strategy for SUPPLY DEMAND areas It is based on a calculation using the tick volume to detect the big price action in market for both bear /bull actions this smart volume action candles are used to determine the supply and demand areas prices in between main supply and demand lines indicate sideway market  up arrows will be shown when prices moves above the main supply and the secondary supply lines Down arrows will be shown when prices moves below the main demand and the secondary
                              DMS Fibo
                              Diogo Mitsunaga Dos Santos
                              Fibonacci retracements are trend lines drawn between two significant points, usually between absolute lows and absolute highs, plotted on a chart. Intersecting horizontal lines are placed at the Fibonacci levels. Fibonacci retracements are useful tools that help traders identify support and resistance levels. With the information gathered, they can place orders, identify stop-loss levels, and set price targets. Although useful, traders often use other indicators to make more accurate assessments
                              BeST Swing Strategy is a Metatrader indicator based on the corresponding Jim Berg's work about volatility as described in his article "The Truth About Volatility" (TASC 2/2005).The indicator consists of 2 channel lines deriving as (MA +/- times the ATR) and can be used as a standalone trading system.The outlier prices of the Market as of the indicator's values can be used for producing Entry and Exit Signals. Advantages of the indicator == Uses 2 Swing Strategies (Normal and Reverse) == Ne
                              このプロダクトを購入した人は以下も購入しています
                              Gann Made Easy は、ミスター・ギャンの理論を使用した取引の最良の原則に基づいた、プロフェッショナルで使いやすい外国為替取引システムです。 W・D・ガン。このインジケーターは、ストップロスとテイクプロフィットレベルを含む正確な買いと売りのシグナルを提供します。 PUSH通知を利用して外出先でも取引可能です。 購入後はご連絡ください!私の取引のヒントと素晴らしいボーナスインジケーターを無料で共有します! おそらく、ギャンの取引手法についてはすでに何度も聞いたことがあるでしょう。通常、ギャンの理論は初心者のトレーダーだけでなく、すでにある程度の取引経験がある人にとっても非常に複雑なものです。なぜなら、ギャンの取引手法は理論的にはそれほど簡単に適用できるものではないからです。私はその知識を磨き、最良の原則を私の外国為替インジケーターに組み込むために数年を費やしました。 このインジケーターは非常に簡単に適用できます。必要なのは、それをチャートに添付し、簡単な取引推奨事項に従うだけです。このインジケーターは常に市場分析の仕事を行い、取引の機会を探します。適切なエントリーポイントを検出
                              驚異的なFXインジケーター「Miraculous」をご紹介します。完璧な結果を得るための1時間足を含むすべてのタイムフレームで効果的に機能する、最強の強力な特殊MT4フォレックスインジケーターです。 すべてのタイムフレームで優れた結果を提供する最高のFXインジケーターを探し続けるのに疲れましたか?これ以上探す必要はありません!「Miraculous」フォレックスインジケーターをご紹介します。このインジケーターは、トレーディングの経験を変革し、収益を新たなレベルに引き上げるために設計されました。 先進のテクノロジーと長年にわたる緻密な開発に基づいて構築された「Miraculous」フォレックスインジケーターは、FX市場における力と正確さの頂点となります。この素晴らしいツールは、すべてのレベルのトレーダーのニーズを満たすように設計されており、一貫した収益性を追求する上で比類のない優位性を提供します。 「Miraculous」フォレックスインジケーターの他との違いは、その非常に適応性にあります。デイトレーダー、スウィングトレーダーであろうと、長期ポジションを好む方であろうと、このインジケータ
                              現在20%OFF! 初心者やエキスパートトレーダーのためのベストソリューション! このダッシュボードソフトウェアは、28の通貨ペアで動作しています。それは私達の主要な指標(高度な通貨の強さ28と高度な通貨インパルス)の2に基づいています。それは全体の外国為替市場の大きい概観を与えます。それは、すべての(9)時間枠で28の外国為替ペアのための高度な通貨の強さの値、通貨の動きの速度と信号を示しています。チャート上で1つのインディケータを使用して市場全体を観察し、トレンドやスキャルピングの機会をピンポイントで見つけることができたら、あなたのトレードがどのように改善されるか想像してみてください。 このインディケータには、強い通貨と弱い通貨の識別、潜在的な取引の識別と確認がより簡単になるような機能が搭載されています。このインディケータは、通貨の強さや弱さが増加しているか減少しているか、また、すべての時間枠でどのように機能しているかをグラフィカルに表示します。 新機能として、現在の市場環境の変化に適応するダイナミックなマーケットフィボナッチレベルが追加され、すでに当社のAdvan
                              TPSpro TRENDPRO  - is a trend indicator that automatically analyzes the market and provides information about the trend and each of its changes, as well as giving signals for entering trades without redrawing! The indicator uses each candle, analyzing them separately. referring to different impulses - up or down impulse. Exact entry points into transactions for currencies, crypto, metals, stocks, indices!  -  Version MT5               DETAILED DESCRIPTION        /       TRADING SETUPS           
                              A key element in trading is zones or levels from which decisions to buy or sell a trading instrument are made. Despite attempts by major players to conceal their presence in the market, they inevitably leave traces. Our task was to learn how to identify these traces and interpret them correctly. Reversal First Impulse levels (RFI)   -  Version MT5                INSTRUCTIONS                 RUS                 ENG                                       R ecommended to use with an indicator   -  
                              現在26%オフ 初心者やエキスパートトレーダーに最適なソリューション! このインジケーターは、独自の機能と新しい計算式を取り入れた、ユニークで高品質、かつ手頃な価格のトレーディングツールです。たった1枚のチャートで28の為替ペアの通貨強度を読み取ることができます。新しいトレンドやスキャルピングチャンスの引き金となるポイントを正確に特定することができるので、あなたのトレードがどのように改善されるか想像してみてください。 ユーザーマニュアルはこちら  https://www.mql5.com/en/blogs/post/697384 これが最初の1本、オリジナルだ! 価値のないクローンを買わないでください。 特別な サブウィンドウの矢印で強い通貨の勢いを表示 GAPがあなたのトレードを導く! 基準通貨や気配値が売られすぎ・買われすぎのゾーン(外相フィボナッチレベル)にあるとき、個別チャートのメインウィンドウに警告表示。 通貨がレンジの外側から反落した場合、プルバック/リバーサルのアラート。 クロスパターンの特別なアラート 複数の時間枠を選択可能で、トレンドを素早く
                              まず第一に、この取引インジケーターは再描画されず、再描画されず、遅延しないことを強調する価値があります。これにより、手動取引とロボット取引の両方に理想的なものになります。 アトミックアナリストは、価格の強さとモメンタムを利用して市場でより良いエッジを見つけるためのPA価格アクションインジケーターです。ノイズや誤ったシグナルを除去し、取引ポテンシャルを高めるための高度なフィルターを備えています。複雑なインジケーターの複数のレイヤーを使用して、アトミックアナリストはチャートをスキャンし、複雑な数学的計算をシンプルなシグナルと色に変換します。これにより、どのような初心者トレーダーでも理解して使用し、一貫した取引の決定を行うことができます。 「アトミックアナリスト」は、新規および経験豊富なトレーダー向けにカスタマイズされた包括的な取引ソリューションです。プレミアムインジケーターとトップノッチの機能を1つの取引戦略に組み合わせ、すべてのタイプのトレーダーにとって汎用性のある選択肢にします。 デイリートレーディングとスキャルピング戦略:高速で正確なデイトレーディングおよび短期トレード
                              An exclusive indicator that utilizes an innovative algorithm to swiftly and accurately determine the market trend. The indicator automatically calculates opening, closing, and profit levels, providing detailed trading statistics. With these features, you can choose the most appropriate trading instrument for the current market conditions. Additionally, you can easily integrate your own arrow indicators into Scalper Inside Pro to quickly evaluate their statistics and profitability. Scalper Inside
                              Trend Screener
                              STE S.S.COMPANY
                              4.83 (86)
                              トレンドインジケーター、1つのツールに組み込まれたすべての重要なトレンド機能を備えたトレンドトレーディングとフィルタリングのための画期的なユニークなソリューション! これは、すべてのシンボル/商品(外国為替、商品、暗号通貨、インデックス、株式)で使用できる100%再描画されていないマルチタイムフレームおよびマルチ通貨インジケーターです。 トレンドスクリーナーは、チャート内のドットで矢印トレンドシグナルを提供するインジケーターに続く効率的なインジケーターです。 トレンド分析インジケーターで使用できる機能: 1.トレンドスキャナー。 2.最大利益分析を備えたトレンドライン。 3.トレンド通貨強度メーター。 4.アラート付きのトレンド反転ドット。 5.アラート付きの強いトレンドドット。 6.トレンド矢印 毎日の分析例、毎日のシグナルパフォーマンス...など、トレンドスクリーナーインジケーターを使用して、ここで見つけることができます: ここをクリックしてください 期間限定オファー:トレンドスクリーナーインジケーターは、50ドルと生涯でのみご利用いただけます。 (元の価格125 $) MQ
                              TrendMaestro
                              Stefano Frisetti
                              5 (2)
                              note: this indicator is for METATRADER4, if you want the version for METATRADER5 this is the link: TRENDMAESTRO recognizes a new TREND in the bud, he never makes mistakes. The certainty of identifying a new TREND is priceless. DESCRIPTION TRENDMAESTRO identifies a new TREND in the bud, this indicator examines the volatility, volumes and momentum to identify the moment in which there is an explosion of one or more of these data and therefore the moment in which prices have strong probability of f
                              まず第一に、この取引ツールはノンリペイント、ノンリドロー、ノンラグの指標であり、プロの取引に理想的ですことを強調する価値があります。 スマートプライスアクションコンセプトインジケーターは、新米から経験豊富なトレーダーまで、非常 に強力なツールです。Inner Circle Trader AnalysisやSmart Money Concepts Trading Strategiesなど、20以上の有用な指標を1つに組み合わせています。このインジケーターはスマートマネーコンセプトに焦点を当て、大手機関の取引方法を提供し、彼らの動きを予測するのに役立ちます。 特に、流動性分析に優れており、機関がどのように取引しているかを理解しやすくしています。市場のトレンドを予測し、価格の動きを慎重に分析するのに優れています。機関の戦略とトレードを合わせることで、市場の動向についてより正確な予測ができます。このインジケーターは多目的であり、市場構造を分析し、重要な注文ブロックを特定し、さまざまなパターンを認識するのに優れています。 このインジケーターはBOSやCHoCHなどのパターンの識
                              Step into the realm of Forex trading with confidence and precision using XQ, a cutting-edge Forex indicator designed to elevate your trading game to unprecedented heights. Whether you're a seasoned trader or just stepping into the world of currency exchange,   XQ Forex Indicator   empowers you with the insights and signals needed to make informed trading decisions. The signal conditions are a combination of three indicators, and XQ Forex Indicator only display  medium and long-term trends . The
                              カスタムMT4インジケーターで外国為替取引を成功させるための秘密を発見してください! 外国為替市場で成功を達成し、リスクを最小限に抑えながら一貫して利益を得る方法を疑問に思ったことはありますか? これがあなたが探している答えです! 取引へのアプローチに革命をもたらす独自のMT4インジケーターを導入できるようにします。 ユニークな汎用性 私たちのインジケータは、RenkoとRangeBarのろうそくのフォーメーションを好むユーザー向けに特別に設計されています。 これらのチャートタイプは多くの経験豊富なトレーダーに好まれていることを理解しています。そのため、私たちのインジケーターはそれらとシームレスに統合され、比類のない市場分析を提供します。 クリアトレンドシグナル 複雑な分析を忘れてください! 私たちのインジケーターは、鮮やかな色と明確なドット構造を利用して、市場の動向を明確に示しています。 赤と青の点は、価格の動きの方向性について疑いの余地がなく、取引の迅速な意思決定を可能にします。 HH/HL HL/LL戦略とのアライメント HH/HLおよびHL/LL構
                              通貨強さウィザードは、取引を成功させるためのオールインワン ソリューションを提供する非常に強力な指標です。このインジケーターは、複数の時間枠のすべての通貨のデータを使用して、このまたはその外国為替ペアのパワーを計算します。このデータは、使いやすい通貨インデックスと通貨パワーラインの形式で表され、特定の通貨のパワーを確認するために使用できます。 必要なのは、取引したいチャートにインジケーターを接続することだけです。インジケーターは、取引する通貨の実際の強さを示します。このインジケーターは、トレンドに合わせて取引するときに有利に利用できる売買高の圧力の極値も示します。このインジケーターには、フィボナッチに基づく可能なターゲットも表示されます。 このインジケーターは、PUSH 通知を含むあらゆるタイプのアラートを提供します。 購入後ご連絡下さい。私の取引のヒントをあなたと共有し、素晴らしいボーナスインジケーターを無料で提供します! 幸せで有益な取引をお祈りします。
                              Advanced Supply Demand
                              Bernhard Schweigert
                              4.92 (310)
                              現在33%オフ 初心者にもエキスパートトレーダーにも最適なソリューション このインジケーターは独自の機能と新しい公式を多数内蔵しており、ユニークで高品質かつ手頃な取引ツールです。このアップデートでは、2つの時間枠ゾーンを表示できるようになります。より長いTFだけでなく、チャートTFとより長いTF(ネストゾーンを表示)の両方を表示できます。すべてのSupply Demandトレーダーの皆さんのお気に召すはずです。:) 重要情報の公開 Advanced Supply Demandの可能性を最大化するには、 https://www.mql5.com/ja/blogs/post/720245 にアクセスしてください。   エントリーまたはターゲットの正確なトリガーポイントを正確に特定できれば取引がどのように改善されるか想像してみてください。新しい基盤となるアルゴリズムに基づいて構築されているため、買い手と売り手の間の潜在的な不均衡をさらに簡単に特定できます。これは、最も強い需要と供給のゾーンと、過去のパフォーマンス(古いゾーンを表示)がグラフィカルに表現されるためです。これらの機能は、最適
                              ご紹介   クォンタム トレンド スナイパー インジケーターは 、トレンド反転を特定して取引する方法を変革する画期的な MQL5 インジケーターです。 13年以上の取引経験を持つ経験豊富なトレーダーのチームによって開発されました。     クォンタムトレンドスナイパーインジケーター   は、非常に高い精度でトレンドの反転を識別する革新的な方法で、あなたのトレーディングの旅を新たな高みに押し上げるように設計されています。 ***Quantum Trend Sniper Indicatorを購入すると、Quantum Breakout Indicatorを無料で入手できます!*** クォンタム ブレイクアウト インジケーターは、トレンドの反転を特定するとアラートを発し、矢印を示し、3 つのテイクプロフィットレベルを提案します。 初心者トレーダーにもプロのトレーダーにも適しています。 量子EAチャネル:       ここをクリック MT5のバージョン:       ここをクリック 推奨事項: 期間: すべての時間枠。最良の結果を得るには、
                              ご紹介     Quantum Breakout PRO は 、ブレイクアウト ゾーンの取引方法を変革する画期的な MQL5 インジケーターです。 13年以上の取引経験を持つ経験豊富なトレーダーのチームによって開発された Quantum Breakout PROは 、革新的でダイナミックなブレイクアウトゾーン戦略により、あなたの取引の旅を新たな高みに押し上げるように設計されています。 クォンタム ブレイクアウト インジケーターは、5 つの利益ターゲット ゾーンを備えたブレイクアウト ゾーン上のシグナル矢印と、ブレイクアウト ボックスに基づいたストップロスの提案を提供します。 初心者トレーダーにもプロのトレーダーにも適しています。 量子EAチャネル:       ここをクリック MT5バージョン:   ここをクリック 重要!購入後、インストールマニュアルを受け取るためにプライベートメッセージを送ってください。 推奨事項: 時間枠: M15 通貨ペア: GBPJPY、EURJPY、USDJPY、NZDUSD、XAUUSD アカウントの種類: ECN、Raw、また
                              の紹介     Quantum平均足PRO チャート 市場のトレンドに対する明確な洞察を提供するように設計された平均足キャンドルは、ノイズを除去し、誤ったシグナルを排除する能力で知られています。混乱を招く価格変動に別れを告げ、よりスムーズで信頼性の高いチャート表現を導入しましょう。 Quantum Heiken Ashi PRO を真にユニークなものにしているのは、従来のローソク足データを読みやすい色のバーに変換する革新的なフォーミュラです。赤と緑のバーはそれぞれ弱気トレンドと強気トレンドをエレガントに強調し、潜在的なエントリーポイントとエグジットポイントを驚くほど正確に見つけることができます。 量子EAチャネル:       ここをクリック MT5のバージョン:       ここをクリック この注目すべき指標には、いくつかの重要な利点があります。 明確性の向上: 価格変動を平滑化することで、平均足バーは市場トレンドをより明確に表現し、有利な取引機会を特定しやすくします。 ノイズの削減: 誤ったシグナルを引き起こすことが多い不安定な価格変動に別れを告げます。 Quan
                              ON Trade Waves Patterns Harmonic Elliot Wolfeをご紹介します。これは手動および自動の方法を使用して市場のさまざまなパターンを検出するために設計された高度なインジケーターです。以下はその動作方法です: ハーモニックパターン: このインジケーターは、チャートに表示されるハーモニックパターンを識別できます。これらのパターンは、Scott Carneyの「Harmonic Trading vol 1および2」で説明されているように、ハーモニックトレーディング理論を実践するトレーダーにとって重要です。手動で描画するか、自動検出に頼るかにかかわらず、ON Trade Waves Patternsがお手伝いします。 コントロールパネル: このインジケーターはユーザーフレンドリーなコントロールパネルを備えています。チャートと時間枠の設定を保存し、異なる構成間をスムーズに切り替えることができます。チャートスペースを最大限に活用するために最小化することもできます。他の分析ツールで作業することを好む場合、閉じるボタンをクリックするだけで、すべてのインジケーターデ
                              Scalper Vault は、スキャルピングを成功させるために必要なすべてを提供するプロフェッショナルなスキャルピング システムです。このインジケーターは、外国為替およびバイナリー オプションのトレーダーが使用できる完全な取引システムです。推奨される時間枠は M5 です。 システムは、トレンドの方向に正確な矢印シグナルを提供します。また、トップとボトムのシグナルとギャン マーケット レベルも提供します。 インジケーターは、プッシュ通知を含むすべてのタイプのアラートを提供します。 インジケータの購入後にご連絡ください。私の個人的な取引の推奨事項と素晴らしいボーナス指標を無料で共有します! 幸せで有益な取引をお祈りします!
                              PRO Renko Systemは、特別にRENKOチャートを取引するために設計された高精度の取引システムです。 これは、様々な取引商品に適用することができる普遍的なシステムです。 システムは効果的に正確な逆転信号へのアクセスを与えるいわゆる市場の騒音を中和する。 表示器は非常に使いやすく、信号の生成に責任がある1つの変数だけがあります。 あなたは簡単にお好みの任意の取引ツールとレンコバーのサイズにツールを適応させることができます。 私はいつもあなたが私のソフトウェアで収益性の高い取引を支援するために余分なサポートを提供する準備ができています! 私はあなたに幸せで収益性の高い取引をしたいです! ご購入後にご連絡ください! 私はあなたに私のレンコチャートジェネレータを送信します。 私はまた、私の個人的な推奨事項やシステムの他のモジュールを無料で共有します!
                              mql5と Telegramの モーニング・ブリーフィングで、詳細とスクリーンショットを含む毎日のマーケット・アップデートをご覧 ください! FX Power MT4 NGは 、長年の人気を誇る通貨強度計FX Powerの次世代モデルです。 この次世代ストレングスメーターは何を提供するのでしょうか?初代FXパワーの魅力すべて プラス GOLD/XAUの強さ分析 より正確な計算結果 個別に設定可能な分析期間 カスタマイズ可能な計算上限値により、さらに優れたパフォーマンスを実現 もっと見たい人のための特別なマルチインスタンス設定 すべてのチャートでお好みの色を無限に設定可能 数え切れないほどの通知オプションにより、重要なことを見逃すことはありません。 Windows 11とmacOSのスタイルで角を丸くした新しいデザイン 魔法のように動くインジケーターパネル FXパワーの主な機能 すべての主要通貨の強さの完全な履歴 すべての時間枠における通貨の強さの履歴 すべてのブローカーとチャートで同一の計算結果 100%信頼できるリアルタイム計算 -> リペイントなし ドロップダウン・リストから
                              現在31%オフ! 初心者やエキスパートトレーダーに最適なソリューション! このインジケータは、独自の機能と秘密の数式を組み込んだ、ユニークで高品質かつ手頃な価格のトレーディングツールです。たった1枚のチャートで28の通貨ペアのアラートを表示します。新しいトレンドやスキャルピングチャンスの引き金となるポイントを正確に把握することができるので、あなたのトレードがどのように改善されるか想像してみてください! 新しい基本的なアルゴリズムに基づいて構築されているため、潜在的な取引の特定と確認がより簡単になります。これは、通貨の強さや弱さが加速しているかどうかをグラフィカルに表示し、その加速のスピードを測定するためです。加速すると物事は明らかに速く進みますが、これはFX市場でも同じです。つまり、反対方向に加速している通貨をペアにすれば、利益を生む可能性のある取引を特定することができるのです。 通貨の勢いを示す縦の線と矢印は、あなたの取引の指針となるでしょう。 ダイナミックマーケットフィボナッチ23レベルはアラートトリガーとして使用され、市場の動きに適応します。もしインパルスが黄色
                              まず最初に、このトレーディングシステムがリペイントされず、再描画されず、遅延しないことを強調する価値があります。これにより、プロのトレーディングに最適な状態になります。 「スマートサポートアンドレジスタンストレーディングシステム」は、新規および経験豊富なトレーダー向けにカスタマイズされた高度なインジケーターです。この包括的なシステムは、7以上の戦略、10のインジケーター、およびデイトレード戦略、スイングトレード戦略、サポートおよびレジスタンス戦略、ローソク足パターン戦略、VWAP戦略、マルチタイムフレームトレンド戦略など、さまざまなトレーディングアプローチを組み合わせています。これは、矢印信号、エントリーポイント、出口ポイント、トレードアラート、より高い時間枠のトレンド分析、リアルタイムのトレードモニタリング、そして洞察力のあるトレンドとボリュームキャンドルの着色を提供します。自動的なサポートとレジスタンスの検出により、さまざまな市況下でトレーダーが的確な決定を下すのを支援する多面的なインジケーターとなっています。 スマートサポートアンドレジスタンストレーディングシステムは、
                              TrendDecoder Premium
                              Christophe, Pa Trouillas
                              5 (2)
                              レンジと次の動きを特定    |  トレンドの最も早いシグナルと強さを得る   |  反転の前に明確な出口を得る   |  価格がテストするフィボ・レベルを見つける。 非リペイント、非遅延インディケータ - マニュアルおよび自動売買に最適 - すべての資産、すべての時間単位に対応 期間限定キャンペーン   >> 50%OFF 購入後、 推奨セッティングについては、このチャンネルで私に連絡してください。 MT5 バージョン: ここをクリック BladeSCALPER   と   PowerZONES   を使った完全な方法を入手する どのようなものですか? TrendDECODERは、トレンド監視をシンプルかつ簡単にするための複数のイノベーションを集約したものです。 Projective TrendLine (投影トレンドライン) - 今後のトレンドのスピードリファレンス。 RealTime TrendLine vs. Projective TrendLine (リアルタイムトレンドライン vs. Projective TrendLine) - 市場が同じ方
                              Zeusインジケーターのご紹介:トレーディングでの究極の利益ブレークスルーをサポートするツール。 このインジケーターは、ブレイクアウト戦略と深い分析の必要性を排除し、トレーディングを簡素化します。設定した時間フレームに基づいてゾーンを自動的に描画し、ストップロス(SL)、テイクプロフィット(TP)、トレーリングストップのレベルを提案します。 Zeusインジケーターは、価格が買いポイントまたは売りポイントに近づいた際に、すぐに通知し、シグナル矢印を表示します。さらに、4つの異なるテイクプロフィットレベルとさまざまなトレーリングストップオプションの推奨も行います。 このツールは初心者から熟練のトレーダーまで対応しています。 チャンネルサポート: こちらをクリック ストア: こちらをクリックしてください。 MT5バージョン: こちらをクリック おすすめ: 時間枠: M5またはM15 通貨ペア: すべての通貨ペアと互換性があります アカウントタイプ: すべてのアカウントタイプと互換性があります おすすめのストップロス: Zeusインジケーターが提供するSLの提案をご利用ください おすすめの
                              Cycle Sniper
                              Elmira Memish
                              4.41 (34)
                              NEW YEAR SALE PRICE FOR LIMITED TIME!!! Please contact us after your purchase and we will send you the complimentary indicators to complete the system Cycle Sniper is not a holy grail but when you use it in a system which is explained in the videos, you will feel the difference. If you are not willing to focus on the charts designed with Cycle Sniper and other free tools we provide, we recommend not buying this indicator. We recommend watching the videos about the indiactor and system before pu
                              TakePropips Donchian Trend Pro
                              Eric John Pajarillaga Aldana
                              4.82 (17)
                              TakePropips Donchian Trend Pro   (MT4) は、ドンチャン チャネルを使用してトレンドの方向を自動的に検出し、エントリーとエグジットの取引シグナルを提供する強力で効果的なツールです! この多機能インジケーターには、トレンド スキャナー、取引シグナル、統計パネル、スクリーナー、取引セッション、およびアラート履歴ダッシュボードが含まれます。取引シグナルを提供し、チャートを分析する時間を節約するように設計されています! ユーザー マニュアルとインストール ガイドは、ブログ投稿 (   https://www.mql5.com/en/blogs/post/751368   ) からダウンロードできます。 今日は 50% オフ! 98ドルから49ドルに値下げ! このインジケーターは、ストラテジー テスターでテストできます (ビジュアル モードを有効にします)。ライブ チャートでテストしたい場合は、7 日間の試用版を入手するようにメッセージを送ることもできます。 詳細については、説明の下にあるビデオ チュートリアルも利用できます。 ご不明な点やサポートが必
                              This indicator is unstoppable when combined with our other indicator called Katana . After purchase, send us a message and you could get Katana  for FREE as a BONUS!  You can also ask to join our private group where we discuss together with other members!  MT5 version: click here There are limited copies available at $49! Next price is $99. Don't miss this great deal!  The Trend Forecasting indicator is a very unique & easy tool that is able to make prediction about future pric
                              IX Powerは 、FX Powerの無敵の精度をついにFX以外のシンボルにも提供します。 お気に入りの指数、株式、コモディティ、ETF、さらには暗号通貨の短期、中期、長期のトレンドの強さを正確に判断します。 お使いの端末が提供する すべてを分析する ことができます。ぜひお試しいただき、取引 タイミングが大幅に改善 されることをご体験ください。 IXパワーの主な特徴 100%正確で再描画されない計算結果 - ターミナルで利用可能なすべての取引シンボルに対して 予め設定され、さらに個別に設定可能な強度分析期間のドロップダウン選択 Eメール、メッセージ、モバイル通知による無数の通知オプション EAリクエストのためのアクセス可能なバッファ カスタマイズ可能な計算制限により、さらに優れたパフォーマンスを実現 もっと見たい人のための特別なマルチインスタンス設定 すべてのチャートでお好みの色を無限に設定可能 Windows 11とmacOSのスタイルで角を丸くした新しいパネルデザイン サブ・ウィンドウとメイン・チャートの間をシームレスに移動する、魔法のように動く
                              作者のその他のプロダクト
                              Moving Average Cloud
                              Muhammad Elbermawi
                              4.93 (14)
                              または「MAC」。 これは、トレンドをキャプチャしてトレードするのに役立つように設計されたインジケーターです。この指標の背後にある考え方は、次のステップで説明できます。 移動の速い平均エンベロープを描画します。 移動の遅い平均エンベロープを描画します。 MACアッパーバンドは、両方のエンベロープの高値の間の最大値です。 MAC下限帯域は、両方のエンベロープの下限間の最小値です。 MACヒストグラムクラウドは、2つのバンド間の距離を埋めて、方向の変化を示します。 青い雲は上昇傾向を示し、赤い雲は下降傾向を示します。 次のブログを読んで、MACバッファーを使用して独自のEAまたはスキャナーを構築する方法を確認してください。 https://www.mql5.com/en/blogs/post/734293 MACの使い方 トレンドの方向性を特定するのに役立つフィルターとしてMACクラウドを使用します。 通常の取引ツールを使用してMACクラウドの方向に取引し、誤ったシグナルを可能な限り排除します。 提案されたエントリ矢印を使用して、開始する強力なトレンドポイントを見つ
                              Bermaui Bands
                              Muhammad Elbermawi
                              4.94 (89)
                              Bermaui Bands(BB)は、レンジとトレンドの価格変動をフィルタリングするのに役立つテクニカル分析ツールです。この指標の背後にある考え方は、次のステップで説明できます。 標準偏差を0〜100の間で移動するオシレーターとして計算します。これをBermaui偏差パーセント(BD%)と名付けます。 「BD%」がゼロに近い場合、ボラティリティは極端になります。さらに、「BD%」が100に近い場合、ボラティリティは非常に低くなります。 ボラティリティが高いということは、トレンド市場の可能性が高いことを意味し、ボラティリティが低いということは、横向きまたはレンジング市場を意味します。 標準偏差はSMAに基づいて計算されるため、中央の線は単純移動平均(SMA)です。 計算で同じバー数の単純移動平均に「BD%」を追加して、アッパーベルマウイバンドを取得します。 計算で同じ数のバーを使用した単純な移動平均から「BD%」を減算して、Lower BermauiBandsを取得します。 重要な情報 Bermaui Bandsユーザーズマニュアル: https://www.mql5.com/en/b
                              Bermaui Manual EA
                              Muhammad Elbermawi
                              5 (10)
                              これは、グリッドシステムを取引する半自動のエキスパートアドバイザーです。アイデアは、市場で徐々にさまざまなポジションを取り、次にそれらの損益分岐点を計算することです。価格がこの損益分岐点を所定の距離だけ通過すると、すべての未決済注文がクローズされます。 重要な情報 ユーザーガイドは次のとおりです。   https://www.mql5.com/en/blogs/post/730567 このEAは、他のどの製品でも試すことができ ます。https://www.mql5.com/en/users/bermaui314/seller 重要な機能 EAには、予期しない結果から取引資本を保護するためのストップロスメカニズムがあります。 EURUSD-XAUUSD-Oil-BitcoinのようなMT4シンボルを取引することができます。 MT4の時間枠をトレードすることができます。 VPSからEAを実行することをお勧めします。 パラメータとデフォルト設定 1)お金の管理設定 ロットを開始します。 レバレッジが1:400以上の場合、デフォルト設定で500ドルごとに0.0
                              または(TDO)は、「純粋な勢い 」の原則を使用して価格変動率を測定する指標です。 証券価格が10から15に上がると、価格の変化率は150%になりますが、15から10に戻ると、価格の変化率は33.3%になります。そのため、「価格変化率」(ROC)や「モメンタム」などのテクニカル分析指標は、下降するものよりも上昇する価格の動きの方が高い値を示します。 TDOはこの問題を修正して、トレーダーが勢いを正しく読み取るのを支援します。 重要な情報 TDOユーザーズマニュアル: https://www.mql5.com/en/blogs/post/717970 TDO FAQ: https://www.mql5.com/en/blogs/post/722015 TDOビデオライブラリ: https://www.mql5.com/en/blogs/post/722018 TDOエキスパートアドバイザーの例: https://www.mql5.com/en/blogs/post/731141 TDOの機能 TDOは純粋な勢いをパーセントとして計算するため、さまざまな市場のさまざまな
                              または(BD%)は、ポイントではなくパーセントでボラティリティを測定するボラティリティ指数です。 BD%の考え方は、0から100パーセントの間で移動するClassic Standard Deviation(CSD)に応じてインデックスを作成することです。 BD%を使用して、異なる期間または異なる時間枠での同じ証券のボラティリティを比較できます。さらに、BD%を使用して、ポイントではなくパーセントで、さまざまな市場のさまざまな証券間のボラティリティを比較できます。 「BD%」の使い方 BD%が90%未満で、このレベルを上向きに超えた場合、これは価格がさまざまな領域で変動する可能性があることを示しています。 BD%が90%を上回り、その後このレベルを下向きに超え、価格がすでに単純移動平均を上回っている場合、これは新しい上昇トレンドの始まりの兆候です。 BD%がマイナス面に深くなるにつれて、ボラティリティとトレンドの強さが増しています。 BD%が0%の場合、これはボラティリティが最大値にあることを意味します。 BD%が90%を上回り、その後このレベルを下向きに超え、価
                              MASR Bands
                              Muhammad Elbermawi
                              5 (10)
                              または M oving A verage S upportコマンド R esistance バンド 。 MASRバンドインジケーターは、サポートレベルとレジスタンスレベルとして連携する2つのバンドに囲まれた移動平均です。統計的に、MASRバンドには93%の確率で価格キャンドルが含まれています。ステップ単位での計算方法は次のとおりです。 1.最初のステップは、X期間の最高値(HHV)と最低値(LLV)を計算することです。 2. 2番目のステップは、HHVをLLVで割って、それらの間の距離をパーセンテージで取得することです。このステップの結果をMASRフィルターと呼びます。 3. MASRフィルター=合計((HHV / LLV)-1)/バーの数 4.移動平均抵抗のショートカットであるアッパーバンドをMARと呼びます。移動平均サポートのショートカットである低帯域MASと呼びます。バンド間の移動平均は、センターラインと呼ばれます。 5. MAR = MASRセンター+(75%xMASRフィルターxMASRセンター) 6.MASRセンターは移動平均です。
                              または CKC。 この指標は、Chester W. Keltner(1909–1998)によって記述された古典的な10日間の移動平均ルールに応じて機能します。すべてのパラメーターはデフォルトでクラシックバージョンのケルトナーシステムに設定されていますが、ユーザーは必要に応じてパラメーターを変更できます。 重要な情報 CKCマニュアルを読む: https://www.mql5.com/en/blogs/post/736577 CKCエキスパートアドバイザーの例: https://www.mql5.com/en/blogs/post/734150 Keltner ChannelFormulaについて 1.標準価格(=(高+低+終値)/ 3)から単純移動平均として中心線を計算します。 2.同じ期間と中心線の計算方法を使用して、高値と安値の平均差である平均日次範囲(ADR)を計算します。 3.ケルトナー購入ライン=センターライン+ ADR。 4.ケルトナーセルライン=センターライン–ADR。 Keltner10日移動平均ルール ケルトナーの公式は、チャート上に2つの
                              Bermaui Pin Bars
                              Muhammad Elbermawi
                              5 (22)
                              ベルマウイピンバー または(BPB)は、チャート上でピンバーの価格アクションパターンを見つけるインジケーターです。ピンバーは「ピノキオバー」のショートカットです。これは、高い上部または下部の影と、ハンマー、逆ハンマー、ハンギングマン、シューティングスター、ドラゴンフライ同事、墓石同事などの非常に小さなボディを持つ日本のローソク足に代わる古典的なバーパターンです。 。 Bermaui Pin Barsインジケーターは、次のステップで説明できる式に応じてこのパターンを見つけます。 最初に、BPBはろうそくの本体の中心を計算します(= [開く+閉じる] / 2)。 次に、BPBは、体の中心とろうそくの間の距離が低いことを検出します。 最後のステップは、ステップ2の結果をろうそくの範囲で割ることです。 ろうそくの本体の中心がろうそくの高さまたは低さに近すぎる場合、BPBはピンバーパターンを検出し、ユーザーに警告します。 ベルマウイピンバーフォーミュラ : https://www.mql5.com/en/blogs/post/729139 以下を追加して、Bermauiピンバーの機能を強
                              BACD Cloud
                              Muhammad Elbermawi
                              4.57 (7)
                              または、 B ermaui A verage C onvergence D ivergence Cloud は、トレンドの方向を示し、その強さをパーセントで測定するオシレーターです。 BACDクラウドの計算は次のとおりです。 1-2つの指数移動平均を計算します。それらの1つは他よりも高速です。最初の(速い)と2番目の(遅い)と呼びます 2-それらの間の中心を見つけます。ここで、Center MA =(Fast + Slow)/ 2 3-次のようにBACDラインを計算します。BACD= 100 *(高速/中央MA) 4-BACDの指数移動平均であるBACD信号線を計算します。式は次のようになります。BACDSignal= EMA(BACD) 5-チャートからBACDシグナルラインを非表示にします。 6- BACDヒストグラムラインを計算します。これは、BACDラインとその信号ラインの差です。 (注:BACDヒストグラムは、ヒストグラムではなく線としてチャートに描画されます。) 7-(BACD Line> BACD Histogram Line)の場合、
                              Bermaui Channel
                              Muhammad Elbermawi
                              5 (27)
                              This is a price channel that shows five important price levels on the chart. Those levels are: 1. The Highest High (HH) of the previous x bars. 2. The Highest Low (HL) of the previous x bars. 3. The Center Line. 4. The Lowest High (LH) of the previous x bars. 5. The Lowest Low (LL) of the previous x bars. How does Bermaui Channels Captures Overbought  area Think of the distance between HH and HL levels as an overbought area. When the price candles or bars crosses the HL to the upside this
                              この指標のアイデアは、RSIをろうそくの形で描画し、それを価格チャートと比較して売買シグナルを生成することです。指標は私の発明ではありません。私は数年前にインターネット上でそれを設立しました。コードを更新し、アラート機能を追加し、BermauiUtilitiesグループのツールを追加しました。 インディケータはローソク足を引くために使用されるすべての価格のRSIを計算します(始値、高値、安値、終値のRSI)。それらの最も高いものを使用してRSIキャンドルの高い芯を描画し、最も低いものを使用してRSIキャンドルの低い芯を描画します。 RSIキャンドルのボディは高値と安値の間にあります。オープンのRSIがクローズのRSIよりも低い場合、RSIキャンドルは強気と見なされます。オープンのRSIがクローズのRSIよりも高い場合、RSIキャンドルは弱気と見なされます。 どうやって使うのですか RSIキャンドルインジケーターでトレンドラインブレイクアウトをトレードすることができます。これは、勢いが価格をリードするため、価格チャートのトレンドをリードします。 RSIキャンドルインジケーターに任意
                              Horus EA
                              Muhammad Elbermawi
                              3.67 (3)
                              MT4用のHorusEA 数千年前、古代エジプト人は、自分たちの土地を測定し、商品を計量するために使用するカウントシステムを発明しました。 このシステムは「ホルスの目 」として知られていました。 ホルスの目はオシリス神の神話と関連付けられており、ファラオの神聖なシンボルの1つになりました。 私は、フィボナッチ数列を使用したEye of Horusの数式を使用して、有名な「マルチンゲールシステム」よりも89%安全なネガティブプログレッションマネー管理システムを構築しました。 EAの技術的な部分は、 移動平均クラウド(MAC) と ストキャスティクスに 依存しています。 MACストキャスティクステクニカル分析システムはどのように機能しますか? 1-移動平均クラウド(MAC)が強気の場合、ストキャスティクスが売られ過ぎのレベルを下から横切ると、EAは買い注文を受け取ります。 2-移動平均クラウド(MAC)が弱気の場合、ストキャスティクスが買われ過ぎのレベルを上から横切ると、EAは売り注文を受け取ります。 EAの重要な機能 1-セットごとに1つの取引。 2-明確なス
                              フィルタ:
                              Hisham Ghoneim
                              296
                              Hisham Ghoneim 2021.09.22 09:39 
                               

                              I already purchase the full set EA + BD% +DBD% as i' satisfied with Elbermawi trading tool and this is not my first time dealing with his great trading tools, it is really helpful for good trading results.

                              Muhammad Elbermawi
                              52233
                              開発者からの返信 Muhammad Elbermawi 2021.09.22 10:32
                              Thanks a lot for the review and stars. I appreciate it . 🙏💚
                              Paulina Andrea Madariaga Figueroa
                              4107
                               

                              Very good indicator, I have spent money in another indicators and with Bermaui tools I have everything.

                              digger55
                              237
                              digger55 2020.01.15 18:08 
                               

                              Good and professional tool.

                              Eng Yoon Lee
                              1294
                              Eng Yoon Lee 2019.12.19 12:23 
                               

                              this is the best indicator. very robust and safe. i LOVE IT

                              aw1977
                              279
                              aw1977 2019.12.11 01:50 
                               

                              Another high quality product from Muhammad....I think there is none similar to this outside. If you never use Muhammad's product before, try this one. There is full function demo which limited to EU/H1.

                              neongreen
                              466
                              neongreen 2019.10.21 14:47 
                               

                              This is my third indicator that I have bought from Muhammad and like his other indicators they are very useful. His support has been fantastic and fast. Two thumbs up!!

                              muna111
                              544
                              muna111 2019.09.17 04:32 
                               

                              Very help ful indicator and a must tool for trading. Thanks a lot Mohammad for such a great indicator .

                              Roberto Cesar Ruarte Pedraza
                              702
                              Roberto Cesar Ruarte Pedraza 2019.08.20 04:45 
                               

                              really good for scalping

                              Evgeniy Vizhevitov
                              219
                              Evgeniy Vizhevitov 2019.08.10 14:44 
                               

                              As an additional filter to Your strategy it is very good!!!

                              Christof Schoneweg
                              124
                              Christof Schoneweg 2019.05.15 19:57 
                               

                              Sehr gute Idee, starker Indikator!

                              Frank Paetsch
                              6872
                              Frank Paetsch 2019.05.14 18:51 
                               

                              Sehr starker Indikator, vielen Dank!

                              keltonactis
                              1052
                              keltonactis 2019.05.13 01:55 
                               

                              Promissing. Good work!

                              IK°L
                              765
                              IK°L 2019.05.04 22:21 
                               

                              This indicator is a very useful tool, the signals are very precise although in periods of low volatility it is necessary to interpret them if you intend to operate exclusively with it. You will also find a lot of value when it is used to confirm a signal to support any operative or system of your own. The author always listens his clients and you can always count with his support.

                              Adil
                              456
                              Adil 2019.04.10 15:48 
                               

                              ユーザーは評価に対して何もコメントを残しませんでした

                              レビューに返信
                              バージョン 4.0 2019.12.08
                              1. Added a Background to the panel at the right corner of the indicator.
                              2. Added a unique prefix/suffix for all objects drawn by the indicator.
                              3. Made a revision for the code to make sure that there is no logical errors.

                              Note:
                              1. I didn't change DBD% calculations. It is the same.
                              2. Parameters are the same.
                              バージョン 3.0 2019.10.15
                              1- The indicator main tapes shape are now as histogram rather than the old version that was in dots. This makes it look better.
                              2- The high is restricted, to make it look like a tape.
                              3- I added "Bermaui Utilities Lite", which is four tools that you will help the user to analyze his chart much better, determine his take profits and stop losses.
                              4- Now you can switch easily between pairs or time-frames.
                              5- You can draw standard deviation channels that show overbought and oversold levels clearly.
                              6- You can draw rounded numbers grid to analyze support and resistance psychological levels.
                              7- You can draw supply and demand levels.
                              8- You can show or hide Bermaui Utilities Buttons by clicking on Shift + A / D.
                              9- You can switch between four beautiful and well-designed Color Lists. Or you can use your own color list by choosing the (Do Nothing) choice.
                              10- You can send Mobile Notification or emails and if anything gets wrong you will receive a note in the terminal's journal.
                              11- Indicator objects now change their size depending on screen resolution.
                              バージョン 2.1 2019.07.20
                              1. Added and Icon to the interface.
                              2. Added a description for the important buffers to the interface.
                              バージョン 2.0 2019.07.18
                              Welcome to Dual Bermaui Deviation Percent version 2.0 (DBD% v2.0)

                              In this version I worked to enhance the built-in function of the indicator by using a moving average as a filter.

                              1// Buy signals will be triggered if Fast BD% is greater than slow BD% and also fast SMA is greater that slow SMA.
                              2// Sell signals will be triggered if Fast BD% is smaller than slow BD% and also fast SMA is smaller that slow SMA.

                              This will reduce the number of false signals to increase the quality.