• 概要
  • レビュー (3)
  • コメント (14)
  • 最新情報

Sensitive Signal

5

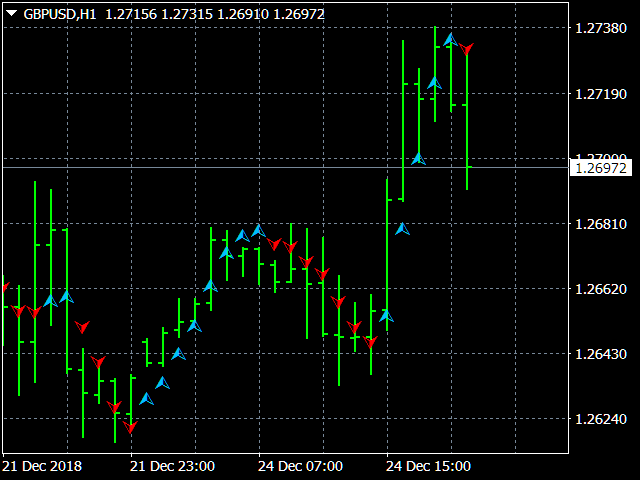
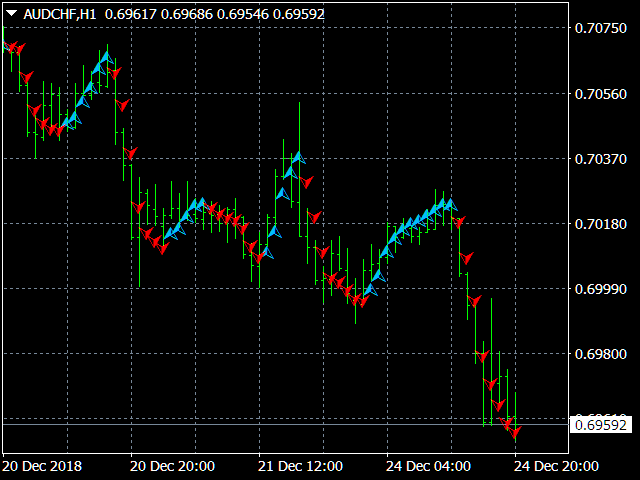
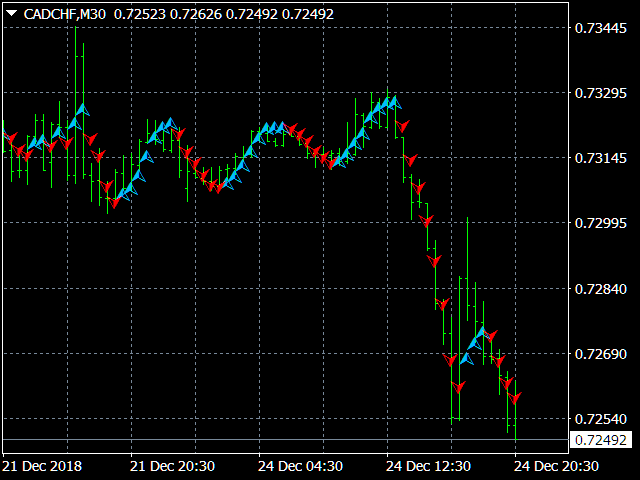
              敏感なシグナル指標はあなたが高い確率で本当の傾向の動きの始まりを設定することを可能にしま。著者によって開発されたフィルタリングは数回の反復で実行され、通常の価格変動の正確な軌跡(より正確にはそのような変動の最も可能性の高い曲線)を明らかにしてそれを描きます。

同時に、通貨ペアの引用符のランダムな動きがフィルタリングされます。

このようなフィルタリングは、信号が常に非常にノイズが多い外国為替市場での取引に非常に効果的です。

           指標の読みは視覚的で非常に単純であり、コメントを必要としません。

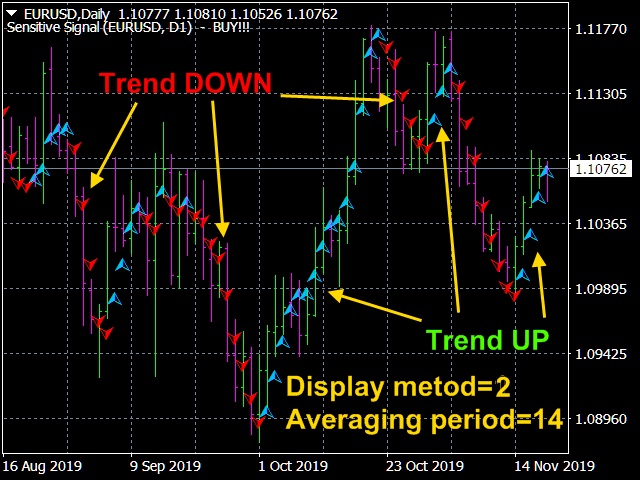
青い三角形は価格変動の通常の要素の上昇トレンドにあり、赤い三角形は下降トレンドにあります。したがって、赤の三角形が青に置き換えられた場合のBuyのエントリポイントと、逆にSell  - のエントリポイント。

インジケーターの感度のレベルは«Select sensitivity level»の設定で調整。

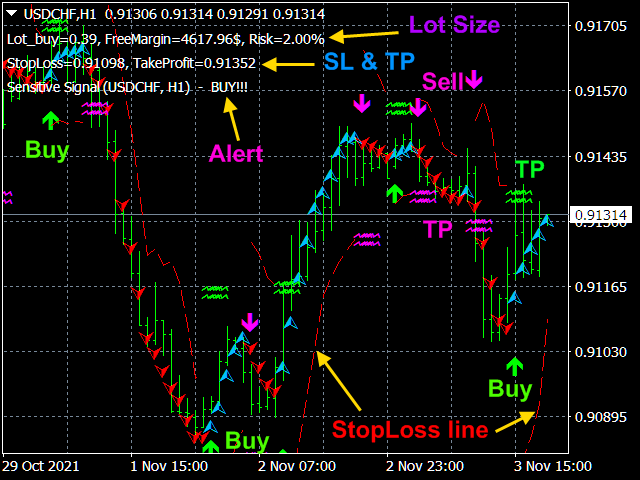
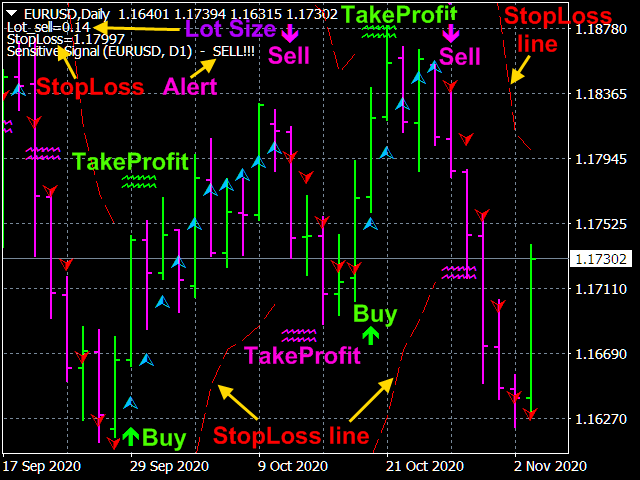
インジケーターは、TakeProfitを、シグナル後の価格が到達する可能性が最も高い値と見なします。

同時に、感度レベルを上げると、信号の遅延が減るだけでなく、誤った信号が発行される可能性も高くなります。

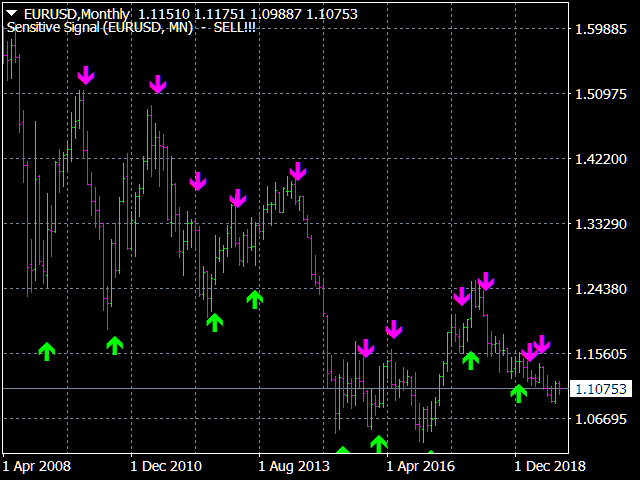
価格の動きの方向が変化する可能性のある瞬間も矢印で示されています。

インジケーターは、ストップロスポジションラインを計算して表示します。ストップロスポジションラインは、現在の価格確率の分布と、トレンドが反転する前にストップロスによる注文を閉じる確率の選択されたレベルに基づいて計算されます。

インジケーターには、マネー管理機能も組み込まれており、許容リスクレベル、預金のサイズ、およびストップロスポジションに基づいてロットサイズを計算できます。


インジケータには、すべての種類のアラートがあります。アラートを有効にするための3つのアルゴリズムが開発されました。アラートをオンにすることができます: 1) 最後の2つのバーでインジケーターの読み取り値が一致するとき(トレンドの方向に関して);  2) 閉じたろうそくの上;  3) 閉じたろうそくとその前のバー.


インジケーター設定 .

  • Price type  -価格の種類: Close price, Open price, High price, Low price, Median price  ((high + low)/2  - デフォルトで), Typical price ((high + low + close)/3),    Weighted  price  ((high + low + 2*close)/4). 
  • The averaging method -平均化方法 : Simple, Exponential (デフォルトで), Smoothed, Linear weighted.
  • The averaging period    -  平均化期間 任意の整数(20 デフォルトで).
  • Select sensitivity level   -  指標の感度のレベル。 : Low, Middle (デフォルトで),  High .
  • Dimensions of markersマーカーのサイズ三角形。値: 任意の整数 (2 デフォルトで).
  • The display method -  情報を表示する方法。  : Show trend arrows and show change trend arrows  (デフォルトで), Show only trend arrows, Show only change trend arrows.
  • Show StopLoss and TakeProfit  linesストップロスラインを表示しますか: true   (デフォルトで), false.
  • Trend UP arrow color= DeepSkyBlue  -  下降トレンドの色。
  • Trend DOWN arrow color=Red  -  上向き矢印の色。
  • Down arrow color=Magenta  -  矢印は下降トレンドの始まりです。
  • Up arrow color =Lime  -   矢印は上昇トレンドの始まりです。
  • Signal Identification Method  -信号識別方法. : By the last two bars 最後の2小節によると» – デフォルトで),  By closed candleクローズドキャンドル»),  By closed candle and by the previous for it bar閉じたキャンドルと前のバー»).
  • The Signal method -  取引シグナルアラートの種類. :  No, Send alert, Print (in expert), Comment (in chart), Sound + Print, Sound + Comment, Sound, Push + Comment, Push,  Mail + Comment, Mail.
  • The probability of triggering StopLoss P_sl –トレンドが反転する前にストップロスで注文を閉じる確率。0から1までの任意の実数 (0.05 デフォルトで).
  •   Calculate the lot size from the risk, deposit and P_sl? リスク、預金、ストップロスによる注文の成約確率に基づいてロットサイズを計算しますか  true, false (デフォルトで).            
  • Allowable losses in % from Free Margin  フリーマージンの%で表した許容損失。 (2% デフォルトで).


        レビュー 3
        Alec Markarian
        329
        Alec Markarian 2019.03.04 22:37 
         

        Great indicator to use for confirmation of bias and/or exits, under correct settings and time frame, can be adjusted very well to precisely fit your strategy, in what ever market it is that you trade.

        Uladzimir Izerski
        14278
        Uladzimir Izerski 2019.01.11 17:45 
         

        Вижу профессионализм над созданием. Очень хорошо.

        おすすめのプロダクト
        The Transition Trend indicator shows the points of potential market reversal. The indicator's smart algorithm detects the trend, filters out market noise and generates entry signals and exit levels. Simple, visual and efficient trend detection. Uses just one parameter for settings. The indicator does not redraw and does not lag. You can set up message alerts as sound or email. Works on all currency pairs and all timeframes. Ready-made trading system.
        ForexGumpUltra is a new and more advanced indicator of the ForexGump series. This indicator easily determines the price direction on any currency pair and any timeframe. The indicator draws its signals on the zero bar and does not redraw them (see the video). In the 34th second of the video it can be seen that this indicator uses new filters to determine the changes in price movement direction without delay, despite the market noise present at the moment (see the video on the 34th second). Once
        What Is a Pivot Point? A pivot point is a technical analysis indicator, or calculations, used to determine the overall trend of the market over different time frames. The pivot point itself is simply the average of the intraday high and low, and the closing price from the previous trading day. On the subsequent day, trading above the pivot point is thought to indicate ongoing bullish sentiment, while trading below the pivot point indicates bearish sentimen How to Use Pivot Points The very e
        I recommend you to read the   product's blog  (manual) from start to end so that it is clear from the beginning what the indicactor offers. This multi time frame and multi symbol divergence dashboard indicator sends an alert when one or two different divergences have been identified. It can be used with all time frames from M1 to MN. It is possible to enable moving average or RSI trend filter to filter out only the strongest setups. Combined with your own rules and techniques, this indicator wi
        This indicator is designed to detect the best of all candlestick reversal patterns: Three Line Strike . According to the bestselling author and candlestick guru Thomas Bullkowski, this pattern has a winning percentage between 65% and 84% . This indicator scans for you up to 30 instruments (forex, indices or commodities) on up to 8 timeframes. You can get alerts via MetaTrader 4 and email if a Three Line Strike pattern occurs. Please note: Higher timeframes bring the most reliable signals. This i
        I recommend you to read the   product's blog  (manual) from start to end so that it is clear from the beginning what the indicactor offers. This multi time frame and multi symbol indicator identifies double or triple top/bottom formations or a following neckline breakout (confirmed top/bottom). It offers filters for RSI overbought/oversold, candle patterns (pin bar, engulfing, tweezer, morning/evening star, three line strike) and divergences (MACD, OsMA, Awesome (AO), RSI, CCI, Stochastic) whic
        A trading range takes place when a financial instrument (stocks, indices, bonds, commodities, Forex currencies or cryptocurrencies) oscillates between two upwards and downwards boundaries for a period of time. This Indicator tool help us to view range on the chart bar per bars, also set range in percent and get clean posicion.  Range trading works best in the absence of a trend. When the markets lack a clear direction, that’s when these consolidation periods settle in. Alternatively, more exper
        Introduction In the fast-paced world of financial market trading, success often hinges on the ability to spot and leverage trends. Among the various strategies available, momentum trading stands out as a powerful tool for traders seeking to capitalize on market movements. In this article, we will delve into the concept of momentum, its significance in trading, and the numerous benefits it offers to traders. What is Momentum? Momentum in trading refers to the tendency of assets to continue movin
        I recommend you to read the   product's blog  (manual) from start to end so that it is clear from the beginning what the indicactor offers. This multi time frame and multi symbol indicator scans for pin bars. Combined with your own rules and techniques, this indicator will allow you to create (or enhance) your own powerful system. Features Can monitor all symbols visible in your Market Watch window at the same time. Apply the indicator to just one chart and instantly monitor the entire market.
        XFibo Auto Fibonacci
        Welinton Dos Reis Goncalves
        Use with disciplined risk management. Fibonacci entry system based on the golden zone 38.2 - 61.8 where the entry is confirmed at 23.6 with indications of Take Profit 3:1. Automatically plotted Fibonacci contains retracement and expansion Fibonacci in a single indicator. Up to 77% win rate with this system. FTMO challenge pass with 0.50% risk and 1.50% R:R.
        My Point MT4
        Claudia Ramona Angerer
        4 (1)
        Diagnosis of major and minor pivot Trend detection with many signals Can be used in all symbols Can be used in all time frames Settings: Back Show: The number of candles it displays If you need any adjustments, or have any questions or suggestions, message me How to trade: Blue: sell signal Red: buy signal Blue and red at the same time: no signal Exit signal: Opposite signal
        ARAH TREND is an indicator to detect the current trend, and predict next trend.  Its very simple way to know trend because   the display so clear. Trend changes are indicated by indicator color change. That's great as an entry point.  The advantages of this indicator : - Beautiful Entry Points - No Need Setting - Suitable for all time frames - Geat for GBPUSD and Gold TF H1 - The display is simple and clear It can also be combined with your mainstay indicator so that the entry point is more acc
        The Sentiment Ratio indicator gauges current Market Sentiment between -100% and 100%, where lower than -40% is considered Bearish and higher than 40% is Bullish. The channel between the two is considered Neutral. The indicator has been a very useful filter tool for signals within a trading system. Example call function:  int SentimentIndicator(double triggerLevel)//Return sentiment if trigger level is activated {   double sentimentRatio=iCustom(NULL,0,"Sentiment Ratio",0,0,0);   if(sentimentRa
        FREE
        After the purchase, the current year free indicator, please contact me for your version As a bonus to the purchase, 3 months access to https://www.mql5.com/en/market/product/78772?source=Unknown%3Ahttps%3A%2F%2Fwww.mql5.com%2Fen%2Fmarket%2Fmy Fibonacci retracement This indicator is based on use of Fibonacci retracement. I use Fibonacci levels for last year for important levels, where market stops and turns. These levels are important Price Action levels and market respect them. I do not us
        Description Better version of RSI indicator which offer a complete visual trading strategy and realize an auto-optimization Support:   We create great tools for the entire trading community. Most of them are free. If you believe in what we do  Support Us Here.   KEY LINKS:   How to Install  –  Frequent Questions  -  All Products  How is this indicator useful? NEVER repaints. Detect best parameters of RSI indicator, based on profit factor during the specified period. This indicator can be used as
        Contact me after payment to send you the user manual PDF file. Introduction The moving average indicator is the most well-known and one of the most popular indicators among traders. It is very simple to work with, but a basic question has always become a big challenge among traders: What is the most optimal setting of the moving average for each chart-time frame? The answer to this question is very difficult, you have to try different settings of the moving average indicator for different chart
        外国為替トレーダーは、テクニカル分析における フィボナッチ 取引戦略の価値を理解しています。ただし、フィボナッチ レベルを手動で描画および調整するには時間がかかる場合があります。そこで、   Fibonacci Of Yesterday Ultimate インジケーターが登場します。これは、前日の価格変動に基づいてフィボナッチ戦略を使用するトレーダー向けに特別に設計されており、時間と労力を節約します。 この革新的なインジケーターは、フィボナッチレベルに基づいてエントリー、ストップロス、テイクプロフィットのレベルを自動的に識別します。また、好みに合わせて簡単にカスタマイズできる、使いやすいフィボナッチ ツールも含まれています。特徴的なのは、チャート上の実際のトレンド チャネルを識別する機能で、反転、リトレースメント、トレンドの機会を簡単に見つけることができます。 Fibonacci Of Yesterday Ultimate インジケーターの使用は簡単です。主要なニュースリリースを待ち、トレンドを判断し、それに応じてフィボナッチレベルを描画します。 50% と 38.2% のレベルの間で
        About Holy Trend was developed to identify trend and strength. VIDEO (information and tips) [HERE] Features Identifies trend Identifies strength of trend Identifies lines of support and resistance Easy to analyze Fast signals All timeframes Not repaint (when candle close) No settings required Can be used in Renko charts Can be used with indicator Holy Renko PRO Alerts, email and push notifications Advantages Sensitive identifier of trend able to identify the long, short movements and
        The correlation coefficient reflects the relationship between two values. It shows the dependence of changes in one value on changes in another. For example, from changes in the price of EURUSD and EURNZD. The correlation coefficient in trade, currency relations is constantly changing. Special indicators of correlation help to define it, trace changes, draw correct conclusions. One of them is the Hubbles Correlator indicator. The indicator allows you to simultaneously display several other char
        The indicator is designed for determining Fibonacci levels. Does not repaint/redraw The blue level shows the zero Fibonacci value (it is also the Pivot level) Red levels show calculated Fibonacci levels (used as a rollback or reversal point) Automatic period detection (periods can be entered manually) Adjustable display calculation method. Settings BarsHistory - the number of bars to be used to display the indicator. Method - method of calculation. AutoPeriod - automated period calculation (true
        I  recommend you to read the   product's blog  (manual) from start to end so that it is clear from the beginning what the indicator offers. This multi time frame and multi symbol indicator scans for engulfing and tweezer formations. The indicator can also be used in single chart mode. Combined with your own rules and techniques, this indicator will allow you to create (or enhance) your own powerful system. Features Can monitor all symbols visible in your Market Watch window at the same time. Ap
        PowerXXX
        Marco Fornero Monia
        PowerXXX measures the power of the current candlestick and displays it in numerical format and colors. The indicator can cover multiple timeframes and can be placed on the main chart or on the charts of the underlying indicators. The number of timeframes is selectable, as well as the color levels according to the power expressed. In the latest version, the power can be expressed as a function of the opening of the candle itself or as a function of the opening of the total candles before. There
        The Effect indicator shows the points of potential market reversal. Simple, visual and efficient trend detection. Ready-made trading system. The intelligent algorithm of the indicator determines the trend with good probability. Uses just one parameter for settings. The indicator does not redraw and does not lag. Works on all currency pairs and all timeframes. You should remember that using a combination of forecasting tools, it is advisable to choose 2-3 indicators for trading. Otherwise, the
        TrendSurfer OsMa
        Augustine Kamatu
        2 (1)
        Introducing TrendSurfer OsMa: Elevating Your Forex Trading Experience. TrendSurfer OsMa is a cutting-edge automated trading system meticulously crafted to harness the power of the MetaTrader 4 indicator, Moving Average of Oscillator (OsMa), revolutionizing your approach to forex trading. The Moving Average of Oscillator (OsMa) is a derivative of the MACD (Moving Average Convergence Divergence) indicator. It represents the difference between the MACD line and its signal line. The OsMa provid
        This indicator guides you like a hunter. Tacheprofit and StopLoss levels. See the difference in the experiment. Works in all periods. Works at all rates. You can win with this system. The crossing of the mean and the re-test were done according to the rule. You can see the transactions by moving backwards on the strategy test screen. The whole system is automatically calculated.
        Fibonacci automatically draws Fibonacci retracement, Because Fibonacci automatically draws Fibonacci retracement, you can know at a glance the price to buy at a push or sell back. Therefore, you can trade in favorable conditions in a trending market. The "PowerMap" is a bundle of four items ("DrawTurningPoint", "DrawHurdle", "DrawChartPattern", "DrawFibonacci").  Please be careful not to purchase more than one copy (duplicates). We are live-streaming the actual operation of the system. Plea
        Multi-timeframe Parabolic SAR dashboard allows you to add and monitor PSAR trends. The multi-timeframe Parabolic SAR dashboard will save you a lot of time and gives you a single view of the markets using PSAR. In short, you can just view one window and get a snapshot of up to 21 instruments on your MT4 platform. The indicator opens in a sub-window. Below are the features of the PSAR Dashboard Indicator Modify PSAR Settings: The PSAR Dashboard comes with default PSAR settings of 0.02 (Step) and 0
        MT5 Version Kill Zones Kill Zones allows you to insert up to 3 time zones in the chart. The visual representation of the Kill Zones in the chart together with an alert and notification system helps you to ignore fake trading setups occurring outside the Kill Zones or specific trading sessions. Using Kill Zones in your trading will help you filter higher probability trading setups. You should select time ranges where the market usually reacts with high volatility. Based on EST time zone, followi
        It could help to calculate Risk-Reward easily before placing a BUY-SELL position. TradeSizeCalculator is a Multi-Tasking Calculator. It will calculate the others when we define the value in one of the columns. Stoploss, risk percentage, risk-money, lot size, take-profit , reward-money, and reward-ratio. Depending on which value is changed. All values in the columns are editable. Also, we can get those calculation results by drag-drop the stop-loss/take-profit line. Parameter: The inputs below ar
        I  recommend you to read the   product's blog  (manual) from start to end so that it is clear from the beginning what the indicator offers. This multi time frame and multi symbol indicator identifies double top/bottom, head & shoulders, pennant/triangle and flag patterns. It is also possible to setup alerts only when a neckline/triangle/flagpole breakout has occured (neckline breakout = confirmed signal for top/bottoms and head & shoulders).  The indicator can also be used in single chart mode.
        このプロダクトを購入した人は以下も購入しています
        Gann Made Easy は、ミスター・ギャンの理論を使用した取引の最良の原則に基づいた、プロフェッショナルで使いやすい外国為替取引システムです。 W・D・ガン。このインジケーターは、ストップロスとテイクプロフィットレベルを含む正確な買いと売りのシグナルを提供します。 PUSH通知を利用して外出先でも取引可能です。 購入後はご連絡ください!私の取引のヒントと素晴らしいボーナスインジケーターを無料で共有します! おそらく、ギャンの取引手法についてはすでに何度も聞いたことがあるでしょう。通常、ギャンの理論は初心者のトレーダーだけでなく、すでにある程度の取引経験がある人にとっても非常に複雑なものです。なぜなら、ギャンの取引手法は理論的にはそれほど簡単に適用できるものではないからです。私はその知識を磨き、最良の原則を私の外国為替インジケーターに組み込むために数年を費やしました。 このインジケーターは非常に簡単に適用できます。必要なのは、それをチャートに添付し、簡単な取引推奨事項に従うだけです。このインジケーターは常に市場分析の仕事を行い、取引の機会を探します。適切なエントリーポイントを検出
        驚異的なFXインジケーター「Miraculous」をご紹介します。完璧な結果を得るための1時間足を含むすべてのタイムフレームで効果的に機能する、最強の強力な特殊MT4フォレックスインジケーターです。 すべてのタイムフレームで優れた結果を提供する最高のFXインジケーターを探し続けるのに疲れましたか?これ以上探す必要はありません!「Miraculous」フォレックスインジケーターをご紹介します。このインジケーターは、トレーディングの経験を変革し、収益を新たなレベルに引き上げるために設計されました。 先進のテクノロジーと長年にわたる緻密な開発に基づいて構築された「Miraculous」フォレックスインジケーターは、FX市場における力と正確さの頂点となります。この素晴らしいツールは、すべてのレベルのトレーダーのニーズを満たすように設計されており、一貫した収益性を追求する上で比類のない優位性を提供します。 「Miraculous」フォレックスインジケーターの他との違いは、その非常に適応性にあります。デイトレーダー、スウィングトレーダーであろうと、長期ポジションを好む方であろうと、このインジケータ
        現在20%OFF! 初心者やエキスパートトレーダーのためのベストソリューション! このダッシュボードソフトウェアは、28の通貨ペアで動作しています。それは私達の主要な指標(高度な通貨の強さ28と高度な通貨インパルス)の2に基づいています。それは全体の外国為替市場の大きい概観を与えます。それは、すべての(9)時間枠で28の外国為替ペアのための高度な通貨の強さの値、通貨の動きの速度と信号を示しています。チャート上で1つのインディケータを使用して市場全体を観察し、トレンドやスキャルピングの機会をピンポイントで見つけることができたら、あなたのトレードがどのように改善されるか想像してみてください。 このインディケータには、強い通貨と弱い通貨の識別、潜在的な取引の識別と確認がより簡単になるような機能が搭載されています。このインディケータは、通貨の強さや弱さが増加しているか減少しているか、また、すべての時間枠でどのように機能しているかをグラフィカルに表示します。 新機能として、現在の市場環境の変化に適応するダイナミックなマーケットフィボナッチレベルが追加され、すでに当社のAdvan
        まず第一に、この取引インジケーターは再描画されず、再描画されず、遅延しないことを強調する価値があります。これにより、手動取引とロボット取引の両方に理想的なものになります。 アトミックアナリストは、価格の強さとモメンタムを利用して市場でより良いエッジを見つけるためのPA価格アクションインジケーターです。ノイズや誤ったシグナルを除去し、取引ポテンシャルを高めるための高度なフィルターを備えています。複雑なインジケーターの複数のレイヤーを使用して、アトミックアナリストはチャートをスキャンし、複雑な数学的計算をシンプルなシグナルと色に変換します。これにより、どのような初心者トレーダーでも理解して使用し、一貫した取引の決定を行うことができます。 「アトミックアナリスト」は、新規および経験豊富なトレーダー向けにカスタマイズされた包括的な取引ソリューションです。プレミアムインジケーターとトップノッチの機能を1つの取引戦略に組み合わせ、すべてのタイプのトレーダーにとって汎用性のある選択肢にします。 デイリートレーディングとスキャルピング戦略:高速で正確なデイトレーディングおよび短期トレード
        現在26%オフ 初心者やエキスパートトレーダーに最適なソリューション! このインジケーターは、独自の機能と新しい計算式を取り入れた、ユニークで高品質、かつ手頃な価格のトレーディングツールです。たった1枚のチャートで28の為替ペアの通貨強度を読み取ることができます。新しいトレンドやスキャルピングチャンスの引き金となるポイントを正確に特定することができるので、あなたのトレードがどのように改善されるか想像してみてください。 ユーザーマニュアルはこちら  https://www.mql5.com/en/blogs/post/697384 これが最初の1本、オリジナルだ! 価値のないクローンを買わないでください。 特別な サブウィンドウの矢印で強い通貨の勢いを表示 GAPがあなたのトレードを導く! 基準通貨や気配値が売られすぎ・買われすぎのゾーン(外相フィボナッチレベル)にあるとき、個別チャートのメインウィンドウに警告表示。 通貨がレンジの外側から反落した場合、プルバック/リバーサルのアラート。 クロスパターンの特別なアラート 複数の時間枠を選択可能で、トレンドを素早く
        TPSpro TRENDPRO  - is a trend indicator that automatically analyzes the market and provides information about the trend and each of its changes, as well as giving signals for entering trades without redrawing! The indicator uses each candle, analyzing them separately. referring to different impulses - up or down impulse. Exact entry points into transactions for currencies, crypto, metals, stocks, indices!  -  Version MT5               DETAILED DESCRIPTION        /       TRADING SETUPS           
        A key element in trading is zones or levels from which decisions to buy or sell a trading instrument are made. Despite attempts by major players to conceal their presence in the market, they inevitably leave traces. Our task was to learn how to identify these traces and interpret them correctly. Reversal First Impulse levels (RFI)   -  Version MT5                INSTRUCTIONS                 RUS                 ENG                                       R ecommended to use with an indicator   -  
        ご紹介   クォンタム トレンド スナイパー インジケーターは 、トレンド反転を特定して取引する方法を変革する画期的な MQL5 インジケーターです。 13年以上の取引経験を持つ経験豊富なトレーダーのチームによって開発されました。     クォンタムトレンドスナイパーインジケーター   は、非常に高い精度でトレンドの反転を識別する革新的な方法で、あなたのトレーディングの旅を新たな高みに押し上げるように設計されています。 ***Quantum Trend Sniper Indicatorを購入すると、Quantum Breakout Indicatorを無料で入手できます!*** クォンタム ブレイクアウト インジケーターは、トレンドの反転を特定するとアラートを発し、矢印を示し、3 つのテイクプロフィットレベルを提案します。 初心者トレーダーにもプロのトレーダーにも適しています。 量子EAチャネル:       ここをクリック MT5のバージョン:       ここをクリック 推奨事項: 期間: すべての時間枠。最良の結果を得るには、
        An exclusive indicator that utilizes an innovative algorithm to swiftly and accurately determine the market trend. The indicator automatically calculates opening, closing, and profit levels, providing detailed trading statistics. With these features, you can choose the most appropriate trading instrument for the current market conditions. Additionally, you can easily integrate your own arrow indicators into Scalper Inside Pro to quickly evaluate their statistics and profitability. Scalper Inside
        TrendMaestro
        Stefano Frisetti
        5 (2)
        note: this indicator is for METATRADER4, if you want the version for METATRADER5 this is the link: TRENDMAESTRO recognizes a new TREND in the bud, he never makes mistakes. The certainty of identifying a new TREND is priceless. DESCRIPTION TRENDMAESTRO identifies a new TREND in the bud, this indicator examines the volatility, volumes and momentum to identify the moment in which there is an explosion of one or more of these data and therefore the moment in which prices have strong probability of f
        ご紹介     Quantum Breakout PRO は 、ブレイクアウト ゾーンの取引方法を変革する画期的な MQL5 インジケーターです。 13年以上の取引経験を持つ経験豊富なトレーダーのチームによって開発された Quantum Breakout PROは 、革新的でダイナミックなブレイクアウトゾーン戦略により、あなたの取引の旅を新たな高みに押し上げるように設計されています。 クォンタム ブレイクアウト インジケーターは、5 つの利益ターゲット ゾーンを備えたブレイクアウト ゾーン上のシグナル矢印と、ブレイクアウト ボックスに基づいたストップロスの提案を提供します。 初心者トレーダーにもプロのトレーダーにも適しています。 量子EAチャネル:       ここをクリック MT5バージョン:   ここをクリック 重要!購入後、インストールマニュアルを受け取るためにプライベートメッセージを送ってください。 推奨事項: 時間枠: M15 通貨ペア: GBPJPY、EURJPY、USDJPY、NZDUSD、XAUUSD アカウントの種類: ECN、Raw、また
        まず第一に、この取引ツールはノンリペイント、ノンリドロー、ノンラグの指標であり、プロの取引に理想的ですことを強調する価値があります。 スマートプライスアクションコンセプトインジケーターは、新米から経験豊富なトレーダーまで、非常 に強力なツールです。Inner Circle Trader AnalysisやSmart Money Concepts Trading Strategiesなど、20以上の有用な指標を1つに組み合わせています。このインジケーターはスマートマネーコンセプトに焦点を当て、大手機関の取引方法を提供し、彼らの動きを予測するのに役立ちます。 特に、流動性分析に優れており、機関がどのように取引しているかを理解しやすくしています。市場のトレンドを予測し、価格の動きを慎重に分析するのに優れています。機関の戦略とトレードを合わせることで、市場の動向についてより正確な予測ができます。このインジケーターは多目的であり、市場構造を分析し、重要な注文ブロックを特定し、さまざまなパターンを認識するのに優れています。 このインジケーターはBOSやCHoCHなどのパターンの識
        Advanced Supply Demand
        Bernhard Schweigert
        4.92 (310)
        現在33%オフ 初心者にもエキスパートトレーダーにも最適なソリューション このインジケーターは独自の機能と新しい公式を多数内蔵しており、ユニークで高品質かつ手頃な取引ツールです。このアップデートでは、2つの時間枠ゾーンを表示できるようになります。より長いTFだけでなく、チャートTFとより長いTF(ネストゾーンを表示)の両方を表示できます。すべてのSupply Demandトレーダーの皆さんのお気に召すはずです。:) 重要情報の公開 Advanced Supply Demandの可能性を最大化するには、 https://www.mql5.com/ja/blogs/post/720245 にアクセスしてください。   エントリーまたはターゲットの正確なトリガーポイントを正確に特定できれば取引がどのように改善されるか想像してみてください。新しい基盤となるアルゴリズムに基づいて構築されているため、買い手と売り手の間の潜在的な不均衡をさらに簡単に特定できます。これは、最も強い需要と供給のゾーンと、過去のパフォーマンス(古いゾーンを表示)がグラフィカルに表現されるためです。これらの機能は、最適
        Trend Screener
        STE S.S.COMPANY
        4.83 (86)
        トレンドインジケーター、1つのツールに組み込まれたすべての重要なトレンド機能を備えたトレンドトレーディングとフィルタリングのための画期的なユニークなソリューション! これは、すべてのシンボル/商品(外国為替、商品、暗号通貨、インデックス、株式)で使用できる100%再描画されていないマルチタイムフレームおよびマルチ通貨インジケーターです。 トレンドスクリーナーは、チャート内のドットで矢印トレンドシグナルを提供するインジケーターに続く効率的なインジケーターです。 トレンド分析インジケーターで使用できる機能: 1.トレンドスキャナー。 2.最大利益分析を備えたトレンドライン。 3.トレンド通貨強度メーター。 4.アラート付きのトレンド反転ドット。 5.アラート付きの強いトレンドドット。 6.トレンド矢印 毎日の分析例、毎日のシグナルパフォーマンス...など、トレンドスクリーナーインジケーターを使用して、ここで見つけることができます: ここをクリックしてください 期間限定オファー:トレンドスクリーナーインジケーターは、50ドルと生涯でのみご利用いただけます。 (元の価格125 $) MQ
        通貨強さウィザードは、取引を成功させるためのオールインワン ソリューションを提供する非常に強力な指標です。このインジケーターは、複数の時間枠のすべての通貨のデータを使用して、このまたはその外国為替ペアのパワーを計算します。このデータは、使いやすい通貨インデックスと通貨パワーラインの形式で表され、特定の通貨のパワーを確認するために使用できます。 必要なのは、取引したいチャートにインジケーターを接続することだけです。インジケーターは、取引する通貨の実際の強さを示します。このインジケーターは、トレンドに合わせて取引するときに有利に利用できる売買高の圧力の極値も示します。このインジケーターには、フィボナッチに基づく可能なターゲットも表示されます。 このインジケーターは、PUSH 通知を含むあらゆるタイプのアラートを提供します。 購入後ご連絡下さい。私の取引のヒントをあなたと共有し、素晴らしいボーナスインジケーターを無料で提供します! 幸せで有益な取引をお祈りします。
        mql5と Telegramの モーニング・ブリーフィングで、詳細とスクリーンショットを含む毎日のマーケット・アップデートをご覧 ください! FX Power MT4 NGは 、長年の人気を誇る通貨強度計FX Powerの次世代モデルです。 この次世代ストレングスメーターは何を提供するのでしょうか?初代FXパワーの魅力すべて プラス GOLD/XAUの強さ分析 より正確な計算結果 個別に設定可能な分析期間 カスタマイズ可能な計算上限値により、さらに優れたパフォーマンスを実現 もっと見たい人のための特別なマルチインスタンス設定 すべてのチャートでお好みの色を無限に設定可能 数え切れないほどの通知オプションにより、重要なことを見逃すことはありません。 Windows 11とmacOSのスタイルで角を丸くした新しいデザイン 魔法のように動くインジケーターパネル FXパワーの主な機能 すべての主要通貨の強さの完全な履歴 すべての時間枠における通貨の強さの履歴 すべてのブローカーとチャートで同一の計算結果 100%信頼できるリアルタイム計算 -> リペイントなし ドロップダウン・リストから
        カスタムMT4インジケーターで外国為替取引を成功させるための秘密を発見してください! 外国為替市場で成功を達成し、リスクを最小限に抑えながら一貫して利益を得る方法を疑問に思ったことはありますか? これがあなたが探している答えです! 取引へのアプローチに革命をもたらす独自のMT4インジケーターを導入できるようにします。 ユニークな汎用性 私たちのインジケータは、RenkoとRangeBarのろうそくのフォーメーションを好むユーザー向けに特別に設計されています。 これらのチャートタイプは多くの経験豊富なトレーダーに好まれていることを理解しています。そのため、私たちのインジケーターはそれらとシームレスに統合され、比類のない市場分析を提供します。 クリアトレンドシグナル 複雑な分析を忘れてください! 私たちのインジケーターは、鮮やかな色と明確なドット構造を利用して、市場の動向を明確に示しています。 赤と青の点は、価格の動きの方向性について疑いの余地がなく、取引の迅速な意思決定を可能にします。 HH/HL HL/LL戦略とのアライメント HH/HLおよびHL/LL構
        現在31%オフ! 初心者やエキスパートトレーダーに最適なソリューション! このインジケータは、独自の機能と秘密の数式を組み込んだ、ユニークで高品質かつ手頃な価格のトレーディングツールです。たった1枚のチャートで28の通貨ペアのアラートを表示します。新しいトレンドやスキャルピングチャンスの引き金となるポイントを正確に把握することができるので、あなたのトレードがどのように改善されるか想像してみてください! 新しい基本的なアルゴリズムに基づいて構築されているため、潜在的な取引の特定と確認がより簡単になります。これは、通貨の強さや弱さが加速しているかどうかをグラフィカルに表示し、その加速のスピードを測定するためです。加速すると物事は明らかに速く進みますが、これはFX市場でも同じです。つまり、反対方向に加速している通貨をペアにすれば、利益を生む可能性のある取引を特定することができるのです。 通貨の勢いを示す縦の線と矢印は、あなたの取引の指針となるでしょう。 ダイナミックマーケットフィボナッチ23レベルはアラートトリガーとして使用され、市場の動きに適応します。もしインパルスが黄色
        の紹介     Quantum平均足PRO チャート 市場のトレンドに対する明確な洞察を提供するように設計された平均足キャンドルは、ノイズを除去し、誤ったシグナルを排除する能力で知られています。混乱を招く価格変動に別れを告げ、よりスムーズで信頼性の高いチャート表現を導入しましょう。 Quantum Heiken Ashi PRO を真にユニークなものにしているのは、従来のローソク足データを読みやすい色のバーに変換する革新的なフォーミュラです。赤と緑のバーはそれぞれ弱気トレンドと強気トレンドをエレガントに強調し、潜在的なエントリーポイントとエグジットポイントを驚くほど正確に見つけることができます。 量子EAチャネル:       ここをクリック MT5のバージョン:       ここをクリック この注目すべき指標には、いくつかの重要な利点があります。 明確性の向上: 価格変動を平滑化することで、平均足バーは市場トレンドをより明確に表現し、有利な取引機会を特定しやすくします。 ノイズの削減: 誤ったシグナルを引き起こすことが多い不安定な価格変動に別れを告げます。 Quan
        ON Trade Waves Patterns Harmonic Elliot Wolfeをご紹介します。これは手動および自動の方法を使用して市場のさまざまなパターンを検出するために設計された高度なインジケーターです。以下はその動作方法です: ハーモニックパターン: このインジケーターは、チャートに表示されるハーモニックパターンを識別できます。これらのパターンは、Scott Carneyの「Harmonic Trading vol 1および2」で説明されているように、ハーモニックトレーディング理論を実践するトレーダーにとって重要です。手動で描画するか、自動検出に頼るかにかかわらず、ON Trade Waves Patternsがお手伝いします。 コントロールパネル: このインジケーターはユーザーフレンドリーなコントロールパネルを備えています。チャートと時間枠の設定を保存し、異なる構成間をスムーズに切り替えることができます。チャートスペースを最大限に活用するために最小化することもできます。他の分析ツールで作業することを好む場合、閉じるボタンをクリックするだけで、すべてのインジケーターデ
        PRO Renko Systemは、特別にRENKOチャートを取引するために設計された高精度の取引システムです。 これは、様々な取引商品に適用することができる普遍的なシステムです。 システムは効果的に正確な逆転信号へのアクセスを与えるいわゆる市場の騒音を中和する。 表示器は非常に使いやすく、信号の生成に責任がある1つの変数だけがあります。 あなたは簡単にお好みの任意の取引ツールとレンコバーのサイズにツールを適応させることができます。 私はいつもあなたが私のソフトウェアで収益性の高い取引を支援するために余分なサポートを提供する準備ができています! 私はあなたに幸せで収益性の高い取引をしたいです! ご購入後にご連絡ください! 私はあなたに私のレンコチャートジェネレータを送信します。 私はまた、私の個人的な推奨事項やシステムの他のモジュールを無料で共有します!
        Scalper Vault は、スキャルピングを成功させるために必要なすべてを提供するプロフェッショナルなスキャルピング システムです。このインジケーターは、外国為替およびバイナリー オプションのトレーダーが使用できる完全な取引システムです。推奨される時間枠は M5 です。 システムは、トレンドの方向に正確な矢印シグナルを提供します。また、トップとボトムのシグナルとギャン マーケット レベルも提供します。 インジケーターは、プッシュ通知を含むすべてのタイプのアラートを提供します。 インジケータの購入後にご連絡ください。私の個人的な取引の推奨事項と素晴らしいボーナス指標を無料で共有します! 幸せで有益な取引をお祈りします!
        AW Trend Predictor
        AW Trading Software Limited
        4.74 (39)
        1 つのシステムでのトレンド レベルとブレイクダウン レベルの組み合わせ。高度なインジケーター アルゴリズムは、市場のノイズをフィルター処理し、トレンド、エントリー ポイント、および可能なエグジット レベルを決定します。インジケーターシグナルは統計モジュールに記録されるため、最適なツールを選択してシグナル履歴の有効性を示すことができます。この指標は、テイクプロフィットとストップロスのマークを計算します。 マニュアル・説明書→   こちら / MT5版→   こちら インジケーターで取引する方法: Trend Predictor での取引は、たった 3 つの簡単なステップです。 ステップ 1 - ポジションを開く 70% 以上の成功率で買いシグナルが受信されました ステップ 2 - ストップロスの決定 逆信号でトランクを選択 ステップ 3 - テイクプロフィット戦略の定義 戦略 1: TP1 に到達したらポジション全体をクローズする 戦略 2: TP1 に達した時点でポジションの 50% をクローズし、TP2 に達した時点で残りの 50% をクローズします。 戦略 3: トレンドの反転で
        このインディケータは、当社の2つの製品 Advanced Currency IMPULSE with ALERT  +   Currency Strength Exotics . のスーパーコンビネーションです。 このインジケーターは全ての時間枠で作動し、8つの主要通貨と1つのシンボルの強弱のインパルスをグラフで表示します。 このインジケータは、金、エキゾチックペア、商品、インデックス、先物など、あらゆるシンボルの通貨強度の加速度を表示することに特化されています。金、銀、原油、DAX、US30、MXN、TRY、CNHなどの通貨強度の加速度(インパルスまたは速度)を表示するために、任意のシンボルを9行目に追加できる、この種の最初のものです。 新しいアルゴリズムに基づいて構築され、潜在的な取引の特定と確認がさらに容易になりました。これは、通貨の強さや弱さが加速しているかどうかをグラフィカルに表示し、その加速の速度を測定するためです。加速すると物事は明らかに速く進みますが、これはFX市場でも同じです。つまり、反対方向に加速している通貨をペアリングすれば、潜在的に利益を生む取
        サポートとレジスタンススクリーナーは、1つのインジケーター内に複数のツールを提供するMetaTraderの1つのレベルインジケーターにあります。 利用可能なツールは次のとおりです。 1.市場構造スクリーナー。 2.強気のプルバックゾーン。 3.弱気プルバックゾーン。 4.デイリーピボットポイント 5.毎週のピボットポイント 6.毎月のピボットポイント 7.ハーモニックパターンとボリュームに基づく強力なサポートとレジスタンス。 8.銀行レベルのゾーン。 期間限定オファー:HVサポートおよびレジスタンスインジケーターは、50ドルと生涯でのみご利用いただけます。 (元の価格125 $) Metatrader Backtesterの制限なしでインジケーターを試してみませんか? デモ版をダウンロードするには、ここをクリックしてください。 主な機能     ハーモニックおよびボリュームアルゴリズムに基づく強力なサポートおよびレジスタンスゾーン。     ハーモニックおよびボリュームアルゴリズムに基づく強気および弱気のプルバックゾーン。     市場構造スクリーナー     毎日
        IX Powerは 、FX Powerの無敵の精度をついにFX以外のシンボルにも提供します。 お気に入りの指数、株式、コモディティ、ETF、さらには暗号通貨の短期、中期、長期のトレンドの強さを正確に判断します。 お使いの端末が提供する すべてを分析する ことができます。ぜひお試しいただき、取引 タイミングが大幅に改善 されることをご体験ください。 IXパワーの主な特徴 100%正確で再描画されない計算結果 - ターミナルで利用可能なすべての取引シンボルに対して 予め設定され、さらに個別に設定可能な強度分析期間のドロップダウン選択 Eメール、メッセージ、モバイル通知による無数の通知オプション EAリクエストのためのアクセス可能なバッファ カスタマイズ可能な計算制限により、さらに優れたパフォーマンスを実現 もっと見たい人のための特別なマルチインスタンス設定 すべてのチャートでお好みの色を無限に設定可能 Windows 11とmacOSのスタイルで角を丸くした新しいパネルデザイン サブ・ウィンドウとメイン・チャートの間をシームレスに移動する、魔法のように動く
        FX Volume
        Daniel Stein
        4.6 (35)
        mql5と Telegramの モーニング・ブリーフィングで、詳細とスクリーンショットを含む毎日のマーケット・アップデートをご覧 ください! FX Volumeは、ブローカーの視点から市場のセンチメントをリアルに洞察する、最初で唯一の出来高インジケーターです。 ブローカーのような機関投資家が外国為替市場でどのようなポジションをとっているか、COTレポートよりもはるかに速く、素晴らしい洞察を提供します。 この情報をチャート上で直接見ることは、あなたの取引にとって真のゲームチェンジャーであり、画期的なソリューションです。 以下のようなユニークなマーケットデータ洞察から利益を得てください。 比率は 、通貨のロングポジションとショートポジションの比率をパーセントで表示します。 比率の変化は 、選択した期間内のロング比率とその変化率を表示します。 Volumes Totalは 、通貨の取引量(ロングとショート)の合計をロット単位で表示します。 Volumes Long :全通貨のロングポジションの取引量を表示します。 Volumes(ショート )は、全通貨のショートポジションの取引量を表示
        TrendDecoder Premium
        Christophe, Pa Trouillas
        5 (2)
        レンジと次の動きを特定    |  トレンドの最も早いシグナルと強さを得る   |  反転の前に明確な出口を得る   |  価格がテストするフィボ・レベルを見つける。 非リペイント、非遅延インディケータ - マニュアルおよび自動売買に最適 - すべての資産、すべての時間単位に対応 期間限定キャンペーン   >> 50%OFF 購入後、 推奨セッティングについては、このチャンネルで私に連絡してください。 MT5 バージョン: ここをクリック BladeSCALPER   と   PowerZONES   を使った完全な方法を入手する どのようなものですか? TrendDECODERは、トレンド監視をシンプルかつ簡単にするための複数のイノベーションを集約したものです。 Projective TrendLine (投影トレンドライン) - 今後のトレンドのスピードリファレンス。 RealTime TrendLine vs. Projective TrendLine (リアルタイムトレンドライン vs. Projective TrendLine) - 市場が同じ方
        Gann Signal is a very simple indicator at first glance, but hidden inside is many years of experience in studying W.D.Ganna methods. The indicator gives accurate BUY/SELL signals, without redrawing. The indicator is very easy to use. All you need to do is attach it to your chart and follow its recommendations. The indicator constantly analyzes the market for entry opportunities. When such an opportunity appears, the indicator gives a signal in the form of an arrow. I repeat, all signals are NOT
        まず最初に、このトレーディングシステムがリペイントされず、再描画されず、遅延しないことを強調する価値があります。これにより、プロのトレーディングに最適な状態になります。 「スマートサポートアンドレジスタンストレーディングシステム」は、新規および経験豊富なトレーダー向けにカスタマイズされた高度なインジケーターです。この包括的なシステムは、7以上の戦略、10のインジケーター、およびデイトレード戦略、スイングトレード戦略、サポートおよびレジスタンス戦略、ローソク足パターン戦略、VWAP戦略、マルチタイムフレームトレンド戦略など、さまざまなトレーディングアプローチを組み合わせています。これは、矢印信号、エントリーポイント、出口ポイント、トレードアラート、より高い時間枠のトレンド分析、リアルタイムのトレードモニタリング、そして洞察力のあるトレンドとボリュームキャンドルの着色を提供します。自動的なサポートとレジスタンスの検出により、さまざまな市況下でトレーダーが的確な決定を下すのを支援する多面的なインジケーターとなっています。 スマートサポートアンドレジスタンストレーディングシステムは、
        作者のその他のプロダクト
        Identify Trend
        Aleksey Ivanov
        4.25 (32)
        トレンドの識別インジケータを使用すると、非常に正確に、そして最も重要なこととして、わずかな遅延で、(1)真のトレンドの動きの開始、および(2)フラットを識別できます。このような指標は、スキャルパー戦略による取引と長期取引戦略の使用の両方に使用できます。インディケーター操作アルゴリズムは、最後のスクリーンショットで詳しく説明されています。                              指標の読みは視覚的で非常に単純で、コメントを必要としません。インディケータの青い線は上昇トレンドを表し、金色の線はフラット、そして赤い線は下降トレンドです。したがって、赤または金の線が青に置き換えられた場合はBuyのエントリポイント、青または金の線が赤に置き換えられた場合はSell   - のエントリポイントです。               このインディケータにはあらゆる種類の警告があります。(トレンド方向の)インジケーターの表示が最後の2つのバーに一致すると、アラートがアクティブになります。                価格の動きの方向が変化する可能性のある瞬間も
        FREE
        The Identify Market State   indicator allows you to set the beginning of a new trends and pullbacks on an existing trend. This indicator can be used both for trading on scalper strategies and for long-term trading strategies.               The indicator is based on the 14 periodic DeMarker   indicator and the 8 periodic simple moving average from this indicator. Statistical studies have shown that the sharp peaks of the DeMarker   indicator curve when they drop below its minimum li
        An extremely convenient indicator that truly makes the process of making money on the exchange easy. It is based on the scientifically rigorous theory of the market developed by the author, the beginning of which is presented here .                The full algorithm of this indicator operation is presented in the article .               The indicator calculates the most probable price movement trajectory and displays it on the chart. Based on the predicted price movement trajectory
        The TrueChannel   indicator shows us the true price movement channels. This indicator resembles Donchian Channel   in its appearance, but is built on the basis of completely different principles and gives (in comparison with Donchian Channel , which is better just to use to assess volatility) more adequate trading signals.              As shown in the article , the price actually moves in channels parallel to the time axis and jumps abruptly from the previous channels to the subsequ
        FREE
        Principles of construction of the indicator.               The Absolute Bands (AB) indicator is reminiscent of the Bollinger Bands indicator with its appearance and functions, but only more effective for trading due to the significantly smaller number of false signals issued to them. This effectiveness of the Absolute Bands indicator is due to its robust nature.               In the Bollinger Bands indicator, on both sides of the moving average - Ma, there are lines spaced from Ma by the standa
        FREE
        The Quality trend indicator expresses the ratio of the strength of a trend or the speed of its growth (fall) to the degree of its noisiness or a certain norm of amplitudes of chaotic fluctuations of a growing (falling) price. The position of the indicator line above zero shows an increasing trend, below zero - a falling trend, the fluctuation of the indicator line near zero shows a flat. If the indicator line begins to fluctuate rapidly around zero and approach it, then this indica
        チャートに表示されるトレンドは、必ずしも利益をもたらすことができるトレンドではありません。2種類のトレンドがあります:  1)   安定しているため、トレーダーに信頼できる利益を提供できる基本的な経済的理由によって引き起こされる真のトレンド;  2)    誤ったトレンドセクション。トレンドのように見え、価格を(主に)一方向にシフトする一連のランダムイベントが原因で発生します。これらの誤った傾向のセクションは短く、いつでも方向を逆にすることができます(そして、原則として、識別後すぐに逆になります);  したがって、誤った傾向でお金を稼ぐことは不可能です(偶然ではありません) 視覚的には、真と偽の傾向は最初は区別できません。さらに、ランダムな価格変動またはそれらが生成する誤った傾向は常に真の傾向に重ね合わされ、特に、新しい根本的な経済的原因によって引き起こされる逆転と識別および区別する必要がある真の傾向の後退を引き起こす可能性があります。                カジュアルチャネルインジケーターは、ランダムな価格変動チャネルをプロットすることにより、これ
        The Signal Envelopes   indicator uses the robust filtering method based on: (1) the moving median Buff0 = <Median> = (Max {x} + Min {x}) / 2 and (2) the averaging algorithm developed by the author Buff1 = <(<Median> ) ^ (- 3)> * (<Median>) ^ 4  based on the moving median. The Signal Envelopes   indicator allows you to most accurately and with the minimum possible delay set the beginning of a new trend.  The Signal Envelopes indicator can be used both for trading according to scalpe
        Iterative Moving Average – IMA.   IMA is obtained by correcting the usual   MA.   The correction consists in addition   to MA averaged difference between the time series (X) and its MA, i.e.   IMA(X)=MA(X) + MA ( Х -MA(X)). Correction is done in several iterations (and, exactly, 2 iterations in this indicator) and with a change in the averaging period.               As a result, the time-series points begin to cluster around (on all sides) of the getting   IMA and with a smaller de
        Firstly , the script estimates how many Mx bars of the chart (on which this script is applied) the future trend will most likely continue and what is its quality. Secondly (and most importantly), the script is an auxiliary tool for the extremely mathematically advanced and extremely effective ScientificTrade indicator in trading. The script calculates the optimal averaging period, which is also equal to Mx, of the ScientificTrade indicator, which gives the maximum profit according to the strate
        The principle of constructing indicator lines .               Profit Trade  indicator is very effective for trading. Profit Trade  is a deep development of the well-known Donchian channel  indicator. The upper (BlueViolet color) Dup and the lower (IndianRed) Ddn lines of the indicator are constructed in the same way as in the Donchian channel , based on the highest (high of High) and lowest (low of Low) prices for the previous n1 = 20 periods. The middle line (Gold) Dm is constructed in the sam
        I present an indicator for professionals. ProfitMACD is very similar to classic MACD in appearance and its functions . However, ProfitMACD is based on completely new algorithms (for example, it has only one averaging period) and is more robust, especially on small timeframes, since it filters random price walks. The classic MACD indicator (Moving Average Convergence / Divergence) is a very good indicator following the trend, based on the ratio between two moving averages, namely the EM
        Indicator description.            The “ Alligator Analysis ” ( AA ) indicator allows you to build various (by averaging types and by scales) “ Alligators ” and their combinations, i.e. allows you to analyze the state of the market based on the correlation of this state with a whole range of different " Alligators ".  The classic " Alligator " by Bill Williams is based on moving averages and Fibonacci numbers, which makes it one of the best indicators now. The classic " Alligator "   is based on
        FREE
        Channel Builder(CB) または Ivanov Bands 指標は、 Bollinger Bands 指標を広く一般化したものです。これらの一般化は以下の通りです。まず、CBにおいて、平均線<X>が様々な平均化アルゴリズムを用いて計算される。次に、CBでは、平均偏差の計算に異なるコルモゴロフ平均化が使用されます。               標準のSMA、EMA、SMMA、およびLWMAの平均化アルゴリズムに加えて、中央の線<X>は、中央値=(最大+最小)/ 2スライディング中央値(既定値)になります。さらに、著者が開発した特別な<XF>(高速)および<XS>(低速)のスライディング平均アルゴリズムを使用して<X>を計算します。これらのアルゴリズムは、変動の激しい通貨市場に存在する貿易集約的な大きなノイズをフィルタリングします。つまり、フィルタリングアルゴリズム<XF>を使用すると、トレンドの始まりをすばやく判断できます。また、フィルタリングアルゴリズム<XS>を使用すると、フラット状態への出力をより適切に決定できます。最後に、CBでは、取引
        FREE
        The indicator visualizes the result of the   CalculateScientificTradePeriod    script (which, of course, also needs to be downloaded), which, firstly , estimates how many Mx bars of the active chart the future trend will most likely continue and what is its quality, and, secondly , calculates the optimal the averaging period (which is also equal to Mx) of the ScientificTrade   indicator, which gives the maximum profit according to the extremely effective   ScientificTrade strategy. For the FindS
        The principle of the indicator.                             The Asummetry  indicator allows you to predict the beginning of a change in the direction of trends, long before their visual appearance on the price chart.               The author statistically revealed that before changing the direction of the trend, the probability distribution function of the price is made as asymmetric as possible. More precisely, the price movement in any direction always pulls sideways the function of its dis
        PDP indicator is used for: defining price probability distributions. This allows for a detailed representation of the channel and its borders and forecast the probability of a price appearing at each segment of its fluctuations; defining the channel change moment. Operation principles and features PDP analyzes a quote history on lower timeframes and calculates a price probability distribution on higher ones. Forecast algorithms allow the indicator to calculate probability distributions and m
        Signal Bands is a sensitive and convenient indicator, which performs deep statistical processing of information. It allows to see on one chart (1) the price trend, (2) the clear price channel and (3) latent signs of trend change. The indicator can be used on charts of any periods, but it is especially useful for scalping due to its high sensitivity to the current market state. The functions of the indicator : First, the Signal Bands indicator draws channels into which all price fluctuations ex
        Structure of the indicator.               The Cunning crocodile indicator consists of three moving averages (applied to the price   Median price   = (high + low)/2 ) :   1) the usual MA ( SMA , EMA , SMMA ,   LWMA )  or the mean <X> of the process X and her two generalizations 2) <XF> = <X / <X >> * <X> and 3) <XS> = <X * <X >> / <X> with the same averaging period. All three curves intersect at common points that (such an intersection in which the cunning crocodile, unlike the usual one, "never
        The principle of the indicator.               A simple moving average (SMA) with an averaging period (2n + 1) of bars is always obtained lagging by n bars. If SMA or other types of moving averages are the basis for making trading decisions, then their strong delay does not allow   to open positions in time and close positions, which leads to losses.                            The Estimation moving average without lag ( EMAWL ) indicator calculates the non-lagging moving average, which is calcula
        The principle of the indicator.               The Strong Trend Flat Signal (STFS) indicator is the intersection of two, developed by the author, non-lagging moving averages with averaging periods 21 and 63.               A simple moving average (SMA) with an averaging period (2n + 1) of bars is always obtained lagging by n bars. If SMA or other types of moving averages are the basis for making trading decisions, then their strong delay does not allow  to open positions in time and close positi
        The principle of the indicator.               The StatChannel ( SC ) indicator is a development of the Bollinger Bands indicator ( ВВ ).  BB is a moving average, on both sides of which two lines are drawn, separated from it by standard deviations std multiplied by the corresponding coefficient. At the same time, a moving average with an averaging period (2n + 1) bars is always obtained lagging behind n bars.  Sliding std is also lagging behind on n bars, also calculated by (2n + 1) points. Such
        はじめに             StatPredictインディケータは、一般的なトレンドのトレンドとこのトレンドの周りのそれ自身の小さな統計的な価格変動に従って価格を予測します。 StatPredictでは、予測の期間を設定する必要があります。予測期間は、インジケーター設定の「バーの予測の長さ」パラメーターで設定されます。 (« Length of forecast in bars» ) 予測期間は、現在のトレンドトレンドの特徴的な時間スケールに対応する必要があります。トレンドのタイムスケールは、指標ProfitMACDによって最もよく測定されます。              チャートにインストールした後の指標の読みの最終計算は、新しいティックが到着したときに行われます。              インジケータの動作モードに関する情報は、「エキスパート」タブのチャートにインストールされると印刷されます。         1. 指標の目的.              ランダムプロセスを予測するための数学的方法を使用して、StatPredict指標は将来の価格の最も可能性の高い値を予測し
        Indicator is used for: defining price probability distributions. This allows for a detailed representation of the channel and its borders and forecast the probability of a price appearing at each segment of its fluctuations; defining the channel change moment.   Operation principles and features Indicator analyzes a quote history on lower timeframes and calculates a price probability distribution on higher ones. Forecast algorithms allow the indicator to calculate probability distributions and m
        The principle of constructing indicator lines and their meaning .               The Signal Channel   indicator uses a robust filtering method based on two moving medians applicable to the High and Low prices, i.e. the lines <High> and <Low>, where <..> is the sign of linear averaging, which are shifted by certain values ​​in an uptrend and by opposite values ​​in a downtrend, which allows you to get a narrow channel, approximately outlining each bar. Sharp kinks of the lines of such a channel a
        The Robust filter   indicator is based on the robust filtering algorithm developed by the author using the multi-period averaged moving median. The algorithm for this averaging is shown in the last screenshot.                The indicator calculates and shows: 1. The direction of the trend; 2. Entry and exit points of positions; 3. StopLoss   lines calculated from current price probability distributions and selected probability of closing an order by StopLoss before the trend revers
        This   indicator is intended for professionals assessing fundamental market trends.  This indicator calculates the index of any instrument and analyzes it.              The index of the state currency shows the real purchasing power of this currency, and the dynamics of this index shows the dynamics of the economic state of the corresponding state. An analysis of the indices of both currencies included in a currency pair makes it much more reliable to identify the trend of this cur
        The Multicurrency Trend Detector ( MTD ) indicator allows you to immediately and on one chart on a selected time interval (extending from a zero bar to a bar set in the settings by the value horizon) determine the presence, direction and strength of trends in all major currencies, as well as assess the reliability of these trends.               This is achieved by calculating indices (non-relative purchasing power) of eight major currencies, namely: AUD, CAD, CHF, EUR, GBP, JPY, NZ
        The StatZigZag  indicator looks like a regular ZigZag , but is built on the basis of completely different algorithms. The StatZigZag  indicator is a broken line built from segments of regression lines of different lengths, the beginning of each of which comes from the end of the previous segment. Each regression segment is built until the variance or spread of price around it begins to exceed a certain critical value, after which the construction of this segment ends and the constr
        The Velocity of price change   ( VP ) indicator shows the average rate of price change at those characteristic time intervals where this rate was approximately constant. The robust algorithm used in VP   to smooth out the price from its random jumps, ensures the reliability of the indicator reading, which does not react to simple price volatility and its insignificant movements.             The indicator allows you to track trends and the moments of their reversals , during which t
        フィルタ:
        iliabogos2020
        29
        iliabogos2020 2019.09.12 17:28 
         

        Привет всем ! Пока тестирую индикатор, на каком ТФ ловить сигналы , есть разница ? Спасибо.

        Alec Markarian
        329
        Alec Markarian 2019.03.04 22:37 
         

        Great indicator to use for confirmation of bias and/or exits, under correct settings and time frame, can be adjusted very well to precisely fit your strategy, in what ever market it is that you trade.

        Uladzimir Izerski
        14278
        Uladzimir Izerski 2019.01.11 17:45 
         

        Вижу профессионализм над созданием. Очень хорошо.

        レビューに返信
        バージョン 7.0 2021.11.03
        1. 改善されたロット計算アルゴリズム。これは、外国為替だけでなく、CFDおよび先物についても計算されるようになりました。
        2. インジケーターによって計算された数値データの表示が改善されました。
        バージョン 6.0 2020.11.03
        Added TakeProfit calculation algorithm.
        バージョン 5.1 2020.10.05
        Added the ability to hide StopLoss lines.
        Optimization of the code.
        バージョン 5.0 2020.08.27
        1. Improved filtering algorithm for random market noise.
        2. Based on the current distributions of the probability of prices and the given probability of obtaining unprofitable trades, the StopLoss lines were calculated and visualized.
        3. Added the function of calculating the lot based on the size of the deposit, the permissible % loss level and the StopLoss position.

        バージョン 4.0 2019.11.20
        Added arrows showing the moments of the change in the direction of the trend.
        Three modes of visual display of information are made:
        1) Arrows showing the immediate direction of price movement and the moment of trend change.
        2) Arrows showing only the direction of price movement.
        3) Arrows showing only the moments of a trend change.
        バージョン 3.0 2019.05.14
        Added push and mail alert types.
        A number of signal identification methods have been introduced.
        バージョン 2.0 2019.02.05
        The indicator added the ability to select any type of notification of trading signals, namely:
        1. Window with message and beep (function Alert).
        2. The text in the tab "expert" (function Print);
        3. A message on the chart (function Comment);
        4. Beep and text in the "expert" tab;
        5. Beep and message on screen;
        6. Single beep (function PlaySound).
        The alert is activated when the indicator indications (for the trend direction) coincide on the last two bars.