Magic Finger Singal
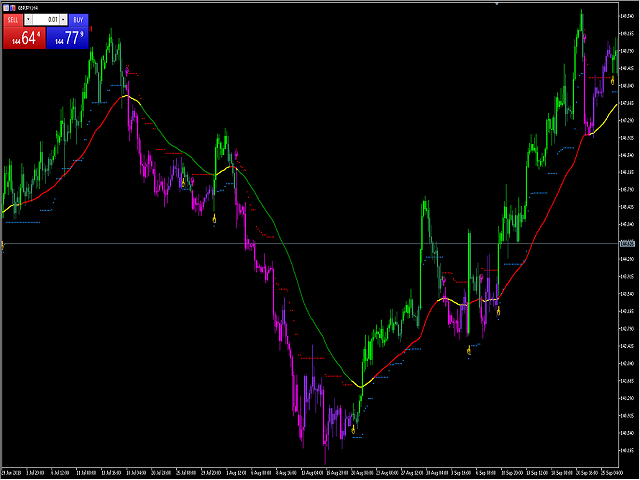
Magic Finger can help you identify trends and trading opportunities clearly. The finger points to the open position signal, and the discoloration line is confirmed by the trend.
If you are a day trader, you can choose to trade during a period of active trading, referring to the discoloration line as the basis for the next order, finger signal as a filter.
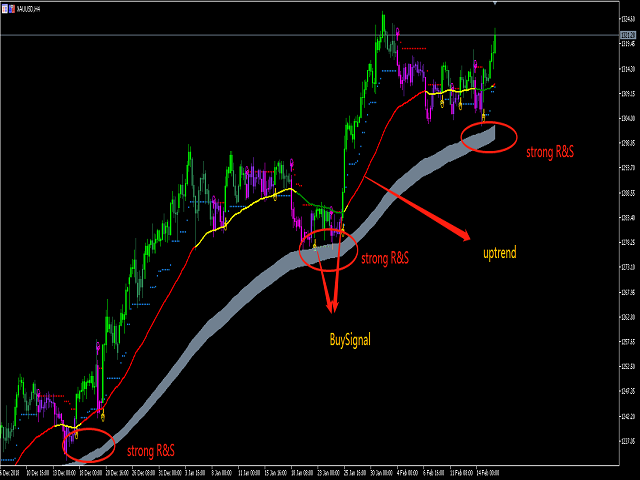
If you are a trend trader, you can choose a period above H1, wait for the appearance of the finger signal in the key price area, and enter the market to trade, and then use the discoloration line as a confirmation of the trend.
If you are a day trader, you can choose to trade during a period of active trading, referring to the discoloration line as the basis for the next order, finger signal as a filter.
If you are a trend trader, you can choose a period above H1, wait for the appearance of the finger signal in the key price area, and enter the market to trade, and then use the discoloration line as a confirmation of the trend.
Stop loss can be used as a basis for stop loss dots.
Input parameters:
| RISK | 5 |
| MONEY RISK | 2.0 |
| AlertOption | ********************************* |
| Local Alert | true |
| TimesOfAlerts | 2 |
| E-Mail Alert | false |
| App PUSH Notification | false |
| ***ADR Option** | ********************************* |
| Display ADR | true |
| ATR Period | 18 |
| Normal Color | DarkOrange |
| Reach Color |
MediumBlue
|
UPDATES:
Version 3.41 2019.04.09
- Bug fix.
Version 3.40 2019.04.08
Version 3.40 2019.04.08
- Increase the Moving ADR, which is used to guide the intraday price range and the reference TP price for the day trader.Moving ADRindicator can be purchased independently in the market, only a very low price)
- Optimized the problem of RS coverage the candles.
Version 3.30 2019.02.17
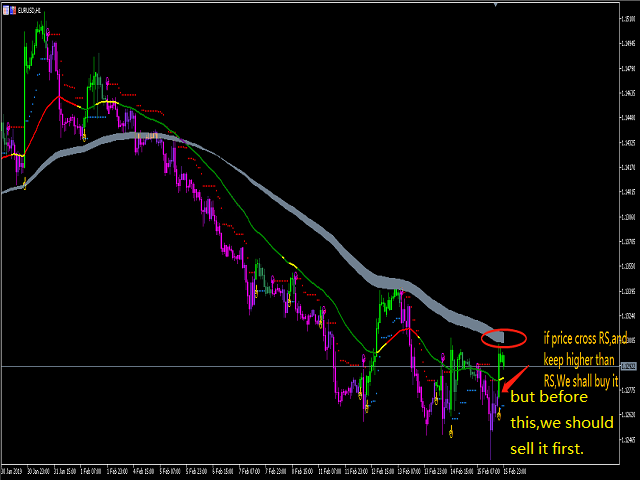
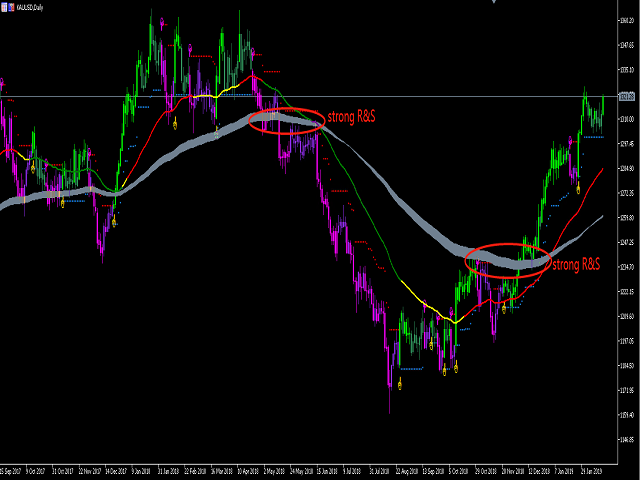
- Increased RS, when the price is blocked or crossed in the RS area, indicating that the trend continues or reverses, and the RS area is the best trading position, giving you a better risk-reward ratio.

Really good indicator, I use the colored candles and entries all the time. Best on longer TF's like 1hr, 4hr, Daily
Excellent support from the developer.