Sniper MACD
- インディケータ
- Yaroslav Varankin
- バージョン: 1.0
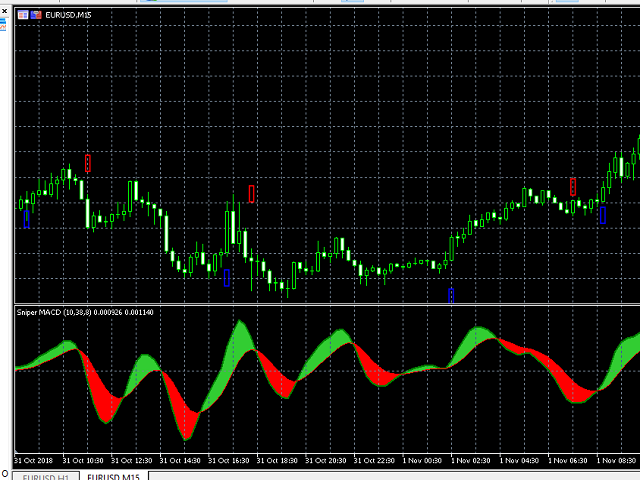
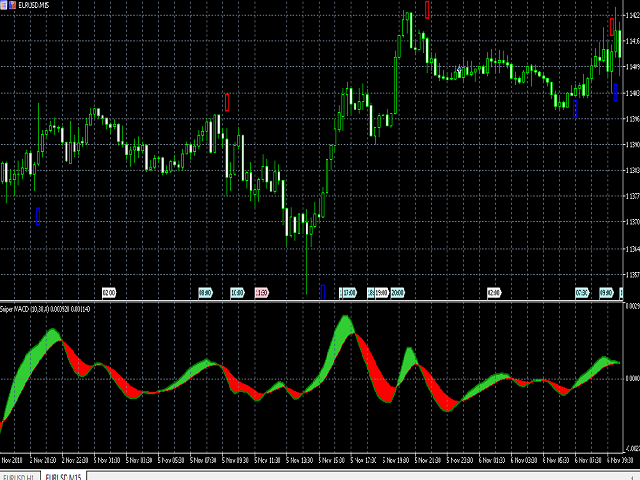
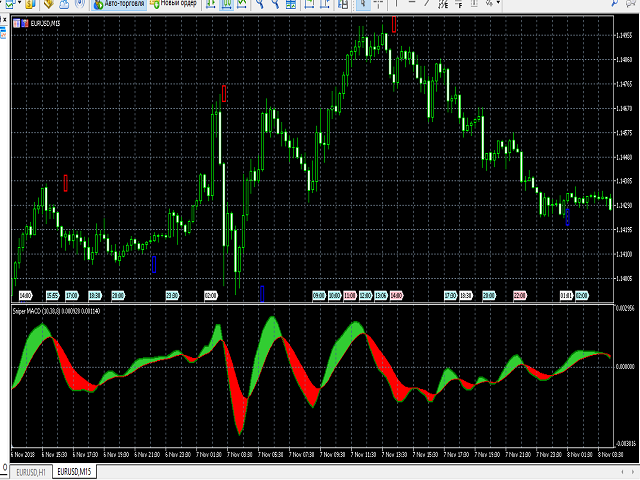
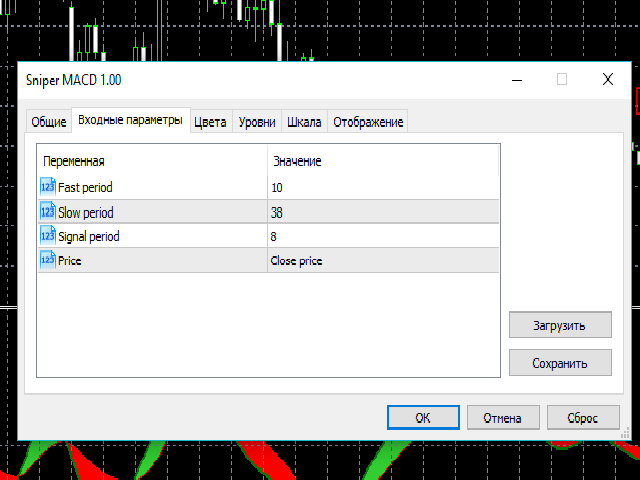
いくつかの方法で改良されたスナイパーMACDインジケーター。
追加のフィルタがあります
最大の結果を得るために数回平滑化される
市場および現在の価格条件に関する情報をより正確に表示するために、ボリュームインジケータも追加されます
短期的な期間に設定されているので、m1からm30までの期間に指標を使用することをお勧めします
eur.usd - eur.jpyのような非常に揮発性の高い通貨ペアで取引することをお勧めします
あなたの注意と落札していただきありがとうございます。
-----------------------------------------------------------------------------------------------------------------------------
いくつかの方法で改良されたスナイパーMACDインジケーター。
追加のフィルタがあります
最大の結果を得るために数回平滑化される
市場および現在の価格条件に関する情報をより正確に表示するために、ボリュームインジケータも追加されます
短期的な期間に設定されているので、m1からm30までの期間に指標を使用することをお勧めします
eur.usd - eur.jpyのような非常に揮発性の高い通貨ペアで取引することをお勧めします
あなたの注意と落札していただきありがとうございます。


Gostei muito. Foi incluido no meu operacional.