Auto Chart Alert MT4
- ユーティリティ
- Young Ho Seo
- バージョン: 1.5
- アップデート済み: 4 3月 2022
Introduction
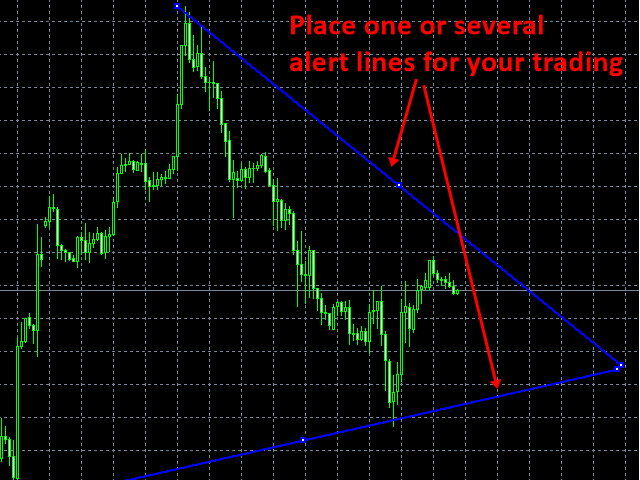
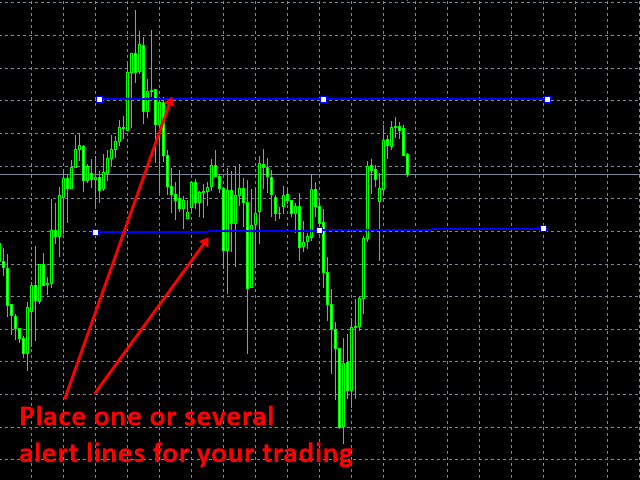
Auto Chart Alert is a convenient tool to set alert for your trading in your chart. With Auto Chart Alert, you can set the alert line in one click in your desired location in your chart. You can even set alert over the sloped lines in your chart. Auto Chart Alert is a great tool when you have to watch out importnat support and resistance levels for your trading. You can receive the sound alert, email and push notification when the price hit the alert line at you desired location. Auto Chart Alert is a free tool to use and to share.
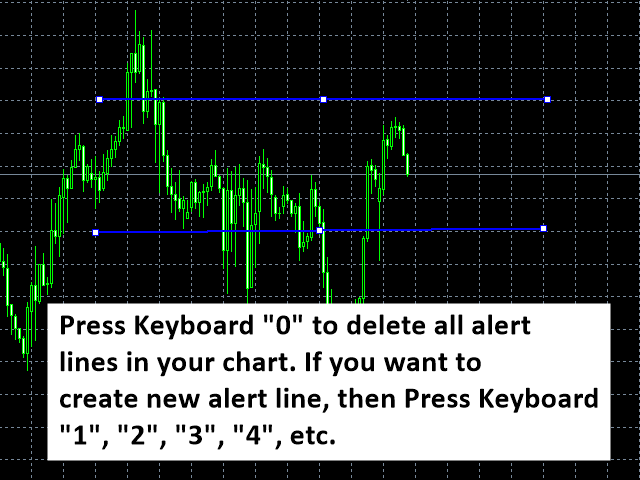
How to use
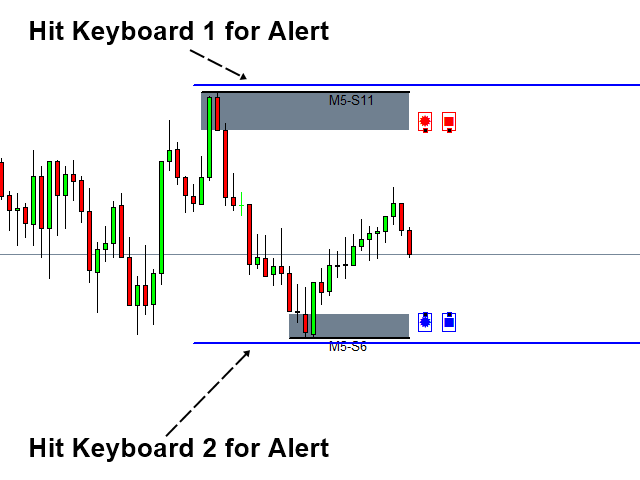
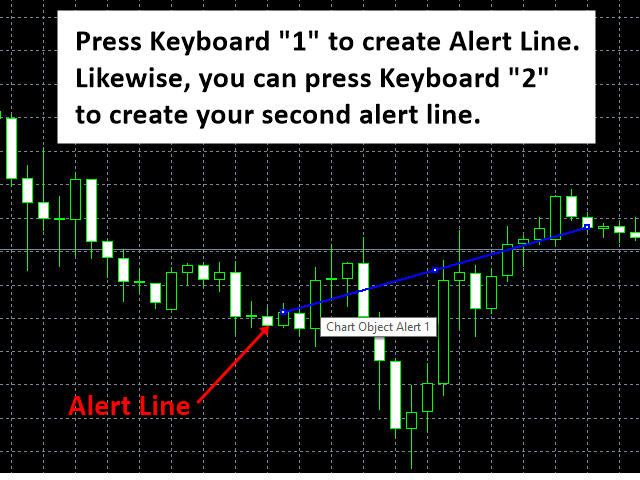
Auto Chart Alert uses Keyboard operation. Especially it uses number key to create or remove the alert lines.
- Key Board 0: Delete all auto alert lines in your chart
- Key Board 1: Set Alert line 1 above current price
- Key Board 2: Set Alert line 2 below current price
- Key Board 3: Set Alert line 3 above current price
- Key Board 4: Set Alert line 4 below current price
- Key Board 5: Set Alert line 5 above current price
- Key Board 6: Set Alert line 6 below current price
Trading Direction
Auto Chart Alert is great trading solution for Price Action and Pattern Trading. You can use the Auto Chart Alert for the following trading strategy or system.
- Traditional support and resistance trading
- Round number (psychological number) trading
- Price Breakout Pattern Scanner (Advanced Price Pattern Scanner)
- Harmonic Pattern Plus
- Sideways market analyser
- Any other Price Action and Pattern Trading system
Input Settings
- Alert for Price Cross over the line : true to use cross over alert
- Alert for Distance: Set to true to use otherwise, set to false
- Alert Distance in Pips: This is the distance in pips you will get alert between current price and the alert trend line (alert for distance must set to true)
- Trend Line Size in Bar: length of Trend line from current time to backward in candle bar number
- Trend Line Projection in Bar: length of Trend line from current time to forward in candle bar number
- Trend Line Offset: 1 to 10 only. Higher the number, the trend line will be offset from the current price
Trading Strategy Guide
Guide for Volume Spread Analysis: https://www.mql5.com/en/blogs/post/747652
Guide for Harmonic Pattern Detection Indicator: https://www.mql5.com/en/blogs/post/747647
Guide for Momentum Indicator: https://www.mql5.com/en/blogs/post/747633
Guide for Supply Demand Indicator: https://www.mql5.com/en/blogs/post/747632
Guide for Triangle Pattern, Falling Wedge Pattern, Rising Wedge Pattern and Channel: https://www.mql5.com/en/blogs/post/747649
Guide for Elliott Wave Indicator: https://www.mql5.com/en/blogs/post/747668
Guide for Volatility Indicator: https://www.mql5.com/en/blogs/post/747670
Important Note
This is the off the shelf product. Therefore, we do not accept any modification or customization request on this product. In addition, we do not provide any code library or any support for your coding for this product.


very good