MRS indicator mt5
- インディケータ
- Daifallah Alamri
- バージョン: 1.0
- アクティベーション: 5
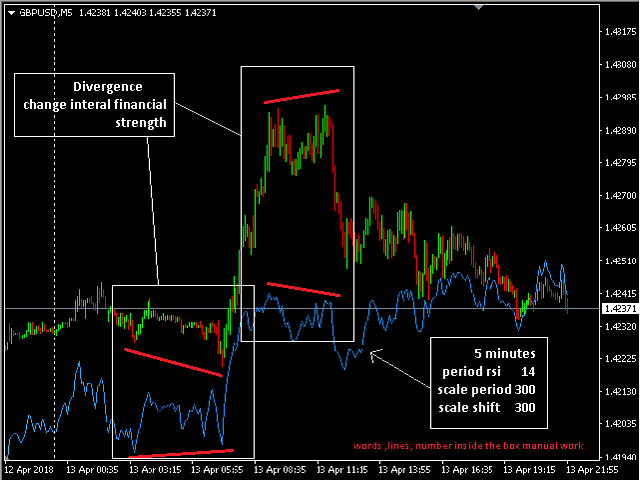
MRS Indicator: Moving Relative Strength.
Indicator developed by me to use custom Moving Average and characteristics of Relative Strength in one line.
If you have any questions about the indicator, your comments are welcome.
MRS features
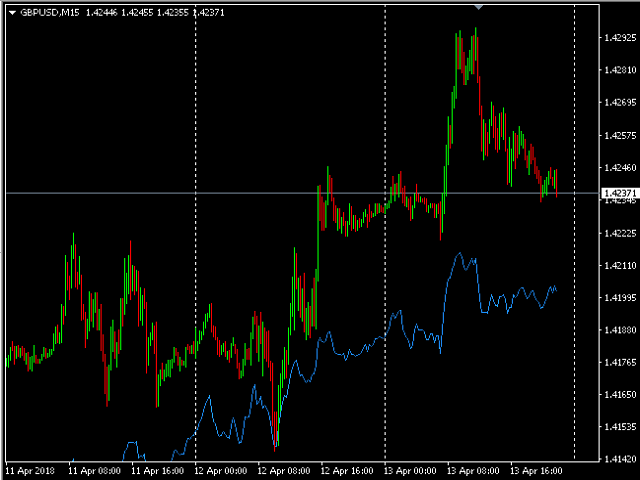
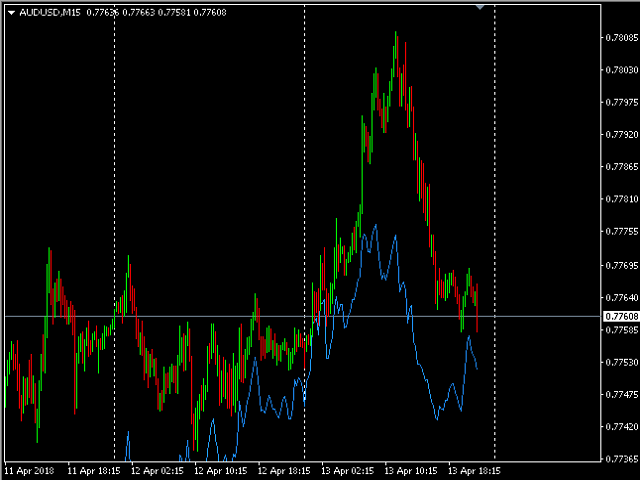
- Works for all timeframes.
- 100% non-repaint indicator.
- Settings are changeable as a user needs.
- Recommend to use this product on smaller timeframes: M5, M15.
Parameters
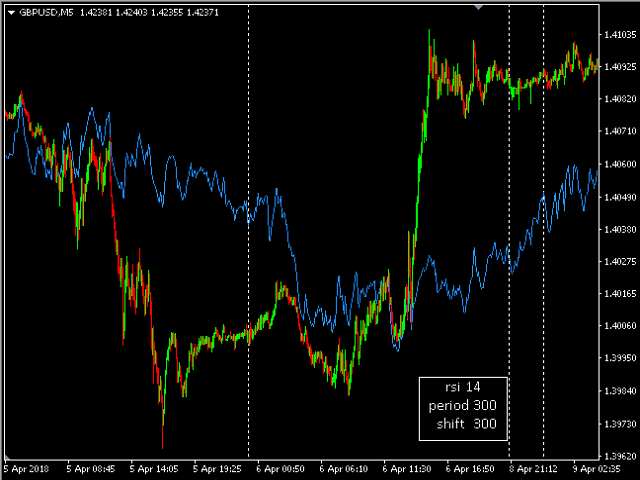
- Period RSI - number of bars to calculate a RSI value. Recommended values 5-55
- Price RSI:
- Close price
- Open price
- High price
- Low price
- Median price
- Typical price
- Weighted close price
- Scale period - number of bars to be used in the calculation of Period MRS.
- Scale shift (points) - distance in points away from the line to show the deviation from the price according to the indicator settings.