Shepherd Gann Squares MT5
- インディケータ
- Abdullah Alrai
- バージョン: 3.2
- アップデート済み: 22 2月 2022
- アクティベーション: 5
この指標は、W.D。Gannが書いた「市場予測の数式」の記事に基づく市場分析手法であり、9の2乗と144の2乗に依存しています。
ユーザーマニュアル:
Add Your review And contact us to get it
MT4のフルバージョンは次の場所から購入できます。
あなたは無料でMT4でテストすることができます:
https://www.mql5.com/en/market/product/15320?source=Site+Profile+Seller#!tab=reviews
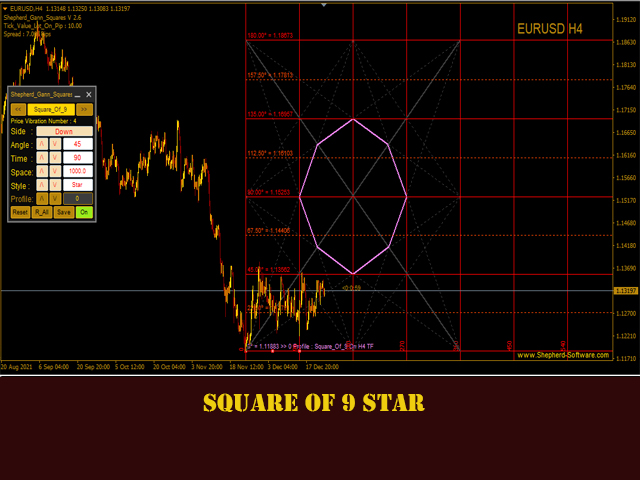
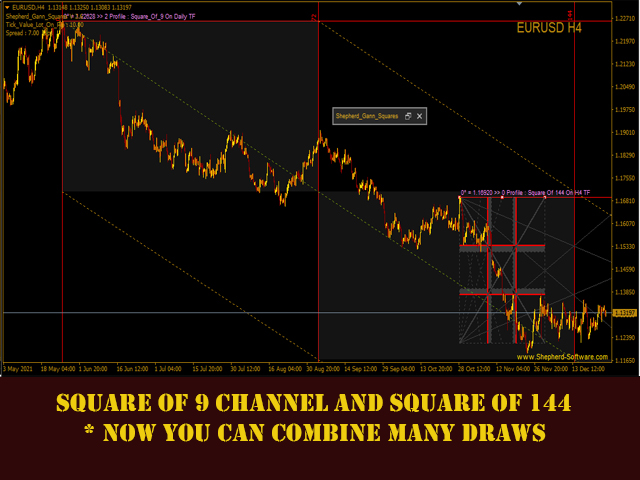
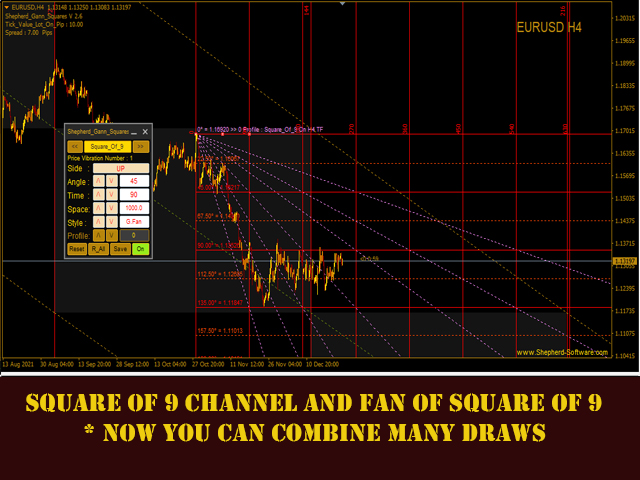
この製品は、レベル/スター/グリッド/ガンファン/として9の正方形を描くことができます。
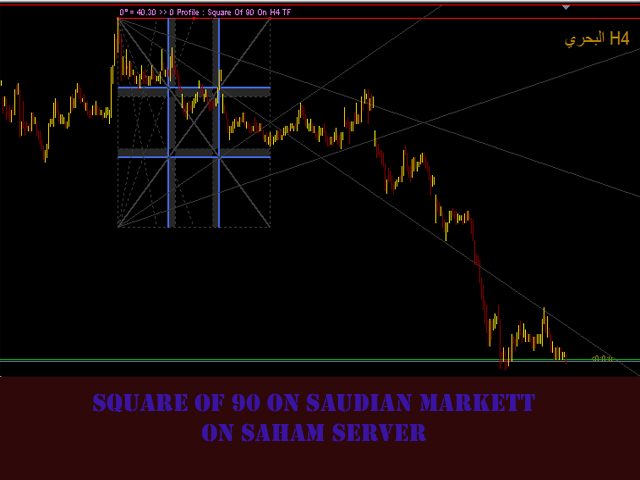
ガンスクエアも描画します:52/90/144。
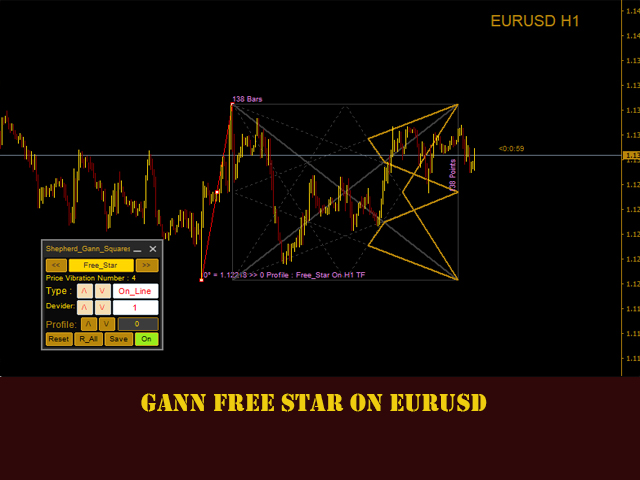
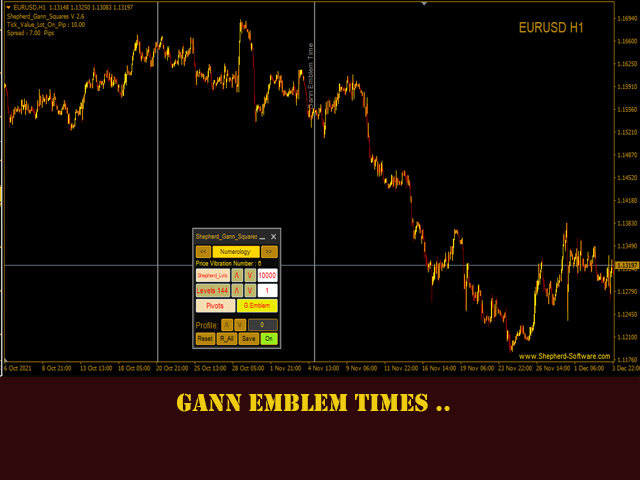
チャート上で直接移動可能なフリーガンスターを描画します。
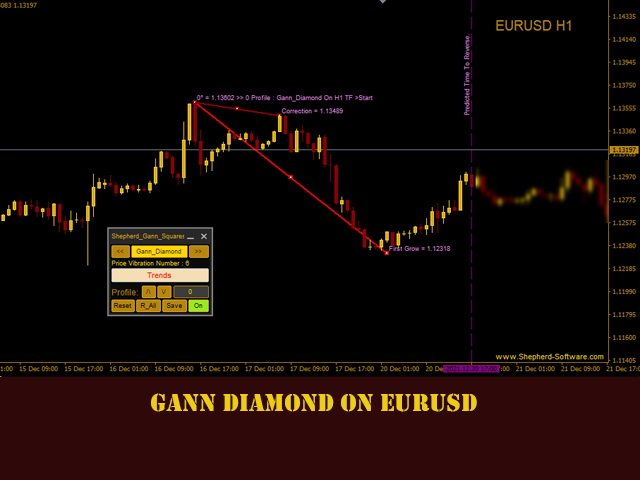
また、ガンダイヤモンドを描画します。
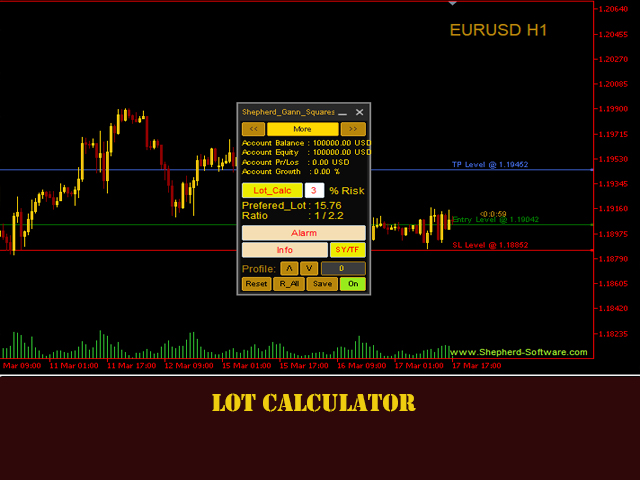
それはあなたがあなたのエントリーのために最高のロットを計算することができるようにするロット計算機を持っています。
インジケーターにはパネルがあり、次のことができます。
144/90/52の正方形/ 9の正方形/ガンフリースター/ガンダイヤモンド/数秘術ツール/ロット計算機とアカウント情報の間を移動します。
インジケーターはプロファイル上のすべての作業を保存し、いつでもロードおよびアンロードできます。
ボタンを押すだけで、保存したすべてのデータをリセットできます。
この製品は、ウィリアム・ギャンの分析と数秘術に取り組むアナライザーにとって最も重要なツールの1つです。
ビデオを見て、私たちのウェブサイトから私たちのPDFを読んで、それを使用する方法を知り、ここで物事がどのように行われているかを知ってください。
パラメーター
Shepherd_Gann_Squares-タイトルだけ。
Use_System_Theme-テーマスタイルを選択します
Show_Last_Candle_Counter-キャンドルカウンターを有効/無効にします。
Rotation_Counts-1回転= 360度ここで、描画するサイクル数を選択します。
Angles_Font_Size-角度のフォントサイズを設定します。
Main_Angles_Color-主角度の色を設定します。
Main_Angles_Style-主角度のスタイルを設定します。
Main_Angles_Width-主角度の幅を設定します。
Sub_Angles_Color-サブ角度の色を設定します。
Sub_Line_Width-サブ角度の幅を設定します。
Sub_Line_Style-サブ角度のスタイルを設定します。
Time_Separator_Color-時間区切り色を設定します。
Channel_Rec_Color-チャネルの長方形の色を設定します。
Channel_Color-チャンネルラインの色を設定します。
Channel_Style-チャンネルラインの幅を設定します。
Star_Color-9つ星の正方形と無料の星の両方に星の色を設定します。
Star_Style-9つ星の正方形とフリースターの両方にスタースタイルを設定します。
Star_Core_Style-塗りつぶされている場合と塗りつぶされていない場合のスターコアスタイルを設定します。
Star_Core_Color-スターコアの色を設定します。
Gann_Fan_Color-Gannファンラインの色を設定します。
Gann_Fan_Style-Gannファンラインスタイルを設定します。
Gann_Fan_Width-Gannファンラインの幅を設定します。
Gann_Square_Color-Gannの正方形144/90/52の線の色を設定します。
Gann_Square_Style-Gannの正方形144/90/52の線のスタイルを設定します。
Gann_Square_Width-Gannの正方形を144/90/52の線幅に設定します。
Gann_Squares_More_Fans-パネルのファンボタンを押すと、より多くのファンを表示するガンスクエア144/90/52を設定します。
Gann_Square_Fans-Gannの正方形144/90/52のファンの色を設定します。
Shepherd_Levels_Color-ガンの正方形を144/90/52レベルの色に設定します。
Shepherd_Levels_Style-Gannの正方形を144/90/52レベルのスタイルに設定します。
Shepherd_Levels_Width-ギャンの正方形を144/90/52レベルの幅に設定します。
Shepherd_Levels144_Color-144行の色のガンレベルを設定します。
Shepherd_Levels144_Style-144行スタイルのGannレベルを設定します。
Shepherd_Levels144_Width-144行幅のGannレベルを設定します。
Pivots_TF-ピボットの時間枠を設定します。
Position_Of_Right_Prices-角度値のテキストの位置を設定します。
Save_On_All_Platforms-アクティブにすると、すべてのプラットフォーム間で保存したものが読み込まれます。
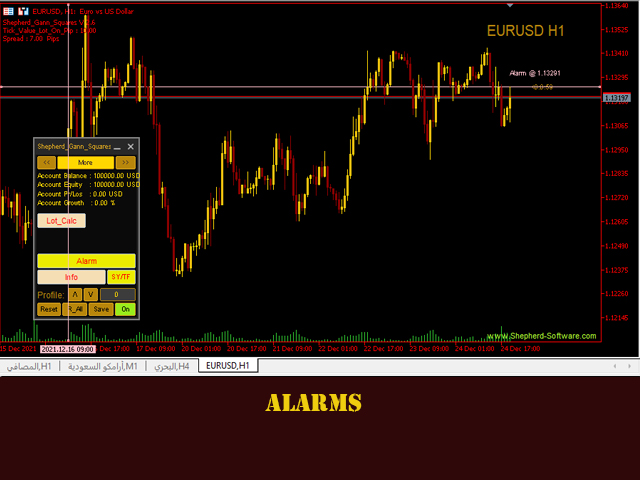
アラート-アラームのアラートを有効/無効にします。
Push_Notifications-アラームのプッシュ通知を有効/無効にします。


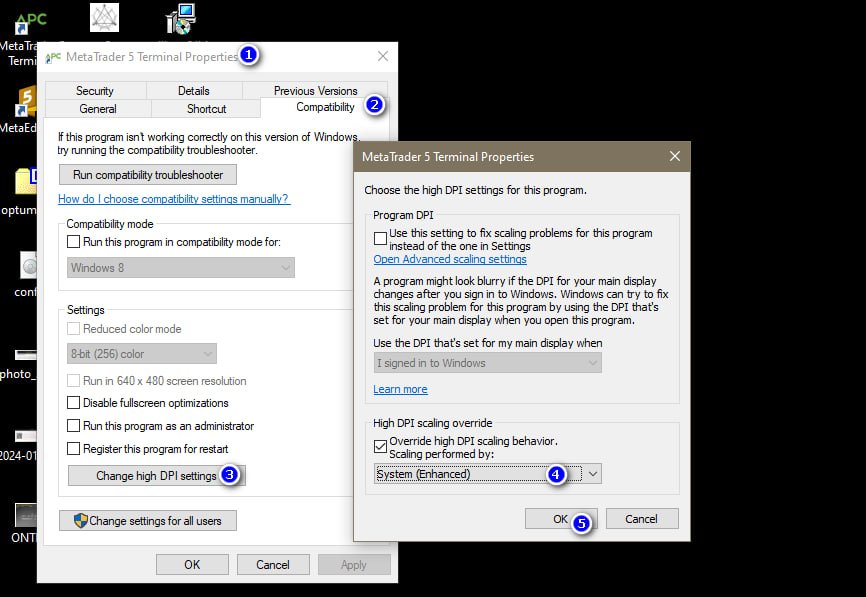


سهم تهامة لايشتغل معي خاصية styie