RSI Currency Strength Meter DEMO
- インディケータ
- Miroslav Stojic
- バージョン: 1.2
- アップデート済み: 1 6月 2019
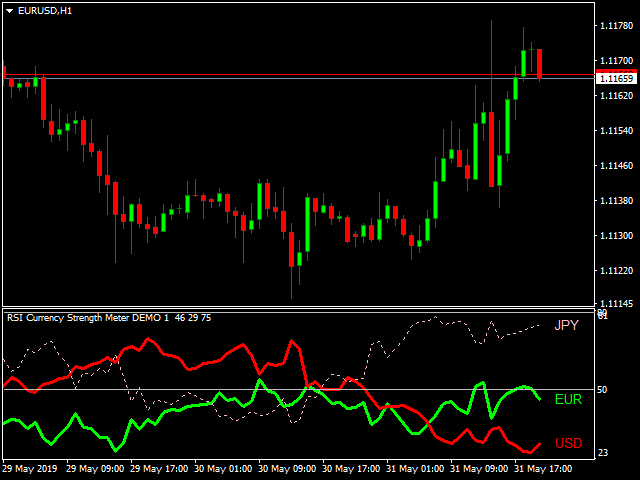
RSI Currency Strength Meter uses RSI (Relative Strength Index) to monitor how strong a currency is, or in other words, if it's being bought or sold by the majority compared to the other currencies. It displays the strength-lines of the currencies of the pair (base and counter currency of the chart) with changeable solid lines. Also, you can add up to ONE additional currency (only 1 in the DEMO version, in REAL up to 5) to the "comparison pool" that already has the base and the profit (counter) currency of the pair. If you want to look and compare, for example, EUR, USD and JPY, it will only look at the EURUSD, USDJPY and EURJPY!
Note: This is a DEMO version of the indicator! THe link to the REAL https://www.mql5.com/en/market/product/25194
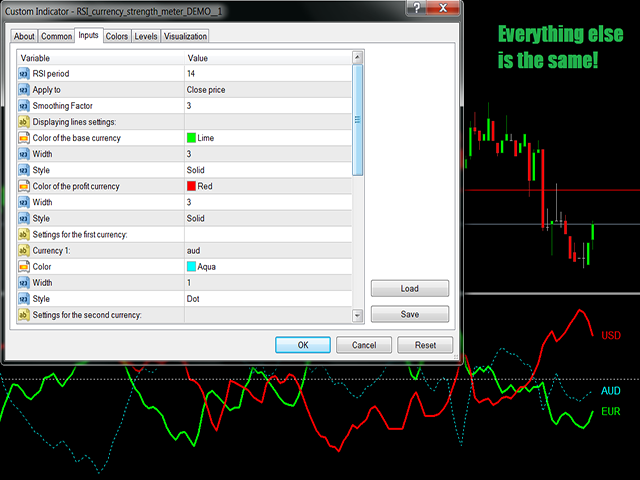
Settings for the RSI indicator used:
- RSI period: the period of the RSI (14 by default),
- Apply to: which price should RSI be based on (close, open, high, low, median...),
- Smoothing Factor: so that the lines look smoother - 1 or less is for no smoothing, and 2 or more to increase smoothing applied (the smoothing factor applies to the RSI currency strength meter indicator, and not to the RSI used).
Lines formatting for the base and counter currency:
- Color of the base currency: self-explanatory, select the colour for the base currency,
- Width: width of the line of the base currency,
- Style: line style (solid, dash, dot...),
- Color of the profit currency: colour for the counter currency,
- Width: width of the line of the profit currency,
- Style: the style of the line of the profit currency (solid, dot, dash...).
Next is formatting for the additional 5 currencies (this one example is the same for all 5):
- Currency n: write in the 3 letters symbol of the currency you want to display (examples: "eur" or "aUd" or "usD" or "NZD".."Btc", "LTC", "cNY" - all these formats are acceptable)
- Color: colour of that selected currency,
- Width: line width,
- Style: line style (if width is 1).
The settings are the same for the next 4 currency slots.
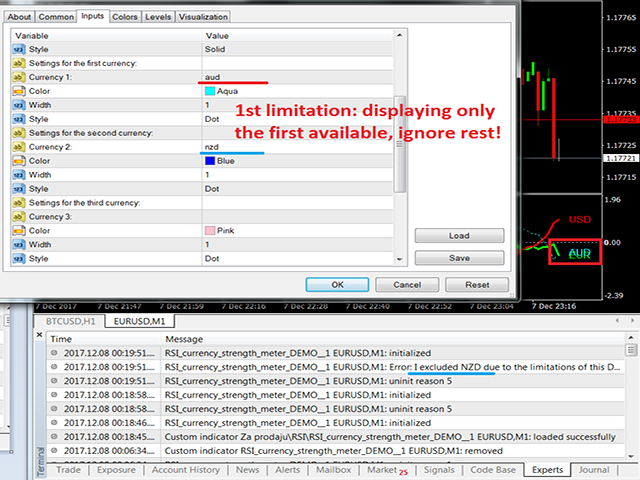
Limitations of the DEMO version:
- You can only display 1 additional line. Usually, the indicator takes the first available one, and ignores the rest! In total, there can be up to 3 lines on the chart!
Also, visit the REAL version of this indicator here: https://www.mql5.com/en/market/product/25194
Suggestion: Watch the provided video to make everything clear.
Indicator does not display on charts...
In fact I did, but the piece of crap didn't work, fix it!