SmartTrendMt5
- インディケータ
- Andrey Spiridonov
- バージョン: 1.0
- アクティベーション: 15
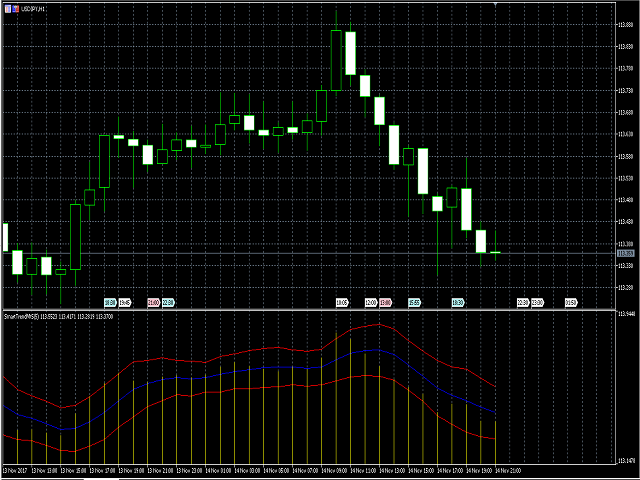
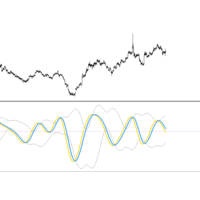
The SmartTrendMt5 trend indicator generates signals based on the principle of combined analysis of calculated reference points within the Keltner channel.
The indicator plots the Keltner channel in a separate window (by default, red lines and a blue line - the middle of the channel), and also draws the histogram of calculated reference points for each candle (by default, the histogram bars are yellow).
The should be attached to a chart of any timeframe and any trading symbol in the usual way.
Advantages of the indicator
- High accuracy.
- Works with any trade symbols.
- It works on any timeframes.
- The indicator does not repaint.
Input parameters
- MA_Period - period of the moving average (the middle line of the Keltner channel).
- Mode_MA - type of moving average (middle line of the Keltner channel).
- Price_Type - price type for the moving average (the middle line of the Keltner channel).
Points to remember for trading
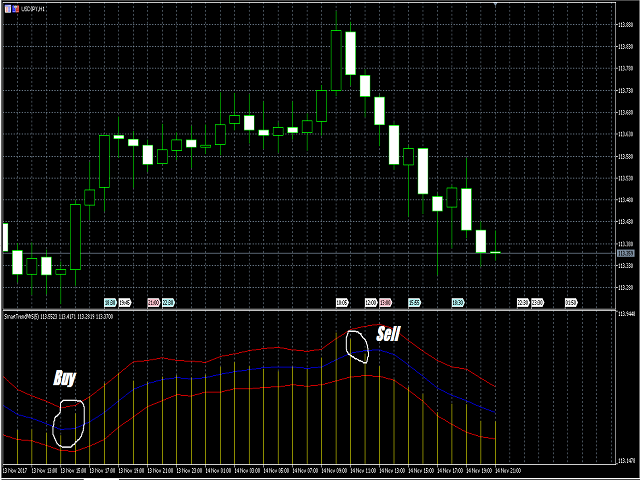
- Buy, when the yellow histogram of reference points rises above the blue middle line of the Keltner channel. The histogram of the previous candle's reference points must be lower than the blue middle line of the Keltner channel. Look for a position exit points when the yellow histogram approaches or breaks the red upper boundary of the Keltner channel.
- Sell, when the yellow histogram of reference points falls below the blue middle line of the Keltner channel. The histogram of the previous candle's reference points must be above than the blue middle line of the Keltner channel. Look for a position exit points when the yellow histogram approaches or breaks the red lower boundary of the Keltner channel.

