SoarSignalMT5
- インディケータ
- Daying Cao
- バージョン: 1.1
- アップデート済み: 24 8月 2017
- アクティベーション: 20
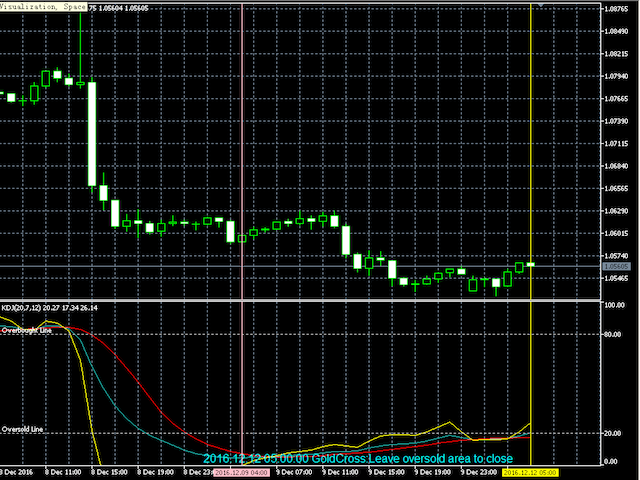
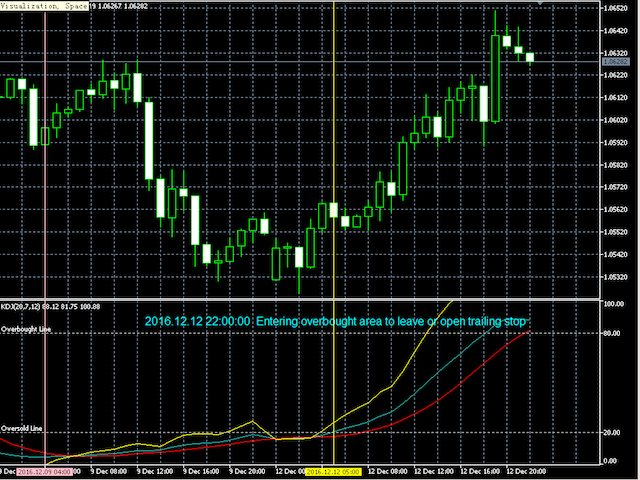
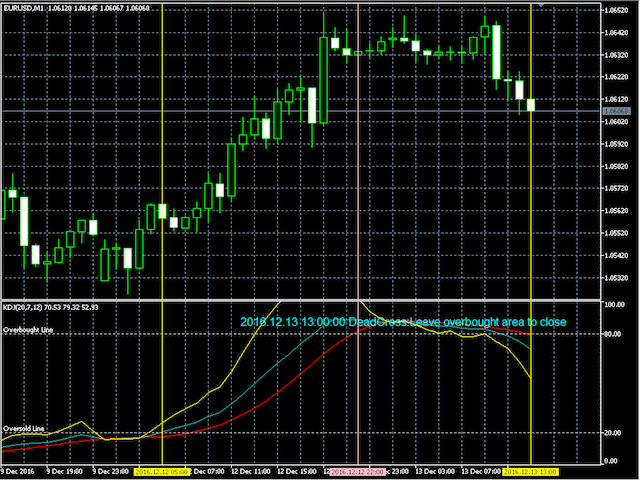
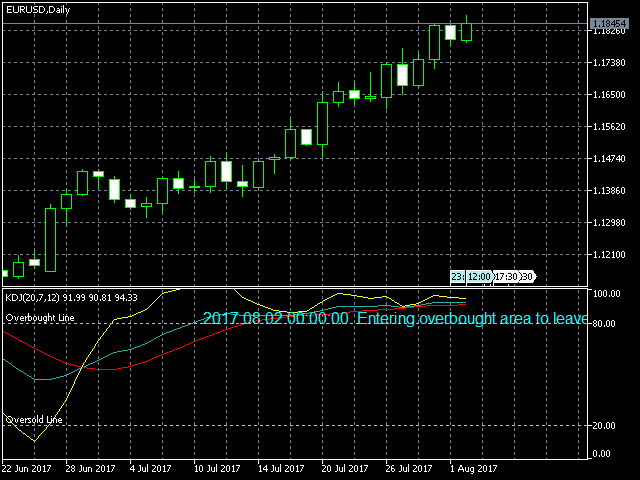
Professional traders know that a reversal in market price is the best entry points to trade. The trend changes K line state changes the most obvious. The SoarSignal is good to identify these changes, because we have incorporated the KDJ indicators. It is the closest to the K line state of the indicators. The two lines of KDJ Winner move within a range of 0 and 100. Values above 80 are considered to be in overbought territory and indicate that a reversal in price is possible. Values below 20 are considered oversold and also indicate a possible reversal. When %K crosses over %D, %J crosses over %K and %D, this can be interpreted as a signal to buy. When %K crosses under %D, %J crosses under %K and %D, this can be interpreted as a signal to sell. Such crossovers can occur too often. To get a more reliable signal, one can wait for crossovers occurring together with reaching of overbought/oversold levels.
Key Advantages
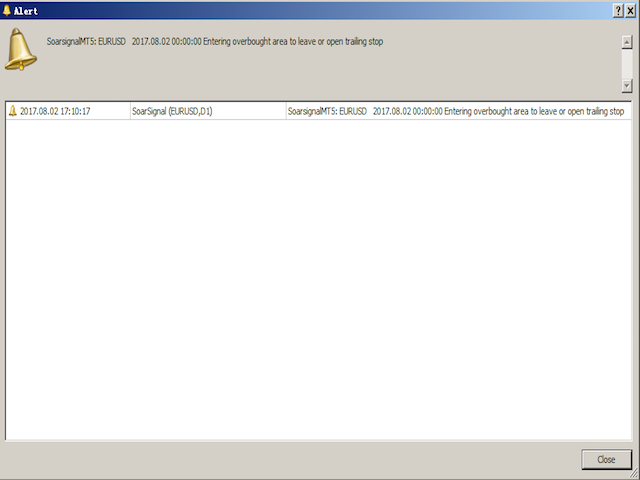
- Prompt the user in the overbought area.
- Prompt the user in the oversold area.
- Prompt the user in the deadcross signal.
- Prompt the user in the goldcross signal.
Inputs
- nPeriod: 20 - indicator period.
- zoneSELL: 80 - values above 80 are considered to be in overbought territory and indicate that a reversal in price is possible.
- zoneBUY: 20 - values below 20 are considered oversold and also indicate a possible reversal.
- InpBuyColor: LighSeaGreen - long arrow color.
- InpSellColor: clrRed - short arrow color.
- ISALARM: false - alerts notification on/off (alarm window, mail, push).
- Alert_ON: true - enable alarm, email, push
- Alert_Min_Interval: 15 - alarm interval 15 minutes.
Author
- Daying Cao, an experienced software engineer.