Advanced Currency Strength28 MT5
- インディケータ
- Bernhard Schweigert
- バージョン: 8.9
- アップデート済み: 11 3月 2024
- アクティベーション: 5
初心者やエキスパートトレーダーに最適なソリューション!
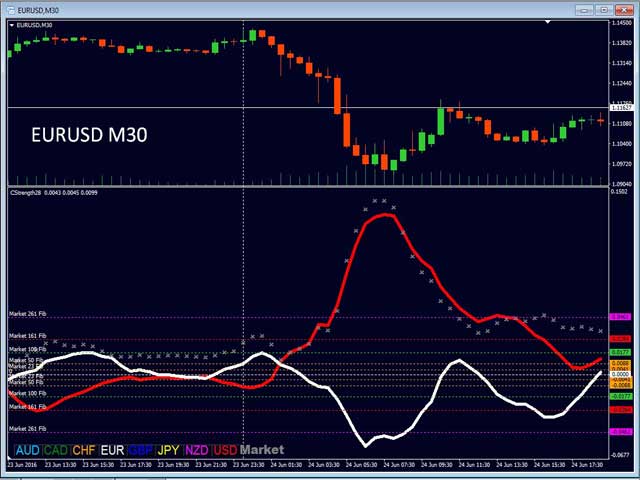
このインジケーターは、独自の機能と新しい計算式を取り入れた、ユニークで高品質、かつ手頃な価格のトレーディングツールです。たった1枚のチャートで28の為替ペアの通貨強度を読み取ることができます。新しいトレンドやスキャルピングチャンスの引き金となるポイントを正確に特定することができるので、あなたのトレードがどのように改善されるか想像してみてください。
ユーザーマニュアルはこちら https://www.mql5.com/en/blogs/post/697384
これが最初の1本、オリジナルだ! 価値のないクローンを買わないでください。
特別な
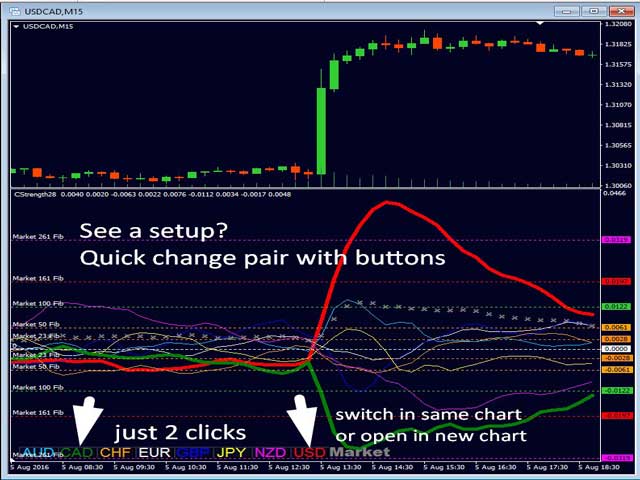
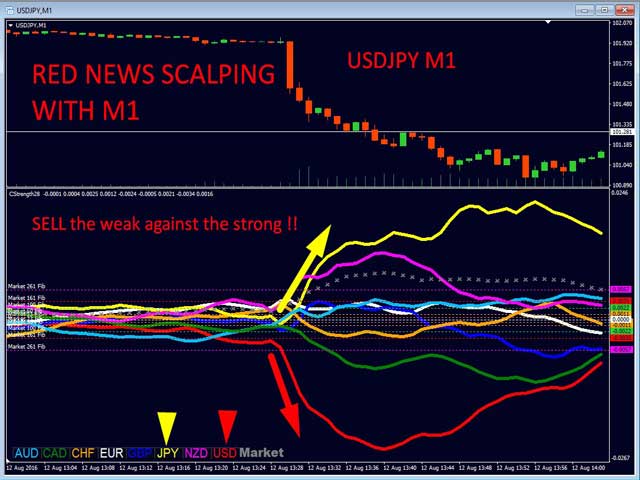
- サブウィンドウの矢印で強い通貨の勢いを表示 GAPがあなたのトレードを導く!
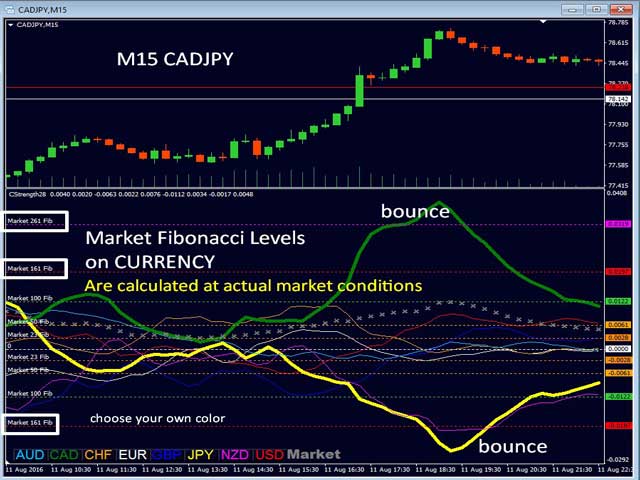
- 基準通貨や気配値が売られすぎ・買われすぎのゾーン(外相フィボナッチレベル)にあるとき、個別チャートのメインウィンドウに警告表示。
- 通貨がレンジの外側から反落した場合、プルバック/リバーサルのアラート。
- クロスパターンの特別なアラート
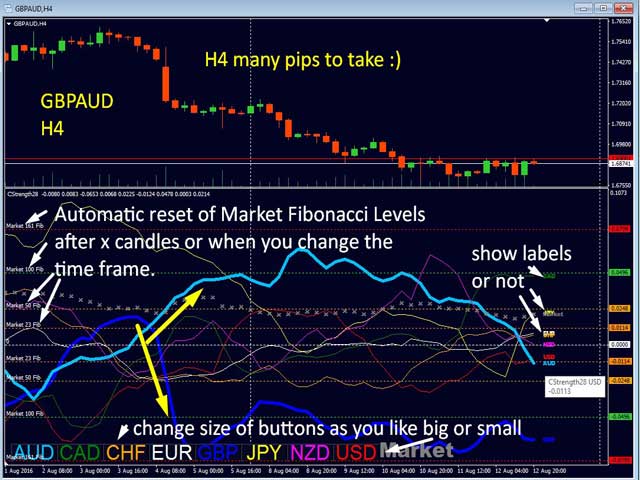
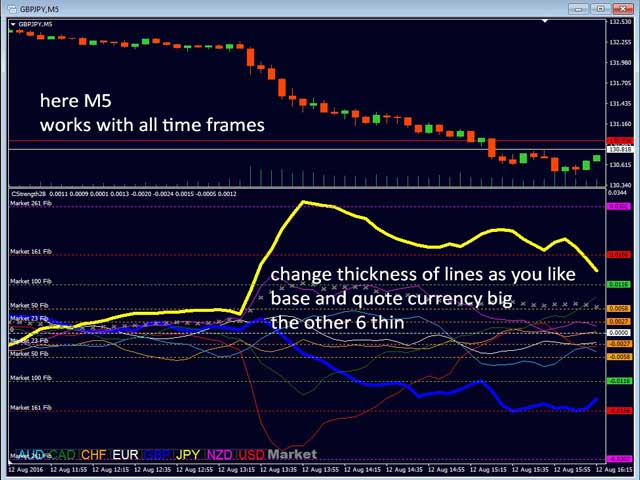
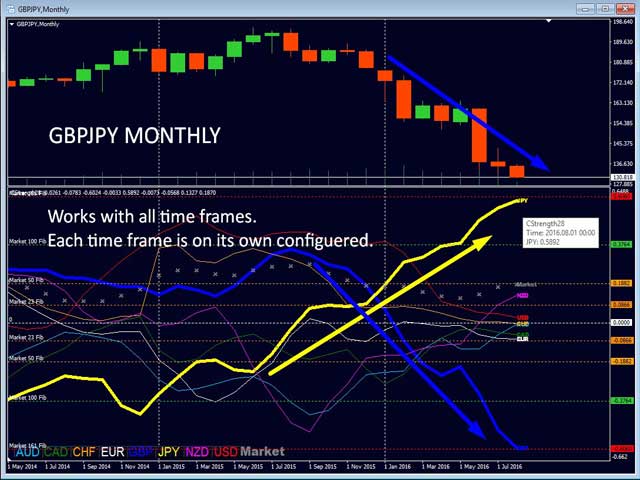
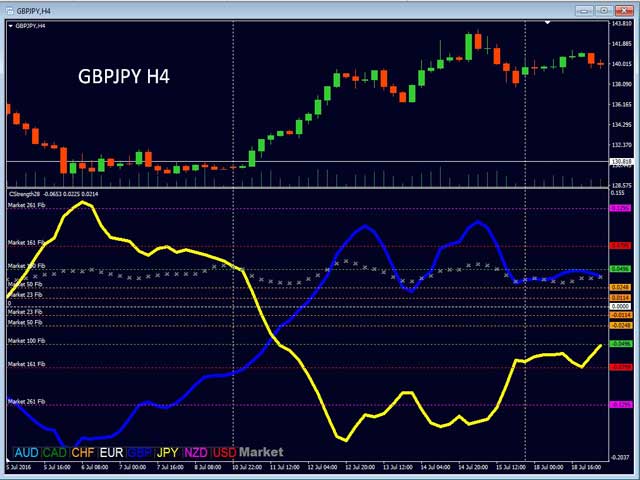
複数の時間枠を選択可能で、トレンドを素早く確認できます。通貨強度のラインはすべての時間枠で非常にスムーズで、高い時間枠で一般的なトレンドを確認し、短い時間枠で正確なエントリーをピンポイントで行う際に、見事に機能します。どの時間枠も自由に選択することができます。すべての時間枠はそれ自体で最適化されています。
新しい基本的なアルゴリズムに基づいて構築されているため、潜在的な取引の特定と確認がさらに容易になります。なぜなら、通貨の強さや弱さが増しているかどうか、過去にどのようなパフォーマンスを示したかをグラフィカルに表示するからです。これらの機能は、強い通貨と弱い通貨を識別するだけでなく、いつ取引し、いつ取引しないか、いつ利益を取るかを示すことを容易にするために設計されたものです。
Advanced Currency Strength28 Indicatorは、28の通貨ペア全てに対応しています。これは新しい方式で、非常に新しい機能は、マーケットモメンタムと現在の市場活動に適応するダイナミックなマーケットフィボナッチレベルです。マーケット・モメンタムは9番目のラインです。これは、FX取引において大きな利点であり、新しいものです。マーケットモメンタムやダイナミックマーケットフィボナッチなどの独自の機能の使い方を学べば、トレンドに乗った取引をしたいのか、トレンドの継続を探すのか、それともプルバックを探すのかを見分けることができるようになるはずです。
すべてのグラフィックは、過去のダイナミックマーケットフィボナッチレベルを表す新しいバッファーをベースにしています。
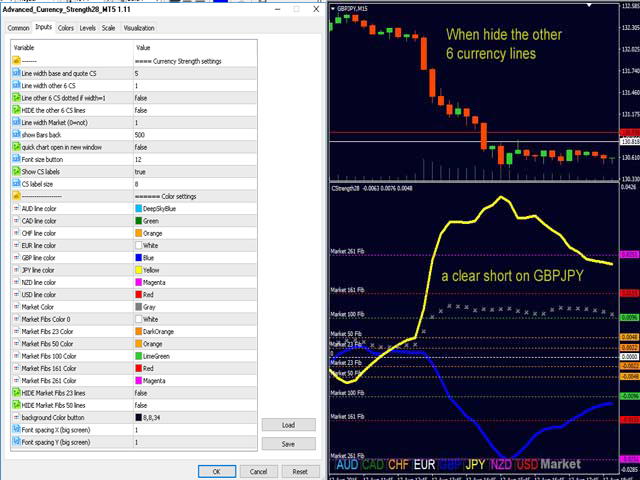
インジケーターパラメーター
全リストを見るには、ここをクリックしてください。https://www.mql5.com/en/blogs/post/697384
=== チャート設定
=== アラート設定
=== アラート設定 CSクロス
ヒント
- 私のテンプレートを使ってください。マニュアル参照 https://www.mql5.com/en/blogs/post/697384
- インジケータを中断したくない場合は、"open chart in new window "を使用してください。
- 上位の時間軸のトレンド(通貨GAP)内にとどまる。
- 取引セットアップとして、通貨のダブル GAP を探してください。
- 特別仕様:MT4のチャート履歴を更新するために、7つのサポートチャートが開かれます(マニュアル参照)。この機能は無効にすることができます。
- 取引システムと取引例については、プロフィールの私のニュースやブログをチェックしてください。
ご質問があれば、いつでもお手伝いします。
これからもたくさんのグリーンピップスをお願いします。
自動的に翻訳されます! 英語版オリジナルはこちら https://www.mql5.com/en/market/product/22324
you can not believe the author support and guidance i had too many questions and he answered every single of them i will using the indicator for 2 weeks in demo and after that ,if it was good i will go for live , i will update my honest review so you can judge your self , thank you bernhard for your patience and good support
update:
28/3/2024 ive test it in many ways and if you learn the full tutorial and master it you will have good profit , this indicator does everything that author claim and works best with impulse , with cs28 you can understand which pair is good for trade at the moment and impulse shows you if the pair is going to move or not