Double Top Scanner Multi Pair And Multi Time Frame
- インディケータ
- ScorpionFX
- バージョン: 4.27
- アップデート済み: 27 11月 2021
- アクティベーション: 20
Ultimate Double Top Scanner (Multi Pair And Multi Time Frame):
---LIMITED TIME OFFER: NEXT 25 CLIENTS ONLY
---46% OFF REGULAR PRICE AND 2 FREE BONUSES
---SEE BELOW FOR FULL DETAILS
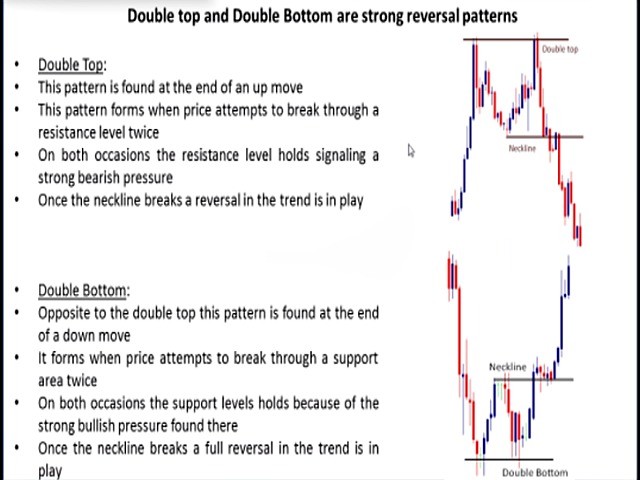
the large institutions. And a strong double top pattern is a clear indication of institutional interest.
your trades within strictly defined levels (entries, exits, take profits and stop losses). And these patterns
also provide an excellent risk and reward ratio.
This means you already know your predefined risks going into your trades. And your potential wins willalways be considerably larger than your potential losses. Making these trades mathematically viable
under most institutional level risk parameters.
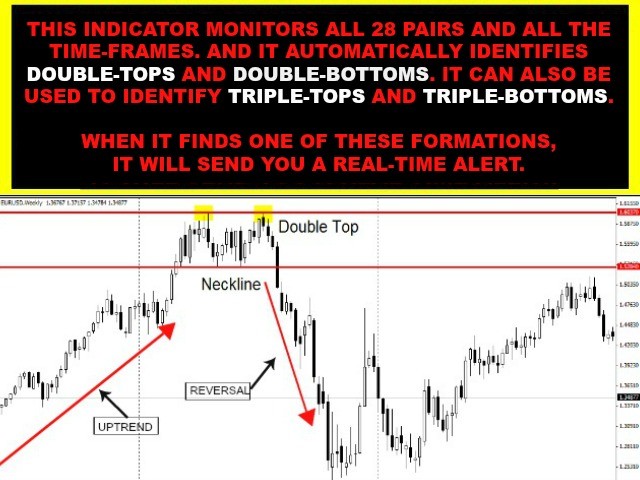
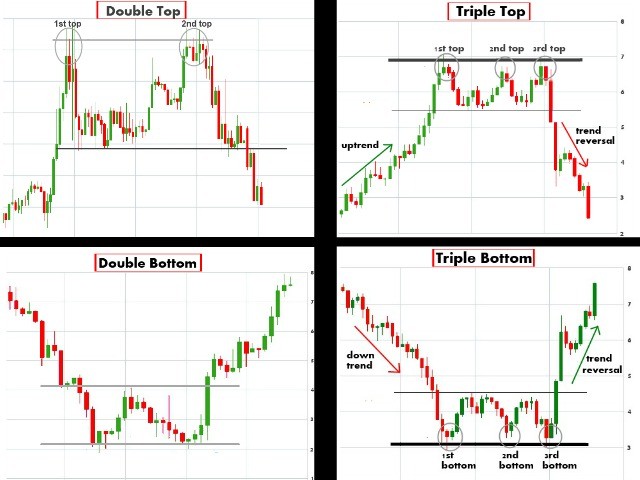
As it monitors the entire market and automatically identifies high probability double top patterns.
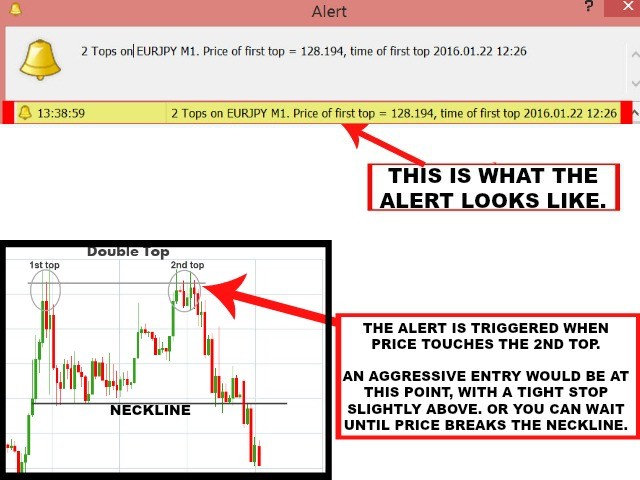
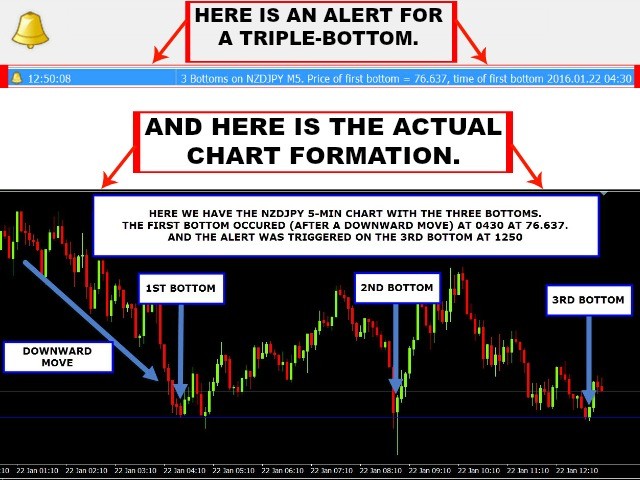
And when it finds one of these patterns, the indicator will send you an alert. Allowing you to be
fully prepared to take advantage of the potential upcoming reversal.
in order to help filter out false signals. And identify formations that occur at the top (or bottom) of a trend.
PLEASE NOTE:
And you can see that it has numerous excellent reviews from previous clients.
You can click on this link for further reference:
https://www.mql5.com/en/market/product/14186#!tab=reviews
Features:
- This indicator can monitor all 28 pairs at the same time.
- It can monitor every timeframe, from 1 Minute to Monthly. All at the same time.
- It will automatically trigger an alert whenever the appropriate pattern is identified.
- It can monitor any symbol in your Metatrader platform. Including crypto, commodities, indices, equities, ETF's etc.
- This indicator only needs to be placed on one chart and it will simultaneously monitor the entire market, all on one screen.
This will save you an enormous amount of time and effort. As you won't have to flip through dozens of charts for analysis.
And this will allow you to focus on other aspects of your trading. Such as further technical (or fundamental analysis).
This will also give you more time to find other trading opportunities.
Click HERE for the users guide for this indicator.
Including an overview of the benefits, features and parameters.
LIMITED TIME OFFER: 2 FREE BONUSES!
FREE BONUS # 1: BUY ONE GET ONE FREE
With the purchase of any of our indicators, you can select an additional indicator of your choice, absolutely free.And there is no limit to the number of bonus indicators that you can receive.
FREE BONUS # 2: RECEIVE BOTH VERSIONS OF YOUR NEW INDICATOR (MT4 AND MT5)
With the purchase of any of our indicators, you will receive both versions of your new indicator, absolutely free.This means you will receive (both) the file for MT4 and the file for MT5. Allowing you to use your new indicator
on the Metatrader platform of your choice. At no additional cost.
immediately after your purchase. So that we can send you everything you need as soon as possible.
You will receive your TWO FREE BONSUSES, as well as important information for using your new indicators.Including advice for the best settings to use, best pairs to trade, best strategies, best time frames and more.
Including critical information for improving your trading skills. And advancing your long-term development.
*****DON'T WASTE YOUR TIME OR MONEY WITH AMATEURS.*****
Anybody can create an indicator with blinking lights and silly lines.
But very few people know how to actually trade the market.
We have almost 30 years of institutional experience.
And we have the performance record to back it up.
1) We have been in business since 1995. And have almost 30 years of institutional experience in the foreign exchange industry.
2) We own the Guinness World Record for the most consecutive winning trades in a row (1,426 consecutive wins).
3) We are (by far) the largest, most qualified and most experienced vendor on this platform.
And our indicators are currently being used by well over 50,000 traders globally.
5) Our indicators have received hundreds of 5 star reviews on this platform alone.And most importantly, we are proud to say that all of our reviews are 100% GENUINE.
With absolutely no questionable tactics or client manipulation of any kind.
If you would like further details regarding our qualifications and our background, please take a look
at our profile link HERE. And this will provide a better understanding of our overall trading experience
and our approach to the market.
WE OFFER INDICATORS FOR ALMOST ANY TRADING STYLE AND APPROACH:
Our indicators are easy to use, flexible and can be used to complement almost any trading style.
Whether you are a scalper, swing trader, range trader, trend trader, news trader etc.
All of our indicators have been designed through the lens of institutional trading approaches.
And we focus specifically on clean designs and ultimate convenience with all of our indicators.
Our indicators will never clutter your screen with unnecessary data or distractions.
And when using our indicators, you won't need to follow endless rules or instructions.
Best of all, our indicators can simultaneously monitor all pairs and all time frames.
All from one screen. And our indicators will do all of the hard work of finding the best
possible trades for you. Anywhere across the entire market.
If you would like to see all of the indicators that we offer, please click HERE.
WE ARE ALWAYS AVAILABLE TO HELP:
We reply to all messages within 24 hours. And depending on the total volume of messages
that we have, we can sometimes reply in less than 1 hour. Even on weekends and holidays.
Thanks again and we look forward to working with you soon.
Respectfully,
ScorpionFX


Awesome indicator does as intended !
If you know how to trade this will defiantly be a tool you'll need if your strategy is based of double tops/triple tops
Awesome customer service from the team would defiantly recommend.