• 概要
  • レビュー (6)
  • コメント (3)
  • 最新情報

SSA Stochastic Limited Edition

4.25

An analogue of the Stochastic oscillator based on algorithms of singular spectrum analysis (SSA)

SSA is an effective method to handle non-stationary time series with unknown internal structure. It is used for determining the main components (trend, seasonal and wave fluctuations), smoothing and noise reduction. The method allows finding previously unknown series periods and make forecasts on the basis of the detected periodic patterns.

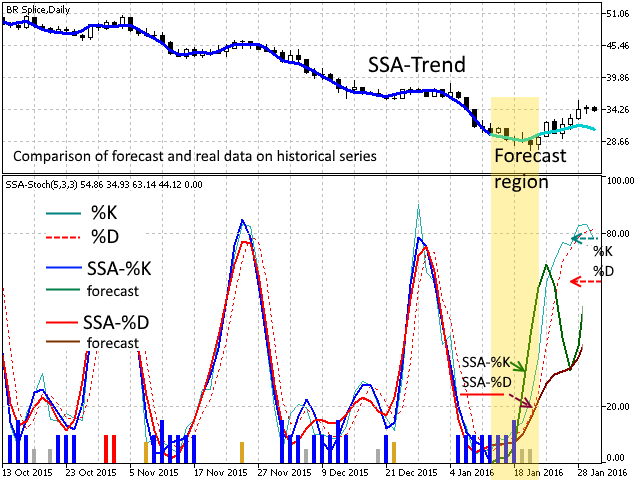
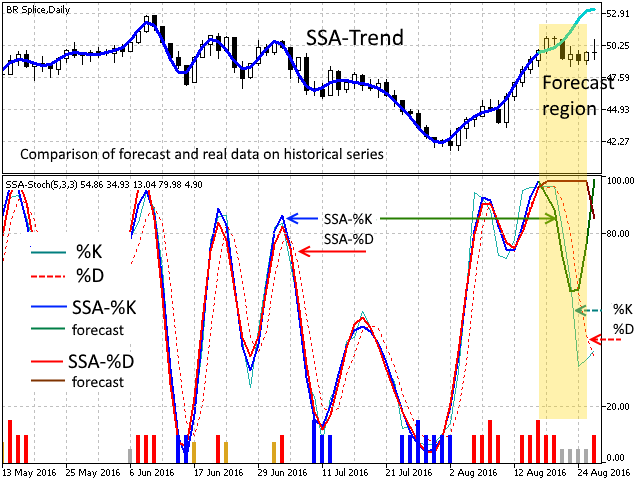
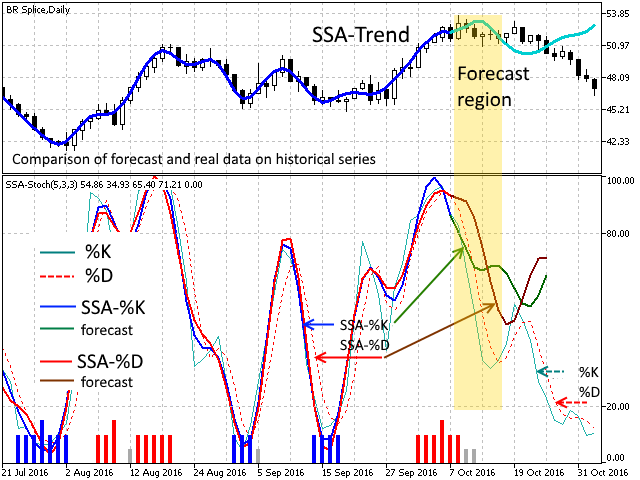
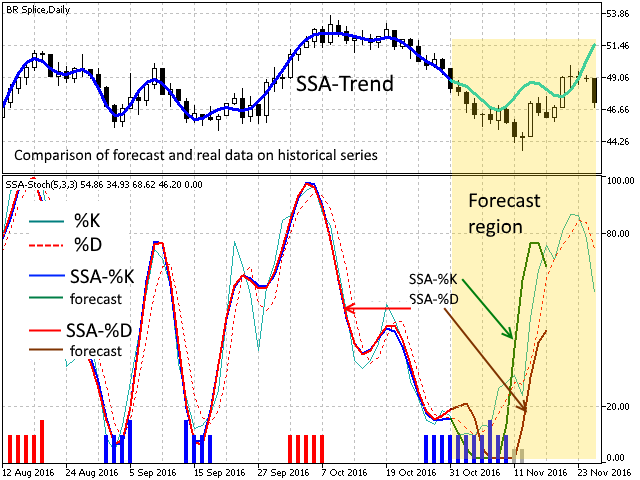
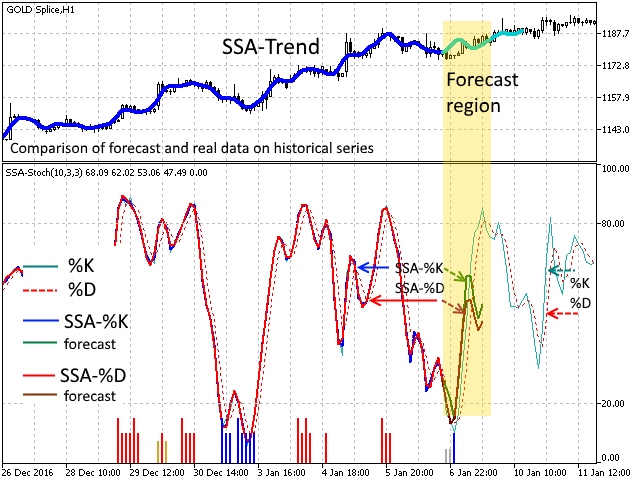
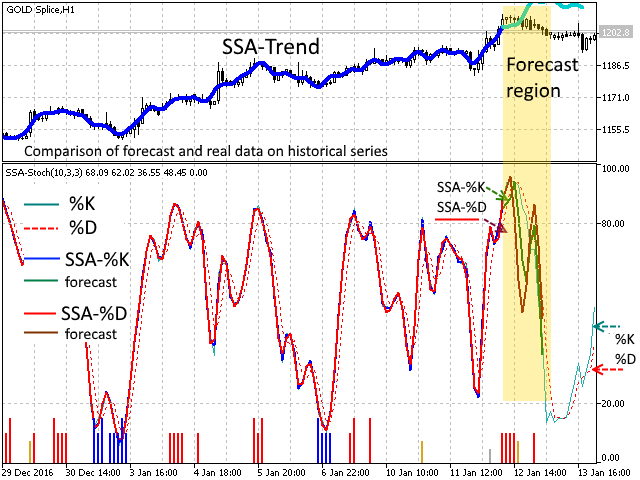
Indicator signals are identical to signals of the original indicator, but have an important advantage - no time delay with respect to the price dynamics and more accurately and synchronously reflect the variability of the price series behavior. This is achieved by the fact that the "SSA-% D" signal is generated not by a moving average, but by a low-pass filtering using the SSA algorithm. Accordingly, this indicator has solved the problem of lagging.

Adjustable noise filtering allows to significantly reduce the number of false signals, that are typical for the original indicator.

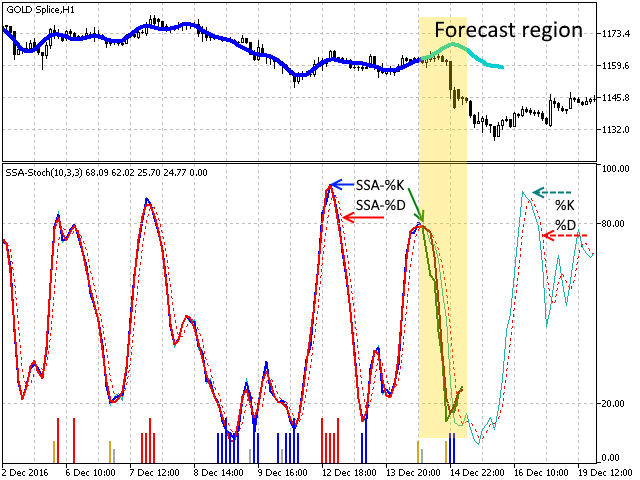
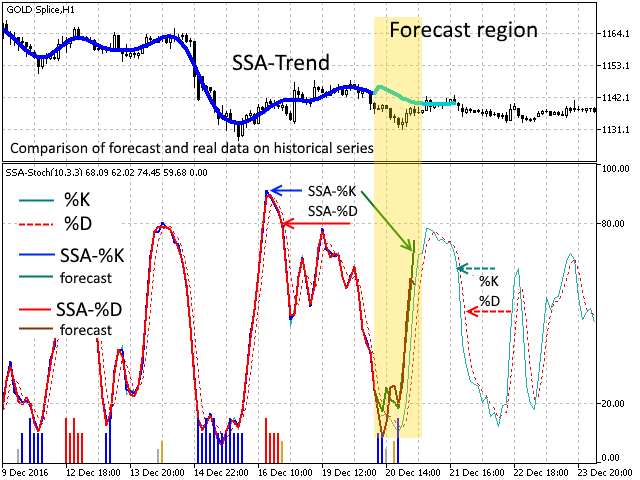
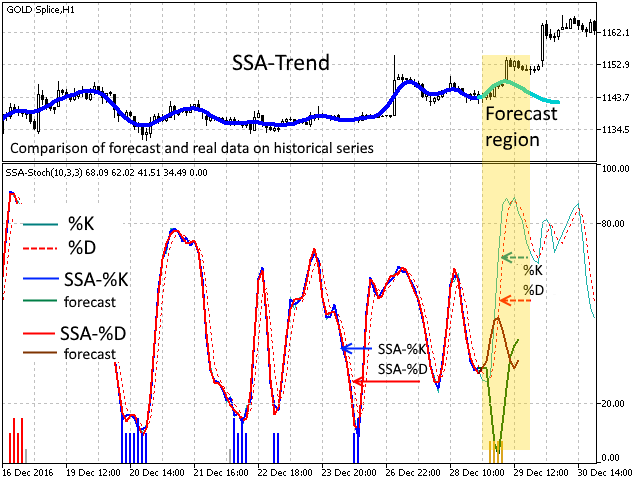
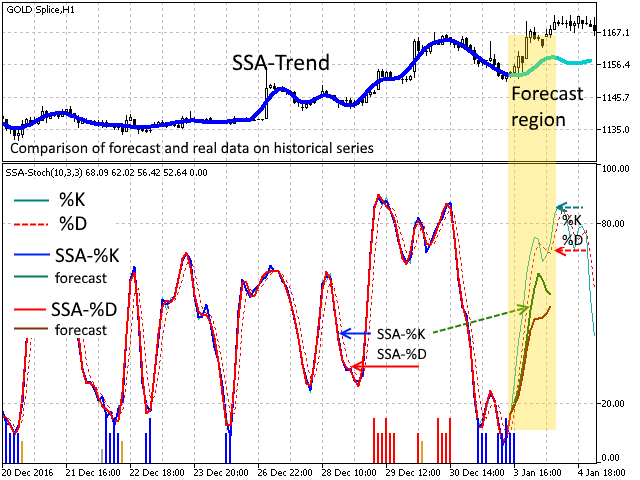
The resulting forecast for the identified "SSA-%K" and "SSA-%D" price fluctuations takes into account the aggregate analysis of various detected factors, which form the "wave" behavior of the price series, and it can be used to reduce risks in a strategy.

The characteristic behavior, as well as the signals and interpretation of the indicator correspond to the same properties of the Stochastic oscillator.

For the convenience of the user, the original "%K" and "%D", as well as the upgraded "SSA-%K" and "SSA-%D" estimations are provided.

The "Limited" version contains certain limitations in the parameter settings and indicator control.


Parameters

  1. K period — observation period
  2. D period — smoothing period
  3. Slowing — period of repeated smoothing
  4. Algorithm – forecast method
  5. N: Data fragment – fragment of the %K series for the analysis
  6. Time-dependent lag - window of history "influence" on the value at point
  7. %K high-frequency limit — noise filtering parameter for processing "%K".
  8. %D frequency limit — smoothing and filtering method for plotting "%D".
  9. Forecast smoothing — smoothing/regularization of the forecast
  10. Recalculate period — indicator refresh interval
  11. Predictable Points — the number of forecast points.
  12. BackwardShift — a shift of the analyzed fragment deeper into the history. Configuration of the model and forecast based on known data.
  13. VISUAL OPTIONS — color settings of the "SSA-%K" and "SSA-%D" graphs.
  14. INTERFACE/Magic Number — identifier to use the indicator as a part of an expert


Explanation to setting the parameters

High frequency limit determines the level of filtering and suppressing the "high-frequency noise" contribution to data. All oscillations with contribution not exceeding this level will be filtered out.

BackwardShift is designed for adjusting the indicator to a specific price series. By setting the shift, it is possible to compare the forecast with the indicator data and to select the indicator parameters.

Forecast smoothing allows to smooth the forecast results by suppressing the "spikes" or by using the "weight coefficients", taking the significance of the previous results into account.

NOTE: If you select the "weight coefficients" method for smoothing the forecast, four estimations of forecast values are computed in the first step of indicator calculation in order to initialize the smoothing stack.

Therefore, the first step requires more computing time. It is not required in the next steps.

Magic Number. The indicator results can be included in an expert by requesting buffers 8 ("%K"-original), 9 ("%D"-original), 10 ("SSA-%K") and 11 ("SSA-%D").

レビュー 6
Aleksandr Sosnovskiy
2362
Aleksandr Sosnovskiy 2021.06.26 00:04 
 

Очень интересный индикатор. Хорошее дополнение к стратегии типа Price Action или VSA.

おすすめのプロダクト
SSACD - Singular Spectrum Average Convergence/Divergence This is an analogue of the MACD indicator based on the Caterpillar-SSA ( Singular Spectrum Analysis ) method. Limited version of the SSACD Forecast indicator. Limitations include the set of parameters and their range. Specificity of the method The Caterpillar-SSA is an effective method to handle non-stationary time series with unknown internal structure. The method allows to find the previously unknown periodicities of the series and mak
FREE
SSA Trend Predictor
Roman Korotchenko
4.25 (4)
This indicator extracts a trend from a price series and forecasts its further development. Algorithm is based on modern technique of Singular Spectral Analysis ( SSA ). SSA is used for extracting the main components (trend, seasonal and wave fluctuations), smoothing and eliminating noise. It does not require the series to be stationary, as well as the information on presence of periodic components and their periods. It can be applied both for trend and for another indicators. Features of the m
FREE
The indicator is based on Robert Miner's methodology described in his book "High probability trading strategies" and displays signals along with momentum of 2 timeframes. A Stochastic oscillator is used as a momentum indicator. The settings speak for themselves period_1 is the current timeframe, 'current' period_2 is indicated - the senior timeframe is 4 or 5 times larger than the current one. For example, if the current one is 5 minutes, then the older one will be 20 minutes The rest of the
FREE
About the indicator: DALA Forecast is a universal tool for predicting the dynamics of time series of any nature. For prediction, modified methods of nonlinear dynamics analysis are used, on the basis of which a predictive model is built using machine learning methods.  To get the trial version of the indicator, you can contact me in private messages. How to use the indicator: Apply the indicator to your chosen financial instrument or indicator with the settings you need. The prediction will b
FREE
Follow The Line MT5
Oliver Gideon Amofa Appiah
4.42 (31)
This indicator obeys the popular maxim that: "THE TREND IS YOUR FRIEND" It paints a GREEN line for BUY and also paints a RED line for SELL. (you can change the colors). It gives alarms and alerts of all kinds. IT DOES NOT REPAINT and can be used for all currency pairs and timeframes. Yes, as easy and simple as that. Even a newbie can use it to make great and reliable trades. NB: For best results, get my other premium indicators for more powerful and reliable signals. Get them here: https://www.m
FREE
Donchian Channel DC is the indicator of Donchian Channels, that plots maximum and minimum values of a specific period, besides mean value line. It´s possible to configure simple period for analysis and the indicator will plot all three values. You can trade with this indicator as trend or reversal, according to each strategy. Do not let to test others indicators as soon as others expert advisors.
We have all seen a currency pair enter the overbought or oversold territory and stay there for long periods of time. What this indicator does is gives you the emphasis. So if you are looking for reversals then you may want to take notice when oversold territory is entered into with a bullish engulfing candle or if the trend is your thing then check for bearish engulfing candles while entering oversold. This indicator will show a downward arrow when it detects a bearish engulfing candle while cro
FREE
Multi-timeframe trend indicator based on the ADX / ADXWilder indicator with Fibonacci levels The indicator shows trend areas using ADX or ADXWilder indicator data from multiple timeframes. The impulse mode of the indicator allows you to catch the beginning of a trend, and several "Screens" with different timeframes allow you to filter out market noise. Fibonacci levels are added to the price chart, which have flexible settings. How the indicator works: if PDI is greater than NDI, then   it`
FREE
Tunnel Warrens MT5
Dariel Iserne Carrera
4 (1)
This is MT5 version Get Tunnel Warrens MT4 here Here are several indicators that work together. It basically works with moving averages and various levels of ATR creating a dynamic channel through which the price is drained. As I always recommend, you should try it before using it in live so that you understand how it works. The market entry signal is similar to other MA indicators, but with this one you also have a graphical analysis of the moment when the trend is found and dynamic levels to
FREE
Free automatic Fibonacci is an indicator that automatically plots a Fibonacci retracement based on the number of bars you select on the BarsToScan setting in the indicator. The Fibonacci is automatically updated in real time as new highest and lowest values appears amongst the selected bars. You can select which level values to be displayed in the indicator settings. You can also select the color of the levels thus enabling the trader to be able to attach the indicator several times with differe
FREE
SUPERTREND; It is a trend following indicator based on the SuperTrend ATR created by Olivier Seban. It can be used to detect changes in trend direction and locate stops. When the price falls below the indicator curve, it turns red and indicates a downtrend. Conversely, when the price moves above the curve, the indicator turns green, indicating an uptrend. Like other indicators, it works well on SuperTrend when used in conjunction with other indicators such as MACD, parabolik SAR, Bollinger Band
FREE
Trend indicator based on the ADX / ADXWilder indicator The indicator shows trend areas using ADX or ADXWilder indicator data. How the indicator works: if PDI is greater than NDI, then it`s bullish movement; if PDI is less than NDI, then it`s bearish movement; if ADX is less than or equal to the filter value specified in the parameters, then there is no movement state. Input parameters of the indicator: Calculate Timeframe - timeframe for calculation; ADX Type - type of ADX calculation
FREE
This indicator displays buy or sell signals according to Bill Williams' definition of the Trading Zone. [ Installation Guide | Update Guide | Troubleshooting | FAQ | All Products ] Easy to use and understand Avoid trading flat markets Deterministic indicator with clear rules The indicator is non-repainting It implements alerts of all kinds It has straightforward trading implications. A blue arrow is a buy signal A red arrow is a sell signal According to Bill Williams trading in the zone helps t
FREE
A personal implementation of the famous Bollinger bands indicator as a trend following mechanism, which uses a moving average and the standard deviation to define what a trend is and when it changes. Bollinger bands are usually used as an oversold/overbought indicator only, but in my opinion, the trading approach is more complete using the trend variant as an exit strategy. [ Installation Guide | Update Guide | Troubleshooting | FAQ | All Products ] Easy to trade Customizable colors and sizes I
FREE
This indicator is an automated version of the Fibonacci retracement (Fib) indicator. Deciding the best areas to use when drawing the fib can be tricky and this  indicator was made with that in mind. When you drop it on the chart it will automatically choose the best points to draw the fib with, but in case you aren't satisfied with those regions, you can adjust it as you wish.
FREE
Stochastic RSI makes a stochastic calculation on the RSI indicator. The Relative Strength Index (RSI) is a well known momentum oscillator that measures the speed and change of price movements, developed by J. Welles Wilder. Features Find overbought and oversold situations. Sound alert when overbought/oversold level is reached. Get email and/or push notification alerts when a signal is detected. The indicator is non-repainting. Returns buffer values for %K and %D to be used as part of an EA. (s
FREE
Are you tired of drawing trendlines every time you're analyzing charts? Or perhaps you would like more consistency in your technical analysis. Then this is for you. This indicator will draw trend lines automatically when dropped on a chart. How it works Works similar to standard deviation channel found on mt4 and mt5. It has 2 parameters: 1. Starting Bar 2. Number of bars for calculation The   starting bar   is the bar which drawing of the trend lines will begin, while the   number of bars for c
FREE
What is this indicator? このインジケーターはMT5のFX検証ソフト「 Knots Compositor 」の 全てのチャートモードに対応したMACD です。 どのチャートモードでも、 チャートに表示されているローソク足で計算して表示します 。 Types of the applied price - Close - Open - High - Low - Median Price (HL/2) - Typical Price (HLC/3) - Weighted Price (HLCC/4) KC-Indicators -   KC-MA   (移動平均線) -   KC-ENV   (エンベロープ) -   KC-BB   (ボリンジャーバンド) -   KC-ADX   (Average Directional Movement Index) -   KC-MACD   (Moving Average Convergence/Divergence) -   KC-RSI   (Relative Strength Index) -   KC-S
FREE
このインディケータは、相場の反転ポイントを予測する最もポピュラーなハーモニックパターンを識別します。これらのハーモニックパターンは、外国為替市場で常に繰り返され ている価格形成であり、将来起こりうる値動きを示唆します。/     MT4無料バージョン さらに、このインジケーターには、市場エントリーシグナルと、様々な利食いと損切りが組み込まれています。ハーモニック・パターン・インディケータは、それ自体で売買シグナルを発 信することができますが、他のテクニカル・インディケータを使用してこれらの シグナルを確認することをお勧めします。例えば、RSIやMACDなどのオシレーターを使用して、トレンドの方向性やモメンタ ムの強さを確認してから売買を行うことを検討するとよいでしょう。 このインディケータのダッシュボードスキャナ: ( Basic Harmonic Patterns Dashboard ) 含まれるハーモニックパターン ガートレー バタフライ バット カニ サメ サイファー ABCD 主な入力 Max allowed deviation (%):   このパラ
FREE
A top-quality implementation of the famous Super Trend indicator, which needs no introduction. It is completely loyal to the original algorithm, and implements many other useful features such as a multi-timeframe dashboard.  [ Installation Guide | Update Guide | Troubleshooting | FAQ | All Products ] Easy to trade It implements alerts of all kinds It implements a multi-timeframe dashboard It is non-repainting and non-backpainting Input Parameters ATR Period - This is the average true range per
FREE
BeST_Oscillators Collection is a Composite MT5 Indicato r including the Chaikin ,  Chande and TRIX Oscillators from which by default Chaikin and TRIX Oscillators but not Chande Momentum Oscillator are contained in MT5 platform. It also provides for each Oscillator the option of displaying or not a Mov. Average as a  Signal Line and the resulting Signals as Arrows in a Normal (all arrows) or in a Reverse Mode (without showing up any resulting successive and of same type arrows). Analytically f
FREE
The indicator identifies when a divergence occurs between price and an indicator or oscillator. It identifies both regular and hidden divergences. Combined with your own rules and techniques, this indicator will allow you to create (or enhance) your own powerful system. Features Can detect divergences for the following oscillators/indicators:   MACD, OsMA, Stochastics, RSI, CCI, RVI, Awesome, ADX, ATR, OBV, Composite index, MFI and Momentum. Only one oscillator/indicator can be selected. Draws
FREE
ToolBot   Probabilistic Analysis -  FREE   An effective indicator for your negotiations The toolbot indicator brings the calculation of candles and a probabilistic analysis so that you have more security on your own. Also test our   FREE   tops and bottoms indicator: :    https://www.mql5.com/pt/market/product/52385#description Also test our   FREE   (RSI, ATR, ADX, OBV)  indicator :    https://www.mql5.com/pt/market/product/53448#description Try our EA ToolBot for free:   https://www.mql
FREE
This indicator is based on the Heiken Ashi indicator. It helps the user identifying whether to buy or sell. It comes with an alert that will sound whenever a new signal appears. It also features an email facility. Your email address and SMTP Server settings should be specified in the settings window of the "Mailbox" tab in your MetaTrader 5. Blue arrow up = Buy. Red arrow down = Sell. Line = Trailing Stop. You can use one of my Trailing Stop products that automatically move the Stop Loss and inc
FREE
Super Fractals
Aurthur Musendame
5 (4)
Think of the Super Fractal Indicator as the Bill WIlliams Indicator on Steroids. Indicator Abilities: 1. Adjust Candle around Fractal High or Low. 2. Adjust Lookback period and only plot for a specific number of history candles avoiding cluttering your trading desk. 3. The Indicator uses buffers so you call and use it from any EA. Note : The higher the candles around Fractal, the stronger the Turning point anfd viceversa is true.
FREE
RSI magic kjuta trial is the demo version of RSI magic kjuta. Custom Indicator (RSI magic kjuta) based on the standard   (Relative Strength Index, RSI) with additional settings and functions. The maximum and minimum RSI lines on the chart have been added to the standard RSI line. Now you can visually observe the past highs and lows of RSI, and not only the values of the closing bars, which avoids confusion in the analysis of trades. For example, the EA opened or closed an order, but the RSI l
FREE
This is a smooth and responsive accelerometer which reveals the market trend and strength. [ Installation Guide | Update Guide | Troubleshooting | FAQ | All Products ] Two moving averages indicate trend direction The histogram represents strength of the price movement It draws buy and sell zones as colored vertical lines Should be used as a confirmation indicator Customizable line widths and colors It implements alerts of all kinds This indicator is similar to MACD but aims to react faster t
FREE
HighLow MT5
Azamat Mullayanov
4.2 (5)
The indicator plots two lines by High and Low prices. The lines comply with certain criteria. The blue line is for buy. The red one is for sell. The entry signal - the bar opens above\below the lines. The indicator works on all currency pairs and time frames It can be used either as a ready-made trading system or as an additional signal for a custom trading strategy. There are no input parameters. Like with any signal indicator, it is very difficult to use the product during flat movements. You
FREE
供給と需要のオーダーブロック: 「供給と需要のオーダーブロック」インジケーターは、外国為替のテクニカル分析において重要なスマートマネーの概念に基づいた洗練されたツールです。このツールは供給と需要ゾーンを特定し、機関投資家が重要な足跡を残す重要な領域に焦点を当てています。売り注文を示す供給ゾーンと買い注文を示す需要ゾーンは、トレーダーが価格の逆転や減速を予測するのに役立ちます。このインジケーターは、ブレイクアウト・オブ・ストラクチャー(BoS)およびフェアバリューギャップ(FVG)のコンポーネントを組み合わせた賢明なアルゴリズムを採用しています。BoSは市場の混乱を検出し、潜在的なオーダーブロックを特定し、FVGは精度を向上させるためにフェアバリューギャップを考慮しています。このツールはこれらの条件の視覚的表現を提供し、潜在的なオーダーブロックを強調し、市場のダイナミクスや転換点に関する洞察を提供することで、トレーダーの意思決定を支援します。使いやすいデザインは、さまざまな技術的な専門知識レベルのトレーダーにアクセスしやすく、高度な分析の包括的なソリューションを提供します。 特
FREE
This indicator finds Three Drives patterns. The Three Drives pattern is a 6-point reversal pattern characterised by a series of higher highs or lower lows that complete at a 127% or 161.8% Fibonacci extension. It signals that the market is exhausted and a reversal can happen. [ Installation Guide | Update Guide | Troubleshooting | FAQ | All Products ] Customizable pattern sizes Customizable colors and sizes Customizable breakout periods Customizable 1-2-3 and 0-A-B ratios It implements visua
FREE
このプロダクトを購入した人は以下も購入しています
まず第一に、この取引インジケーターは再描画されず、再描画されず、遅延しないことを強調する価値があります。これにより、手動取引とロボット取引の両方に理想的なものになります。 アトミックアナリストは、価格の強さとモメンタムを利用して市場でより良いエッジを見つけるためのPA価格アクションインジケーターです。ノイズや誤ったシグナルを除去し、取引ポテンシャルを高めるための高度なフィルターを備えています。複雑なインジケーターの複数のレイヤーを使用して、アトミックアナリストはチャートをスキャンし、複雑な数学的計算をシンプルなシグナルと色に変換します。これにより、どのような初心者トレーダーでも理解して使用し、一貫した取引の決定を行うことができます。 「アトミックアナリスト」は、新規および経験豊富なトレーダー向けにカスタマイズされた包括的な取引ソリューションです。プレミアムインジケーターとトップノッチの機能を1つの取引戦略に組み合わせ、すべてのタイプのトレーダーにとって汎用性のある選択肢にします。 デイリートレーディングとスキャルピング戦略:高速で正確なデイトレーディングおよび短期トレード
まず第一に、このトレーディングシステムがノンリペイント、ノンリドロー、ノンラグのインジケーターであることを強調する価値がある。これにより、手動取引とロボット取引の両方に理想的なものになっています。 「スマートトレンドトレーディングシステム MT5」は、新規および経験豊富なトレーダー向けにカスタマイズされた包括的なトレーディングソリューションです。10以上のプレミアムインジケーターを組み合わせ、7つ以上の堅実なトレーディング戦略を備えており、多様な市場状況に対応する多目的な選択肢となっています。 トレンドフォロー戦略:トレンドを効果的に乗り越えるための正確なエントリーとストップロス管理を提供します。 リバーサル戦略:潜在的なトレンドの反転を特定し、トレーダーがレンジ相場を活用できるようにします。 スキャルピング戦略:高速で正確なデイトレードおよび短期取引のために設計されています。 安定性:すべてのインジケーターはノンリペイント、ノンリドロー、ノンラグであり、信頼性の高いシグナルを保証します。 カスタマイズ:個々の取引の嗜好に合わせたカスタム戦略をサポートします。7つ以上の戦略と組み合わせ
ご紹介   クォンタム トレンド スナイパー インジケーターは 、トレンド反転を特定して取引する方法を変革する画期的な MQL5 インジケーターです。 13年以上の取引経験を持つ経験豊富なトレーダーのチームによって開発されました。     クォンタムトレンドスナイパーインジケーター   は、非常に高い精度でトレンドの反転を識別する革新的な方法で、あなたのトレーディングの旅を新たな高みに押し上げるように設計されています。 ***Quantum Trend Sniper Indicatorを購入すると、Quantum Breakout Indicatorを無料で入手できます!*** クォンタム ブレイクアウト インジケーターは、トレンドの反転を特定するとアラートを発し、矢印を示し、3 つのテイクプロフィットレベルを提案します。 初心者トレーダーにもプロのトレーダーにも適しています。 量子EAチャネル:       ここをクリック MT4のバージョン:       ここをクリック 推奨事項: 期間:すべての時間枠。最良の結果を得るには、M
トレンド スクリーナー インジケーターでトレンド取引の力を解き放ちます。ファジー ロジックと複数通貨システムを活用した究極のトレンド取引ソリューションです。 ファジー ロジックを活用した革新的なトレンド インジケーターである Trend Screener を使用して、トレンド取引を向上させます。 これは、13 を超えるプレミアム ツールと機能、および 3 つの取引戦略を組み合わせた強力なトレンド追跡インジケーターであり、Metatrader をトレンド アナライザーにする多用途の選択肢となります。 期間限定オファー : トレンド スクリーナー インジケーターは、わずか 50 ドルで生涯ご利用いただけます。 (元の価格 125$ ) (オファー延長) Trend Screener の 100% 非再描画精度の揺るぎない精度を体験して、取引の決定が過去の価格変動の影響を受けないようにしてください。 マルチタイムフレームおよびマルチ通貨機能の多用途性を解放し、比類のない自信を持って外国為替、商品、暗号通貨、インデックスの世界を取引できるようにします。 Trend Screener の包括的な
Gold Stuff mt5
Vasiliy Strukov
4.88 (165)
Gold Stuff mt5 は、金専用に設計されたトレンド指標であり、あらゆる金融商品にも使用できます。 インジケーターは再描画せず、遅れません。 推奨時間枠 H1. 設定と個人的なボーナスを得るために、購入後すぐに私に連絡してください!   設定 矢印を描く - オンオフ。 チャートに矢印を描く。 アラート - 可聴アラートのオンオフ。 メール通知 - オンオフ。 電子メール通知。 プチ通知 - オンオフ。 プッシュ通知。 次に、色域を調整します。 Gold Stuff mt5 は、金専用に設計されたトレンド指標であり、あらゆる金融商品にも使用できます。 インジケーターは再描画せず、遅れません。 推奨時間枠 H1. 設定と個人的なボーナスを得るために、購入後すぐに私に連絡してください!   設定 矢印を描く - オンオフ。 チャートに矢印を描く。 アラート - 可聴アラートのオンオフ。 メール通知 - オンオフ。 電子メール通知。 プチ通知 - オンオフ。 プッシュ通知。 次に、色域を調整します。
FX Volume MT5
Daniel Stein
4.94 (17)
mql5と Telegramの モーニング・ブリーフィングで、詳細とスクリーンショットを含む毎日のマーケット・アップデートをご覧 ください! FX Volumeは、ブローカーの視点から市場のセンチメントをリアルに洞察する、最初で唯一の出来高インジケーターです。 ブローカーのような機関投資家が外国為替市場でどのようなポジションをとっているか、COTレポートよりもはるかに速く、素晴らしい洞察を提供します。 この情報をチャート上で直接見ることは、あなたの取引にとって真のゲームチェンジャーであり、画期的なソリューションです。 以下のようなユニークなマーケットデータ洞察から利益を得てください。 比率は 、通貨のロングポジションとショートポジションの比率をパーセントで表示します。 比率の変化は 、選択した期間内のロング比率とその変化率を表示します。 Volumes Totalは 、通貨の取引量(ロングとショート)の合計をロット単位で表示します。 Volumes Long :全通貨のロングポジションの取引量を表示します。 Volumes(ショート )は、全通貨のショートポジションの取引量を表示
mql5と Telegramの モーニング・ブリーフィングで、詳細とスクリーンショットを含む毎日のマーケット・アップデートをご覧 ください! FX Power MT5 NGは 、長年の人気を誇る通貨強度計FX Powerの次世代モデルです。 この次世代ストレングスメーターは何を提供するのでしょうか?初代FXパワーの魅力すべて プラス GOLD/XAUの強さ分析 より正確な計算結果 個別に設定可能な分析期間 カスタマイズ可能な計算上限値により、さらに優れたパフォーマンスを実現 もっと見たい人のための特別なマルチインスタンス設定 すべてのチャートでお好みの色を無限に設定可能 数え切れないほどの通知オプションにより、重要なことを見逃すことはありません。 Windows 11とmacOSのスタイルで角を丸くした新しいデザイン 魔法のように動くインジケーターパネル FXパワーの主な機能 すべての主要通貨の強さの完全な履歴 すべての時間枠における通貨の強さの履歴 すべてのブローカーとチャートで同一の計算結果 100%信頼できるリアルタイム計算 -> リペイントなし ドロップダウン・リストから
まず第一に、この取引ツールはノンリペイント、ノンリドロー、ノンラグの指標であり、プロの取引に理想的ですことを強調する価値があります。 スマートプライスアクションコンセプトインジケーターは、新米から経験豊富なトレーダーまで、非常 に強力なツールです。Inner Circle Trader AnalysisやSmart Money Concepts Trading Strategiesなど、20以上の有用な指標を1つに組み合わせています。このインジケーターはスマートマネーコンセプトに焦点を当て、大手機関の取引方法を提供し、彼らの動きを予測するのに役立ちます。 特に、流動性分析に優れており、機関がどのように取引しているかを理解しやすくしています。市場のトレンドを予測し、価格の動きを慎重に分析するのに優れています。機関の戦略とトレードを合わせることで、市場の動向についてより正確な予測ができます。このインジケーターは多目的であり、市場構造を分析し、重要な注文ブロックを特定し、さまざまなパターンを認識するのに優れています。 このインジケーターはBOSやCHoCHなどのパターンの識
現在33%オフ 初心者にもエキスパートトレーダーにも最適なソリューション このインジケーターは独自の機能と新しい公式を多数内蔵しており、ユニークで高品質かつ手頃な取引ツールです。このアップデートでは、2つの時間枠ゾーンを表示できるようになります。より長いTFだけでなく、チャートTFとより長いTF(ネストゾーンを表示)の両方を表示できます。すべてのSupply Demandトレーダーの皆さんのお気に召すはずです。:) 重要情報の公開 Advanced Supply Demandの可能性を最大化するには、 https://www.mql5.com/ja/blogs/post/720245 にアクセスしてください。   エントリーまたはターゲットの正確なトリガーポイントを正確に特定できれば取引がどのように改善されるか想像してみてください。新しい基盤となるアルゴリズムに基づいて構築されているため、買い手と売り手の間の潜在的な不均衡をさらに簡単に特定できます。これは、最も強い需要と供給のゾーンと、過去のパフォーマンス(古いゾーンを表示)がグラフィカルに表現されるためです。これらの機能は、最適
今、147ドル(いくつかの更新後に499ドルに増加します) - 無制限のアカウント(PCSまたはMac) RelicusRoad ユーザー マニュアル + トレーニング ビデオ + プライベート Discord グループへのアクセス + VIP ステータス 市場の新しい見方 RelicusRoad は、外国為替、先物、暗号通貨、株式、および指数の世界で最も強力な取引インジケーターであり、トレーダーに収益を維持するために必要なすべての情報とツールを提供します。初心者から上級者まで、すべてのトレーダーが成功するためのテクニカル分析と取引計画を提供します。これは、将来の市場を予測するのに十分な情報を提供する重要な取引指標です。意味をなさないチャート上のいくつかの異なる指標ではなく、完全な解決策を信じています.これは、信号、矢印 + 価格アクション情報を表示するオールインワンのインジケーターで、他に類を見ない非常に正確です。 強力な AI に基づいて、RelicusRoad は不足している情報とツールを提供して、あなたを教育し、トレーディングのプロ、成功したトレーダーにします。
Step into the realm of Forex trading with confidence and precision using XQ, a cutting-edge Forex indicator designed to elevate your trading game to unprecedented heights. Whether you're a seasoned trader or just stepping into the world of currency exchange, XQ Forex Indicator empowers you with the insights and signals needed to make informed trading decisions. The signal conditions are a combination of three indicators, and XQ Forex Indicator only display  medium and long-term trends . The ind
The Volume by Price Indicator for MetaTrader 5 features Volume Profile and Market Profile TPO (Time Price Opportunity). Get valuable insights out of currencies, equities and commodities data. Gain an edge trading financial markets. Volume and TPO histogram bar and line charts. Volume Footprint charts. TPO letter and block marker charts including split structures. Versatile segmentation and compositing methods. Static, dynamic and flexible ranges with relative and/or absolute visualizations. Lay
ご紹介     Quantum Breakout PRO は 、ブレイクアウト ゾーンの取引方法を変革する画期的な MQL5 インジケーターです。 13年以上の取引経験を持つ経験豊富なトレーダーのチームによって開発されました。     クォンタム ブレイクアウト プロ   は、革新的でダイナミックなブレイクアウト ゾーン戦略により、あなたのトレーディングの旅を新たな高みに押し上げるように設計されています。 クォンタム ブレイクアウト インジケーターは、5 つの利益ターゲット ゾーンを備えたブレイクアウト ゾーン上のシグナル矢印と、ブレイクアウト ボックスに基づいたストップロスの提案を提供します。 初心者トレーダーにもプロのトレーダーにも適しています。 量子EAチャネル:       ここをクリック 重要!購入後、インストールマニュアルを受け取るためにプライベートメッセージを送ってください。 推奨事項: 時間枠: M15 通貨ペア: GBPJPY、EURJPY、USDJPY、NZDUSD、XAUUSD アカウントの種類: ECN、Raw、またはス
これはMT5のインジケーターで、再描画なしで取引に参入するための正確なシグナルを提供します。 外国為替、暗号通貨、金属、株式、インデックスなど、あらゆる金融資産に適用できます。かなり正確な見積もりを提供し、取引を開始して終了するのに最適な時期を教えてくれます。1つのシグナルを処理しただけでインジケーターの元が取れた例の 動画 (6:22)をご覧ください。Entry PointsPro インジケーターの助けを借りたほとんどのトレーダーの最初の1週間の結果が改善しています。 Telegramグループ に登録してください。Entry Points Proインジケーターのメリットは次の通りです。 再描画のないエントリーシグナル 再描画されるインジケーターでは一度表示されたシグナルが削除されて大きな金銭的損失につながることがありますが、これと異なり、表示されて確認されたシグナルは消えることがありません。 エラーなしの取引開始 インジケーターアルゴリズムによって取引を開始する(資産を売買する)理想的な瞬間を見つけることができます。それを使用するすべてのトレーダーの成功率が向上します。
ICT, SMC, SMART MONEY CONCEPTS, SMART MONEY, Smart Money Concept, Support and Resistance, Trend Analysis, Price Action, Market Structure, Order Blocks, BOS/CHoCH,   Breaker Blocks ,  Momentum Shift,   Supply&Demand Zone/Order Blocks , Strong Imbalance,   HH/LL/HL/LH,    Fair Value Gap, FVG,  Premium  &   Discount   Zones, Fibonacci Retracement, OTE, Buy Side Liquidity, Sell Side Liquidity, BSL/SSL Taken, Equal Highs & Lows, MTF Dashboard, Multiple Time Frame, BigBar, HTF OB, HTF Market Structure
AW Trend Predictor MT5
AW Trading Software Limited
4.76 (54)
1 つのシステムでのトレンド レベルとブレイクダウン レベルの組み合わせ。高度なインジケーター アルゴリズムは、市場のノイズをフィルター処理し、トレンド、エントリー ポイント、および可能なエグジット レベルを決定します。インジケーターシグナルは統計モジュールに記録されるため、最適なツールを選択してシグナル履歴の有効性を示すことができます。この指標は、テイクプロフィットとストップロスのマークを計算します。 マニュアルと説明書 ->   ここ / MT4 バージョン ->   ここ インジケーターで取引する方法: Trend Predictor での取引は、たった 3 つの簡単なステップです。 ステップ 1 - ポジションを開く 70% 以上の成功率で買いシグナルが受信されました ステップ 2 - ストップロスの決定 逆信号でトランクを選択 ステップ 3 - テイクプロフィット戦略の定義 戦略 1: TP1 に到達したらポジション全体をクローズする 戦略 2: TP1 に達した時点でポジションの 50% をクローズし、TP2 に達した時点で残りの 50% をクローズします。 戦略 3:
Auto Order Block with break of structure based on ICT and Smart Money Concepts Futures Break of Structure ( BoS )             Order block ( OB )            Higher time frame Order block / Point of Interest ( POI )    shown on current chart           Fair value Gap ( FVG ) / Imbalance   ,  MTF      ( Multi Time Frame )    Volume Imbalance     ,  MTF          vIMB Gap’s Equal High / Low’s     ,  MTF             EQH / EQL Liquidity               Current Day High / Low           HOD /
Was: $299  Now: $99   Supply Demand uses previous price action to identify potential imbalances between buyers and sellers. The key is to identify the better odds zones, not just the untouched ones. Blahtech Supply Demand indicator delivers functionality previously unavailable on any trading platform. This 4-in-1 indicator not only highlights the higher probability zones using a multi-criteria strength engine, but also combines it with multi-timeframe trend analysis, previously confirmed swings
Gannスクエアインジケーターは、W.D. Gannによって執筆された「市場予測のための数学的な式」の記事に基づく強力な市場分析ツールです。このツールは、解析に数学的な概念を応用し、Gann理論に基づいています。それは、144、90、52のスクエアや9のスクエアなど、Gannの関連テクニックの要素を取り入れています。さらに、の方法を組み込んでおり、9のスクエアとその関連性についてのチャネルやスターパターンに焦点を当てています。 ユーザーマニュアルと使用方法: このインジケーターを使用する前に、ユーザーマニュアルを読んで疑問点を解決するためにお問い合わせいただくことをお勧めします。ユーザーマニュアルの完全版は、当社のウェブサイトで入手できます。 MT5の完全版は購入できますし、MT4の無料版も試すことができます。両方のバージョンへのリンクを提供していますので、ご利用ください。 主な機能と機能: Gannスクエアインジケーターは、市場分析のための完全なツールセットを提供し、幾何学的な概念とGann理論に基づいて的確な判断を行う手助けをします。以下に主な機能を示します。 9のスクエアの分析:
note: this indicator is for METATRADER4, if you want the version for METATRADER5 this is the link:  https://www.mql5.com/it/market/product/108106 TRENDMAESTRO recognizes a new TREND in the bud, he never makes mistakes. The certainty of identifying a new TREND is priceless. DESCRIPTION TRENDMAESTRO identifies a new TREND in the bud, this indicator examines the volatility, volumes and momentum to identify the moment in which there is an explosion of one or more of these data and therefore the mome
ブレーカートレーダーになり、価格が反転すると市場構造からの利益が変化します。 注文ブロックブレーカーインジケーターは、トレンドまたは価格の動きが枯渇に近づいており、逆転の準備ができていることを識別します。通常、反転または大規模なプルバックが発生しようとしているときに発生する市場構造の変化について警告します。 この指標は、ブレイクアウトと価格の勢いを識別する独自の計算を使用します。使い果たされる可能性のあるポイントの近くで新しい高値が形成されるたびに、インディケーターはその高値の作成を担当する最後の注文ブロックを描きます。次に、移動する価格とともに注文ブロックを追跡します。その後、価格が反対方向にシフトし、その注文ブロックを突破すると、新しい市場構造を作成し、トレンドまたは大きな後退の可能性のある反転の開始を警告します。 注文ブロックは、高値/安値が作成される前の最後の反対色のろうそくであり、価格がこれらの重要な領域を下抜けすると、トレンドの短期的ま​​たは長期的な反転の兆候です。 特徴 重要な枯渇点での市場構造の変化を警告します 価格が使い果たされるレベルに近づくと、
トレンドラインマップインジケーターは、トレンドスクリーナーインジケーターのアドオンです。トレンドスクリーナー(トレンドラインシグナル)によって生成されたすべてのシグナルのスキャナーとして機能します。 これは、トレンドスクリーナーインジケーターに基づくトレンドラインスキャナーです。 Trend Screener Pro インジケーターがない場合、Trend Line Map Proは機能しません。 It's a Trend Line Scanner based on Trend Screener Indicator. If you don't have Trend Screener Pro Indicator,     the Trend Line Map Pro will not work . ブログにアクセスすると、トレンドラインマップインジケーターの無料バージョンをダウンロードできます。 Metatrader Testerの制限なしで、購入する前に試してみてください。 :  ここをクリック 1.簡単になる利点 通貨と時間枠に基づいて売買シグナルを表示し
TrendLine PRO MT5
Evgenii Aksenov
4.78 (49)
The Trend Line PRO indicator is an independent trading strategy. It shows the trend change, the entry point to the transaction, as well as automatically calculates three levels of Take Profit and Stop Loss protection Trend Line PRO is perfect for all Meta Trader symbols: currencies, metals, cryptocurrencies, stocks and indices Advantages of Trend Line PRO Never redraws its signals The possibility of using it as an independent strategy It has three automatic levels Take Profit and Stop Loss lev
MT4版  |  FAQ Owl Smart Levels Indicator は、 Bill Williams の高度なフラクタル、市場の正しい波構造を構築する Valable ZigZag、エントリの正確なレベルをマークする Fibonacci レベルなどの一般的な市場分析ツールを含む 1 つのインジケーター内の完全な取引システムです。 利益を得るために市場と場所に。 戦略の詳細な説明 インジケータを操作するための指示 顧問-取引助手 プライベートユーザーチャット ->購入後に私に書いて、私はプライベートチャットにあなたを追加し、あなたはそこにすべてのボーナスをダウンロードすることができます 力はシンプルさにあります! Owl Smart Levels 取引システムは非常に使いやすいので、専門家にも、市場を勉強し始めて自分で取引戦略を選択し始めたばかりの人にも適しています。 戦略と指標に秘密の数式や計算方法が隠されているわけではなく、すべての戦略指標は公開されています。 Owl Smart Levels を使用すると、取引を開始するためのシグナルをすばやく確認し、注文を出すため
TPSpro TRENDPRO  - is a trend indicator that automatically analyzes the market and provides information about the trend and each of its changes, as well as giving signals for entering trades without redrawing! The indicator uses each candle, analyzing them separately. referring to different impulses - up or down impulse. Exact entry points into transactions for currencies, crypto, metals, stocks, indices!  -  Version MT4                  DETAILED DESCRIPTION        /       TRADING SETUPS       
Gartley Hunter Multi - An indicator for searching for harmonic patterns simultaneously on dozens of trading instruments and on all classic timeframes: (m1, m5, m15, m30, H1, H4, D1, Wk, Mn). Manual (Be sure to read before purchasing) | Version for MT4 Advantages 1. Patterns: Gartley, Butterfly, Shark, Crab. Bat, Alternate Bat, Deep Crab, Cypher 2. Simultaneous search for patterns on dozens of trading instruments and on all classic timeframes 3. Search for patterns of all possible sizes. Fr
Was: $249  Now: $99   Market Profile defines a number of day types that can help the trader to determine market behaviour. A key feature is the Value Area, representing the range of price action where 70% of trading took place. Understanding the Value Area can give traders valuable insight into market direction and establish the higher odds trade. It is an excellent addition to any system you may be using. Inspired by Jim Dalton’s book “Mind Over Markets”, this indicator is designed to suit the
トレンド検出インジケーターはあらゆる戦略を補完し、独立したツールとしても使用できます。 インジケーターの操作に関する推奨事項、コメント   #8   でダウンロードできます 利点 使いやすく、不要な情報でチャートを過負荷にしません。 あらゆる戦略のフィルターとして使用できます。 利益を得るのとストップロスを設定するの両方に使用できる動的なサポートとレジスタンスのレベルが組み込まれています。 ローソク足が閉じた後、インジケーターの色は変わりません。  株式市場、指数、石油、金、およびすべての時間枠で機能します。 トースト通知、電子メール通知、プッシュ通知、サウンドアラートの機能があります。 私の他の開発はここで見つけることができます: https://www.mql5.com/ja/users/mechanic/seller 入力パラメータ Alert-オン/オフ。アラート; Push Notification-オン/オフ。プッシュ通知; Mail-オン/オフ電子メール通知; Fibo 1,2,3,4,5,6,7,11,21,31,41,51,61,71-動的サポートと抵抗
Golden Spikes Detector This indicator is based on an advanced strategy primarily for trading spikes on Boom and Crash Indices. Complex algorithms were implemented to detect high probability entries only. It alerts on potential Buy and Sell entries. To trade spikes on the Deriv or Binary broker, only take Buy Boom and Sell Cash alerts. It was optimised to be loaded on 5-minute timeframe although multiple timeframe analysis is done in the background. Features ·             Desktop pop up and sound
Matrix Arrow Indicator MT5
Juvenille Emperor Limited
5 (14)
マトリックスアローインジケーターMT5は、すべてのシンボル/商品(外国為替、商品、暗号通貨、インデックス、株式)で使用できる100%再描画されていないマルチタイムフレームインジケーターに続くユニークな10in1トレンドです。マトリックスアローインジケーターMT5は、初期段階で現在のトレンドを判断し、最大10の標準インジケーターから情報とデータを収集します。 平均方向移動指数(ADX) 商品チャネルインデックス(CCI) クラシック平研アシキャンドル 移動平均 移動平均収束発散(MACD) 相対活力指数(RVI) 相対力指数(RSI) 放物線SAR ストキャスティクス ウィリアムズのパーセント範囲 すべてのインジケーターが有効な買いまたは売りシグナルを与えると、対応する矢印がチャートに印刷され、次のろうそく/バーの開始時に強い上昇トレンド/下降トレンドを示します。ユーザーは、使用するインジケーターを選択し、各インジケーターのパラメーターを個別に調整できます。マトリックスアローインジケーターMT5は選択されたインディケーターからのみ情報を収集し、それらのデータのみに基づいてアローを印
作者のその他のプロダクト
SSA Trend Predictor
Roman Korotchenko
4.25 (4)
This indicator extracts a trend from a price series and forecasts its further development. Algorithm is based on modern technique of Singular Spectral Analysis ( SSA ). SSA is used for extracting the main components (trend, seasonal and wave fluctuations), smoothing and eliminating noise. It does not require the series to be stationary, as well as the information on presence of periodic components and their periods. It can be applied both for trend and for another indicators. Features of the m
FREE
SSACD - Singular Spectrum Average Convergence/Divergence This is an analogue of the MACD indicator based on the Caterpillar-SSA ( Singular Spectrum Analysis ) method. Limited version of the SSACD Forecast indicator. Limitations include the set of parameters and their range. Specificity of the method The Caterpillar-SSA is an effective method to handle non-stationary time series with unknown internal structure. The method allows to find the previously unknown periodicities of the series and mak
FREE
フィルタ:
削除済み 2023.05.22 12:07 
 

ユーザーは評価に対して何もコメントを残しませんでした

Aleksandr Sosnovskiy
2362
Aleksandr Sosnovskiy 2021.06.26 00:04 
 

Очень интересный индикатор. Хорошее дополнение к стратегии типа Price Action или VSA.

削除済み 2019.01.14 06:42 
 

ユーザーは評価に対して何もコメントを残しませんでした

Gennadiy Voltornist
11909
Gennadiy Voltornist 2018.02.04 17:15 
 

ユーザーは評価に対して何もコメントを残しませんでした

Daniel Andrejczuk
5596
Daniel Andrejczuk 2017.11.09 13:36 
 

ユーザーは評価に対して何もコメントを残しませんでした

Nork
6194
Nork 2017.01.31 06:59 
 

ユーザーは評価に対して何もコメントを残しませんでした

レビューに返信
バージョン 2.15 2021.11.25
The latest version of the MQL5 compiler was used.
バージョン 2.0 2017.04.12
Modified the algorithm. Fixed the inaccuracies. Prepared for integration with an expert.