RSI Alerts MT5
- インディケータ
- Yurij Izyumov
- バージョン: 1.3
- アップデート済み: 26 11月 2021
- アクティベーション: 20
Addition to the standard Relative Strength Index (RSI) indicator, which allows to configure various notifications about the events related with the indicator. For those who don't know what this indicator is useful for, read here. This version is for MetaTrader 5, MetaTrader 4 version - here.
Currently implemented events:
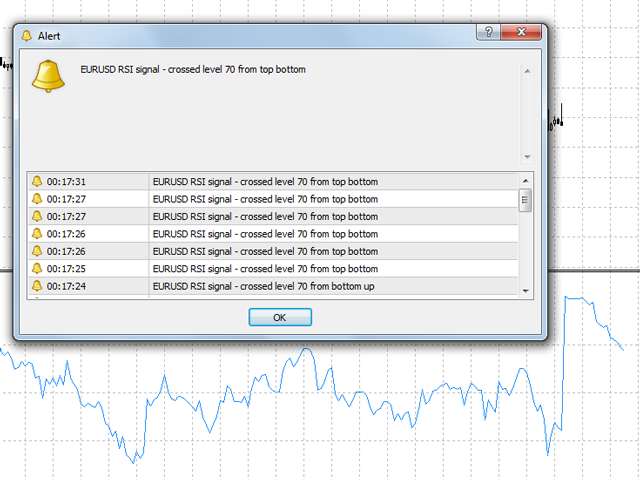
- Crossing from top to bottom - of the upper signal level (default - 70) - sell signal.
- Crossing from bottom to top - of the upper signal level (default - 70) - sell signal.
- Crossing from top to bottom - of the lower signal level (default - 30) - buy signal.
- Crossing from bottom to top - of the lower signal level (default - 30) - buy signal.
- Crossing from top to bottom - of level 50 - sell signal.
- Crossing from bottom to top - of level 50 - buy signal.
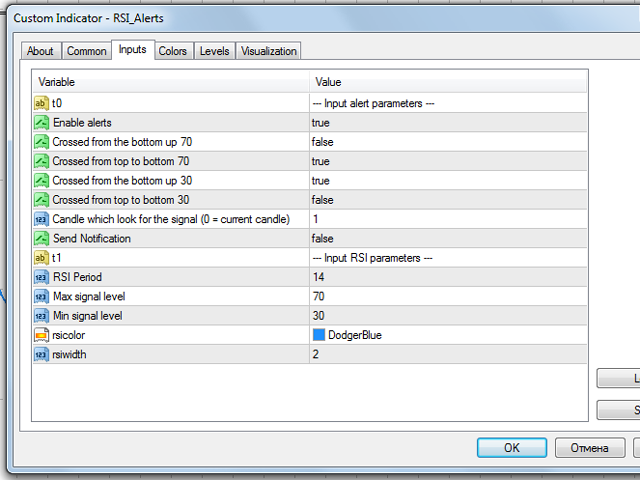
Added the ability to change the message text. In the messageUp and messageDown variables, the %level% icons will be replaced by the level the indicator crossed.
If necessary, the values of these signal levels can be adjusted in the settings using the variables - MaxLevel and MinLevel.
Configurable notification types:
- Sound signal with a pop-up message box - Alert.
- Sending push-notifications to the mobile terminal (for smartphones and tablets)
In order to enable the sound signal with a pop-up message in the RSI Alerts indicator, simply set Alerts = true in the settings, to disable -Alerts = false.
In order to enable sending messages about the RSI setting to the mobile terminal, set SendNotifications = true, with the MetaQuotes IDconfigured in advance (if you do not know where).
The sound alert and notifications can work both simultaneously or individually.
There is also the alertShift parameter - it is the number of the candle to search for the signal.
For example, if alertShift = 1, then the signals are generated only on completed candles, on the latest one.
And if you set alertShift = 0, then the signals will be generated on the current candle - zero candle. Please note, that in this mode the signal can be false.
If you need any additional functionality for the indicator, contact me.

It doesnt send notifications, all settings are correct: as it should be