Median and Turbo renko indicator bundle
Robust median Renko style indicator for creating custom charts resembling Median Renko, Mean Renko, Turbo Renko and Better Renko candles as well as vanilla Renko with wicks plus Point-O charts. This all in one package provides all of the signals needed by day traders, scalpers, and even long-term traders.
Main characteristics
- The indicator is an overlay on the main chart so it is possible to utilize one-click trading and order manipulation directly on the custom charts. Visual order placement is also possible.
- History calculated using real tick data.
- Built-in technical studies: 3 moving averages (Simple, Exponential, Smooth, Linear-weighted, Volume-weighted using tick volume or real volume), Bollinger Bands, Donchian channel, Super Trend.
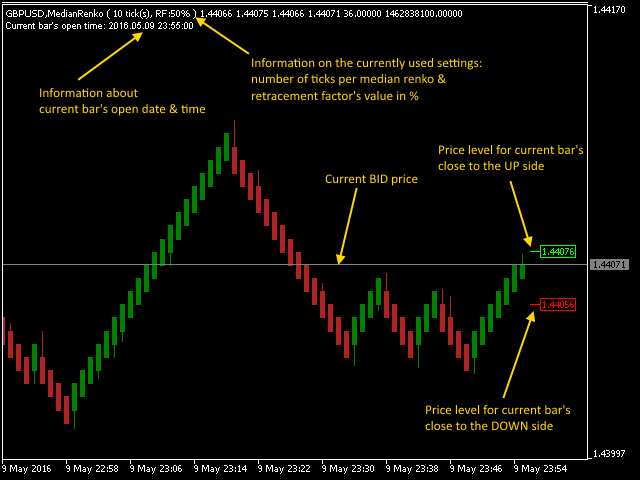
- Price level indications for current bar close levels, which are conveniently displayed to the right of the current bar.
- Optional display of monthly, weekly and daily pivot levels.
- Optional display of daily R1, R2, R3 & S1, S2, S3 resistance & support levels for the current trading day.
- Optional display of previous day's high, low and close levels.
- Optional ATR based bar size calculation.
- Optional first Renko open offset.
- Audio, Push notifications and text alerts for new bar open events and/or reversals (different audio files can be assigned for bearish and bullish reversals).
- Convenient display of current bar's open date/time along with bar size and retracement factor information.
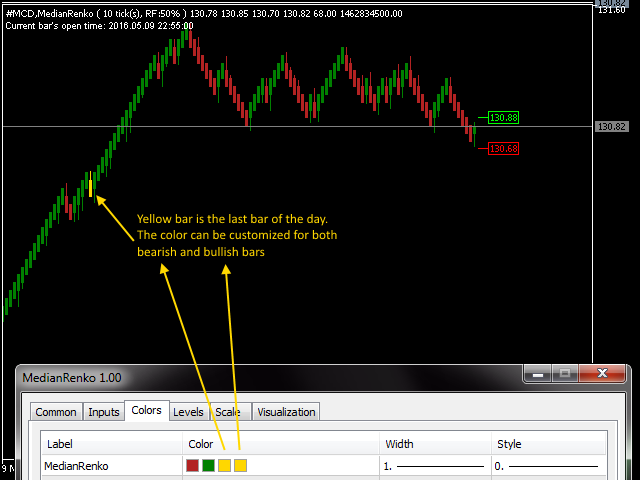
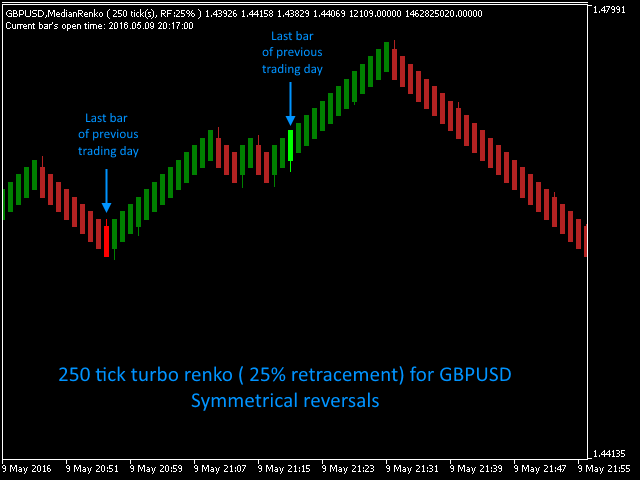
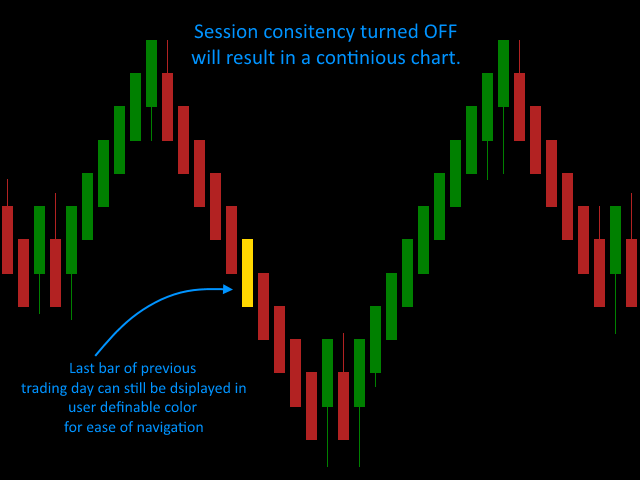
- Color indication of last day's bar for easy history assessment.
- Color markup of phantom Renko bars (gaps).
- Each bar has its own info regarding the bar's Open, Low, High, Close values, as well as the Tick Volume, Real Volume (with breakdown of buy/sell volume) and Bar open time for use by EAs (saved as double in indicator's buffer and available via dedicated Data Window).
- A dedicated data window is displayed when left-clicking a Renko bar while holding down the CTRL key.
Indicator Settings
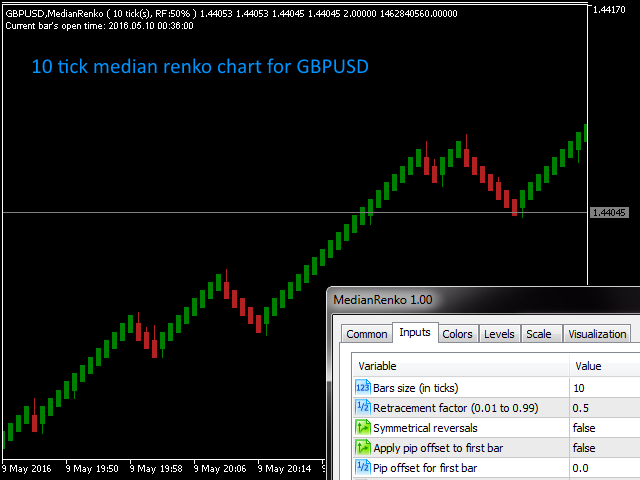
- Bars size (in points).
- Retracement factor (0.01 to 1.00).
- Asymmetrical reversals (true/false).
- Show wicks (true/false).
- ATR based bar size calculation (user editable ATR period and percent of daily ATR value used for bar size calculation).
- Show history for defined number of days (plus current day).
- Apply offset to first Renko (plus offset value).
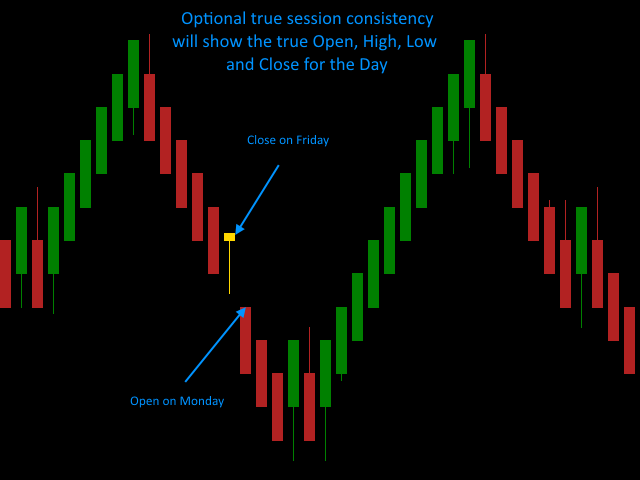
- Synchronize first bar's open on a new day (true/false).
- Top/Bottom padding (0.0 - 1.0) - used to set the margins above and below the visible high & low of the visible Renko chart.
- Show Monthly, Weekly and Daily pivot levels plus Daily R1, R2, R3 & S1, S2, S3 (calculated using Classic or Fibonacci method) as well as previous day's High, Low & Close levels with color definitions.
- Pivot Point calculation method ( (H+L+C)/3 or (O+H+L+C)/4 ).
- Show current bar's close projections (true/false) + bullish bar projection color and bearish bar projection color.
- Display current bar's open time along with bar size and retracement factor (true/false) + Current bar's open time info color.
- Alert on a new bar (true/false)
- Alert on reversal bar (true/false)
- Alert on MA crossover (true/false) - 1st MA (fast) & 2nd MA (slow) need to be enabled for the alert to work
- Display alert in Alert Window (true/false)
- Play sound on alert (true/false)
- Send alert via push notification to a smartphone (true/false)
- Use sound file for bullish alerts (.wav sound file located in MetaTrader 5 \Sounds folder).
- Use sound file for bearish alerts (.wav sound file located in MetaTrader 5 \Sounds folder).
- Settings for first MA - 3rd MA.
- Show Channel (None, Donchian Channel, Bollinger Bands, Super Trend).
- Donchian Channel period of averaging.
- Bollinger Bands apply to.
- Bollinger Bands period.
- Bollinger Bands deviations.
- Super Trend period.
- Super Trend multiplier.
- Display as bar chart (true/false).
- Shift objects with chart (true/false)
- Indicator used in EA via iCustom() (true/false) - Set this to true only when calling the indicator from an EA, another indicator or Script.
The first 5 settings are used for defining the type of chart that should be displayed and the next three are utilized for optional synchronization of chart's starting point for maximum consistency.
The following settings are used for turning ON/OFF various information on the chart to suit individual needs. These are followed by settings are used for custom alerting of new bars and new bar reversals.
Finally the last settings enable the trader to add 3 custom Moving Averages and a Donchian Channel, Bollinger Bands or Super Trend channel to perform technical studies directly on the Median Renko or Turbo Renko charts.
Below, you'll find the settings for creating several commonly utilized charting types:
- Median Renko
- Retracement factor = 0.5
- Asymmetrical reversals = yes
- Show wicks = yes
- Vanilla Renko with wicks
- Retracement factor = 1.0
- Asymmetrical reversals = yes
- Show wicks = yes
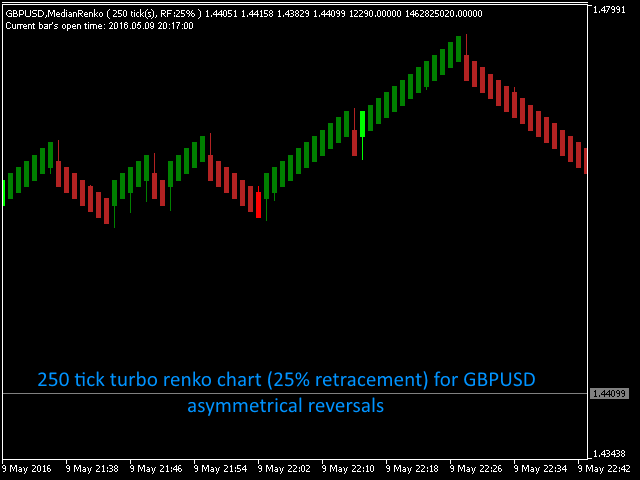
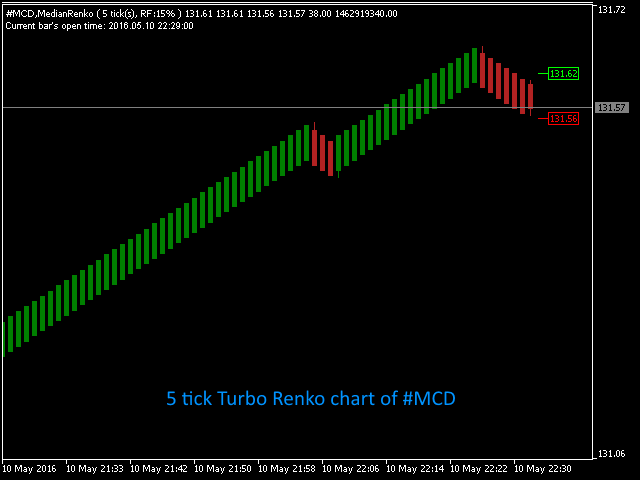
- Turbo Renko
- Retracement factor = 0.25
- Asymmetrical reversals = yes
- Show wicks = yes
- Hybrid Renko
- Retracement factor = 0.25
- Asymmetrical reversals = no
- Show wicks = yes
- Point-O
- Retracement factor = 1.0
- Asymmetrical reversals = no
- Show wicks = yes


Great indicator. Good support. Responsive Developer. Many strategy can be made from this renko indicator. It also for the the uni renko converter