PZ Harmonacci Patterns
- インディケータ
- PZ TRADING SLU
- バージョン: 11.6
- アップデート済み: 19 11月 2019
- アクティベーション: 20
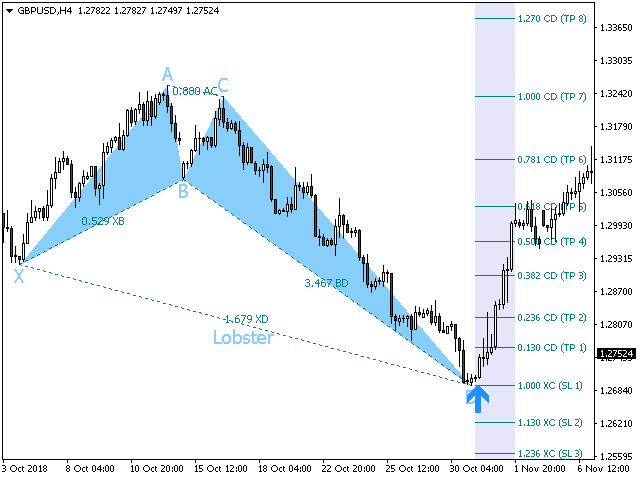
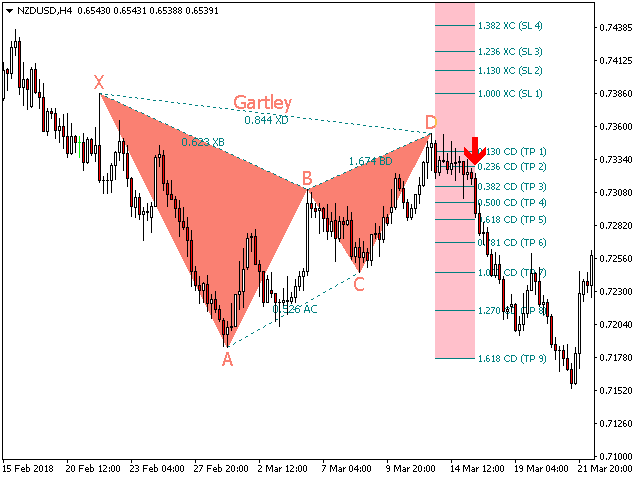
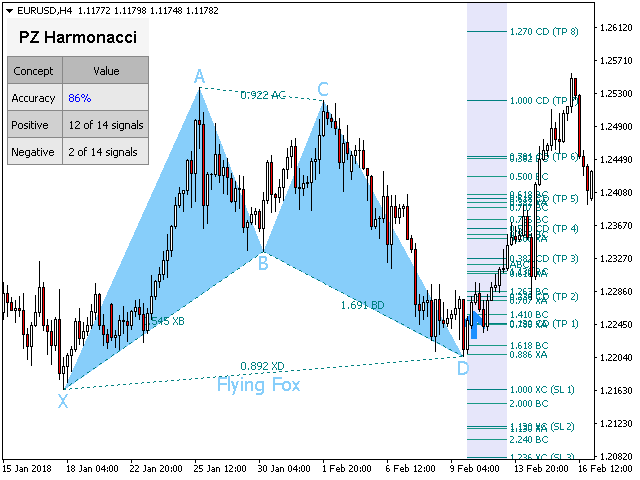
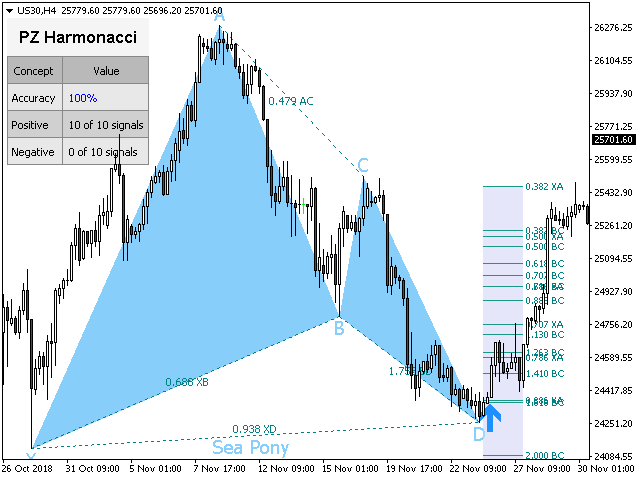
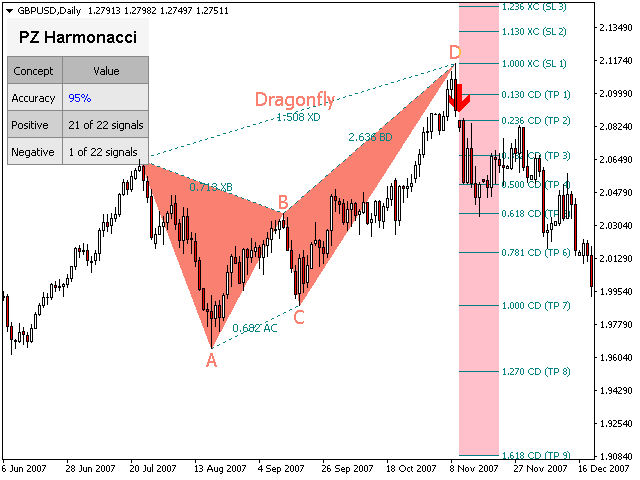
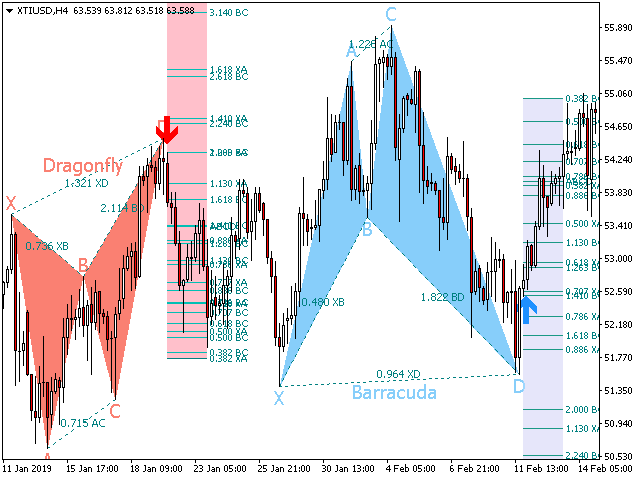
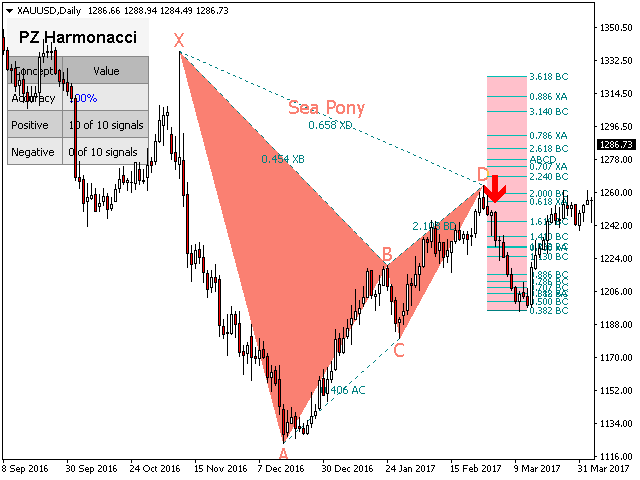
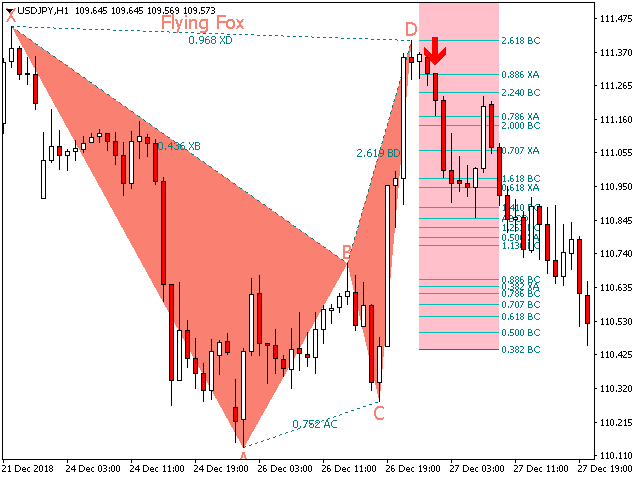
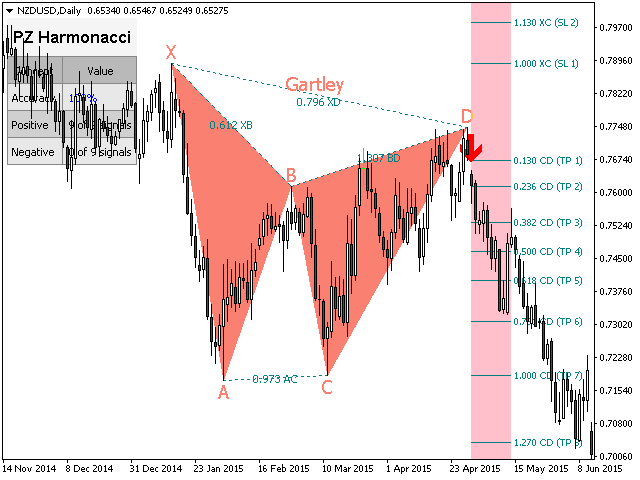
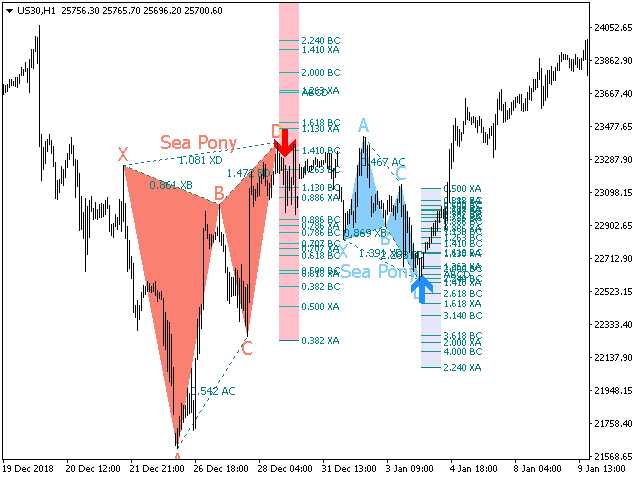
これはほぼ間違いなく、MetaTraderプラットフォームで見つけることができる最も完全な調和価格形成自動認識インジケーターです。 19種類のパターンを検出し、フィボナッチプロジェクションをあなたと同じように真剣に受け止め、潜在的逆転ゾーン(PRZ)を表示し、適切なストップロスとテイクプロフィットレベルを見つけます。
[ インストールガイド
| 更新ガイド
| トラブルシューティング
| よくある質問
| すべての製品
]
- 19の異なる調和価格形成を検出します
- プライマリ、派生および補完フィボナッチ投影(PRZ)をプロットします
- 過去の価格行動を評価し、過去のすべてのパターンを表示します
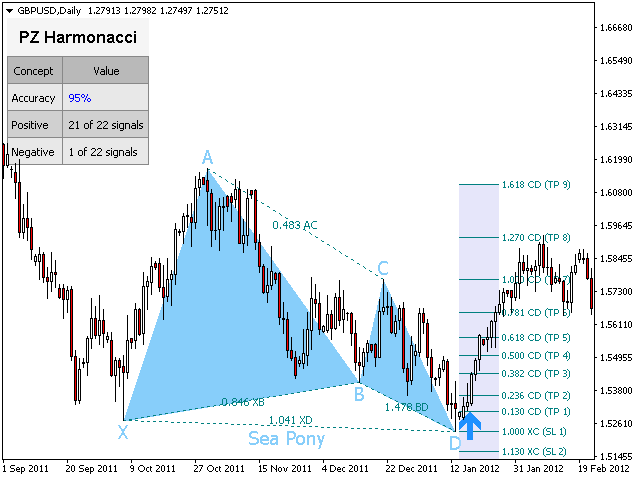
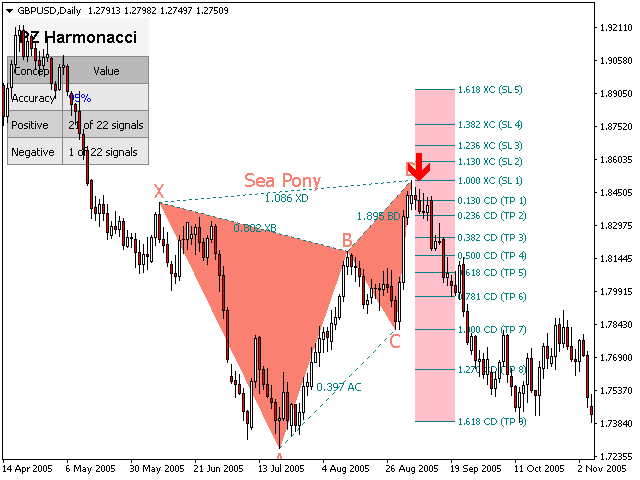
- この指標は、独自の品質とパフォーマンスを分析します
- 適切なストップロスとテイクプロフィットのレベルを表示します
- ブレイクアウトを使用して適切な取引を通知します
- すべてのパターン比をグラフにプロットします
- 電子メール/音声/視覚アラートを実装します
スコット・M・カーニーの本に着想を得て、この指標は最も純粋で急を要するトレーダーのニーズを満たすように設計されています。ただし、トレードを容易にするためにツイストを実装します。トレードをシグナルする前に正しい方向へのドンチャンのブレイクアウトを待機し、シグナルを非常に信頼性の高いものにします。
- フィボナッチ図法はベクトルに依存しません
- 電子メール/サウンド/プッシュアラートを実装します
- ABCD投影をプロットします
重要: 高調波、高調波貿易、バットパターン、バタフライパターン、サメ柄、:いくつかのパターン名は、米国内の次の商標を所有している氏はスコット・M・カーニー
、から商標権侵害の申し立てを遵守する自明の選択肢に改名されました
カニ柄とファイブオー柄 。
サポートされている調和価格形成
| 名前 | 最小XB | 最大XB | 最小AC | 最大AC | 最小DB | 最大BD | 最小XD | 最大XD |
|---|---|---|---|---|---|---|---|---|
| フライングフォックス | 0.382 | 0.5 | 0.382 | 0.886 | 1.618 | 2.618 | 0.886 | 0.886 |
| ガートレー | 0.618 | 0.618 | 0.382 | 0.886 | 1.272 | 1.618 | 0.786 | 0.786 |
| ロブスター | 0.382 | 0.618 | 0.382 | 0.886 | 2.24 | 3.618 | 1.618 | 1.618 |
| トンボ | 0.718 | 0.718 | 0.382 | 0.886 | 1.618 | 2.618 | 1.272 | 1.618 |
| サイファー | 0.382 | 0.618 | 1.13 | 1.414 | 1.272 | 2.0 | 0.786 | 0.786 |
| バラクーダ | - | - | 1.13 | 1.618 | 1.618 | 2.24 | 0.886 | 1.13 |
| アルトフライングフォックス | 0.382 | 0.382 | 0.382 | 0.886 | 2.0 | 3.618 | 1.13 | 1.13 |
| ディープロブスター | 0.886 | 0.886 | 0.382 | 0.886 | 2.618 | 3.618 | 1.618 | 1.618 |
| 白鳥 | 1.382 | 2.618 | 0.236 | 0.5 | 1.128 | 2.0 | 1.126 | 2.618 |
| 黒い白鳥 | 0.382 | 0.724 | 2.0 | 4.237 | 0.5 | 0.886 | 0.382 | 0.886 |
| マックスバット | 0.382 | 0.618 | 0.382 | 0.886 | 1.272 | 2.618 | 0.886 | 0.886 |
| マックス・ガートレー | 0.382 | 0.618 | 0.382 | 0.886 | 1.128 | 2.236 | 0.618 | 0.786 |
| マックストンボ | 0.618 | 0.886 | 0.382 | 0.886 | 1.272 | 2.618 | 1.272 | 1.618 |
| アルト・バラクーダ | 0.446 | 0.618 | 0.618 | 0.886 | 1.618 | 2.618 | 1.128 | 1.128 |
| ロブスター | 0.276 | 0.446 | 1.128 | 2.618 | 1.618 | 2.618 | 0.618 | 0.618 |
| トンボ | 0.382 | 0.618 | 1.128 | 2.618 | 1.272 | 1.272 | 0.618 | 0.786 |
| フライングフォックス | 0.382 | 0.618 | 1.128 | 2.618 | 2 | 2.618 | 1.128 | 1.128 |
| ガートレー | 0.618 | 0.786 | 1.128 | 2.618 | 1.618 | 1.618 | 1.272 | 1.272 |
| シーポニー | 0.128 | 3.618 | 0.382 | 0.5 | 1.618 | 2.618 | 0.618 | 3.618 |
入力パラメータ
- 振幅-このパラメーターは、チャートで検出されるパターンのサイズを制御します。
- 偏差-パターン認識のためのアルゴリズムの小刻みの部屋。より多くのパターンを見つけるには、値を増やします。
- ブレイクアウト期間-トレードシグナルのドンチャンブレイクアウト期間。
- 最大履歴バー-インジケーターが読み込まれたときに評価する履歴バーの量。
- 統計の表示-パフォーマンス画面の統計を有効または無効にします。
- 表示ポイント-価格ポイントラベル(X、A、B、C、Dラベル)を表示します。
- 表示比率-パターン比率を表示します。
- 投影の表示-潜在的な反転ゾーン(PRZ)の表示
- SL / TPレベルの表示-適切なストップロスおよびテイクプロフィットレベルを表示します。
- パターン設定-スキャンするパターンを選択します。使用しないパターンをすべて無効にします。
- 描画設定-強気と弱気のパターンの色とフォントサイズを構成します。
- 比率-比率を有効または無効にし、独自の比率の色を選択します。
- 投影-チャート上のフィボナッチ投影を表示または非表示にします。
- ブレイクアウト-ブレイクアウトを有効または無効にし、必要な矢印のサイズと色を設定します。
- アラート-ブレークアウト、パターン、またはその両方の表示/メール/プッシュ/サウンドアラートを有効にします。
著者
ArturoLópezPérez、個人投資家および投機家、ソフトウェアエンジニア、 PZ Tradingの創設者。


Good indicator, works very well. Easy to use and lots of settings to tweak the indicator the way you like. It's not signals indicator..use it as part of your trading strategy or trading system. The new updated version is way much better than the older versions. The price is high, but overall it's good investment. I suggest to add option to show possible stop loss and targets based on fibo levels.. they could appear after breakout arrow, and deleted once new pattern is formed. Just a suggestion :) Thanks