• 概要
  • レビュー (4)
  • コメント (13)
  • 最新情報

Currency Correlation Plus

4.75

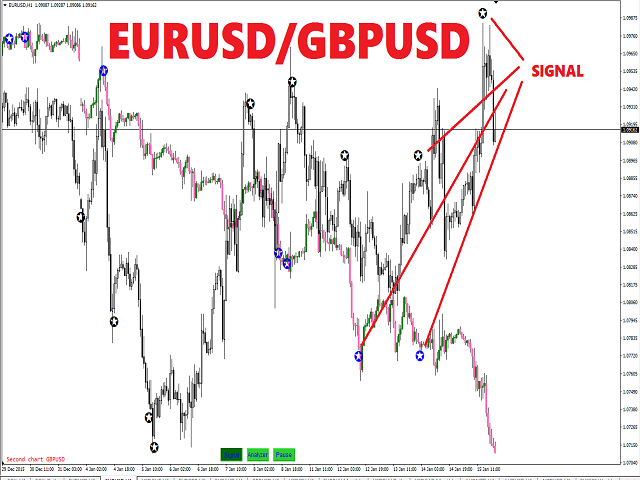
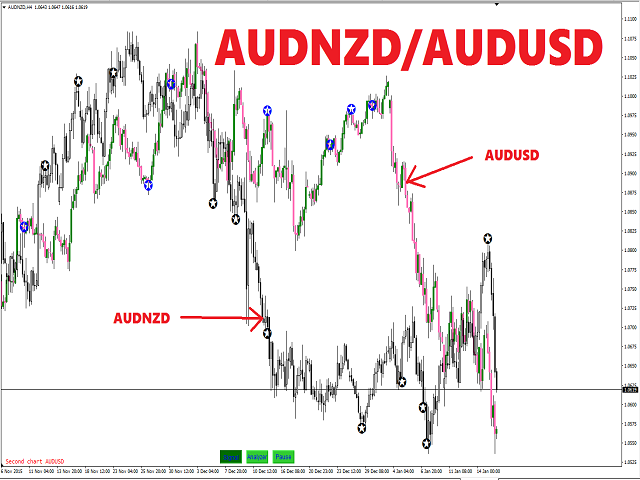
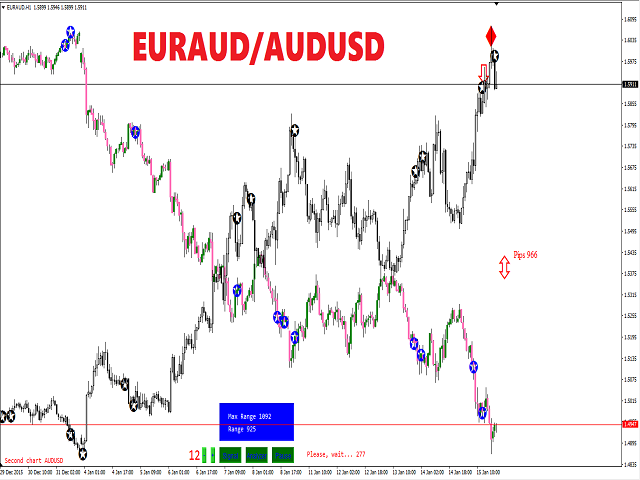
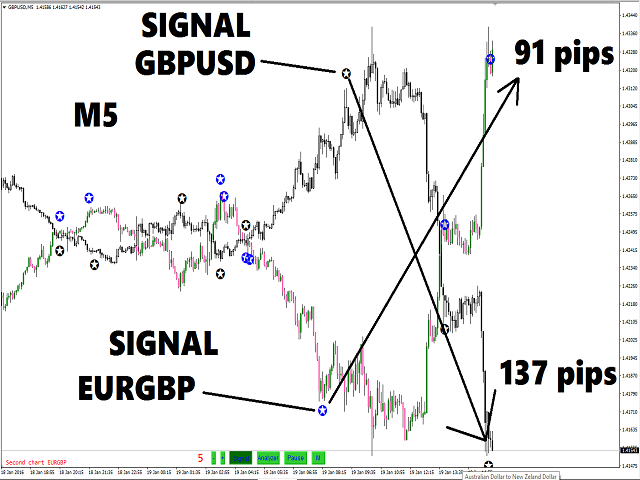
Currency Correlation Plus is an expensive version of the indicator. It is equipped with the signal and is more equipped than its cheaper brother.

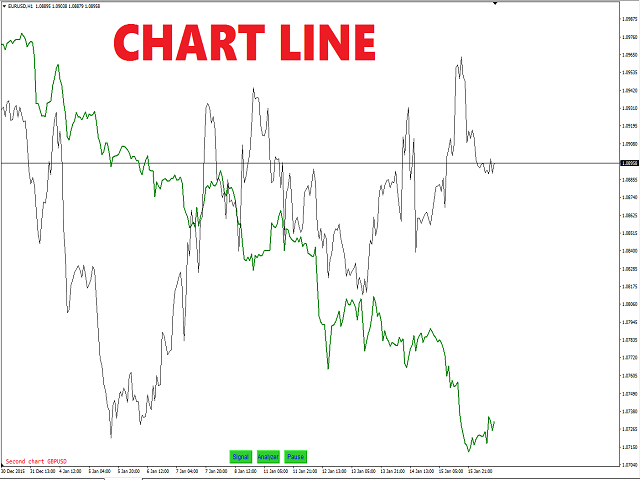
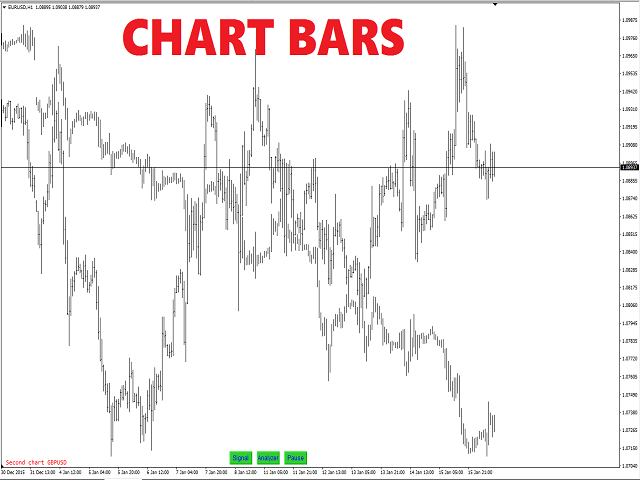
The indicator helps us understand and see a correlation. Second chart makes it easy to analyze and trade multiple currencies. On the chart, you can post multiple pairs. Type in the selected currency pair in the settings and add it to the chart.

If you want to have another tool, see another product: https://www.mql5.com/en/market/product/13392


Inputs

  • One indicator on chart=True / two or more=False
  • Alert Signal buy and sell for first chart and second chart
  • Color scheme Black on White [Background]
  • To add a second pair, simply enter the symbol
  • Body color of a bull candlestick
  • Body color of a bear candlestick
  • Shadow color and color of "Doji" Japanese candlestick
  • Color signal [first chart]
  • Color signal [second chart]


Additionally

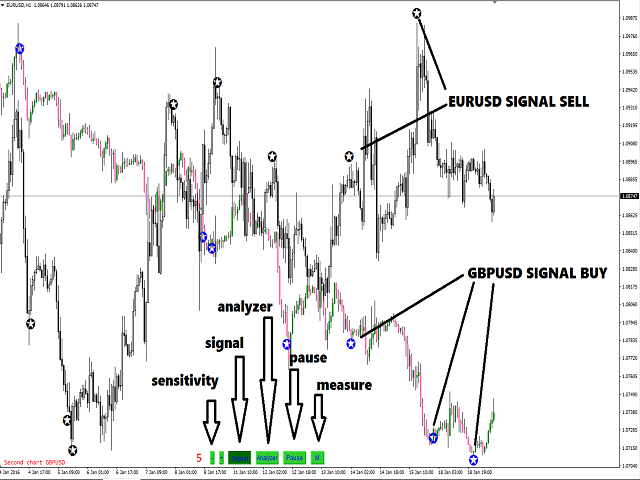
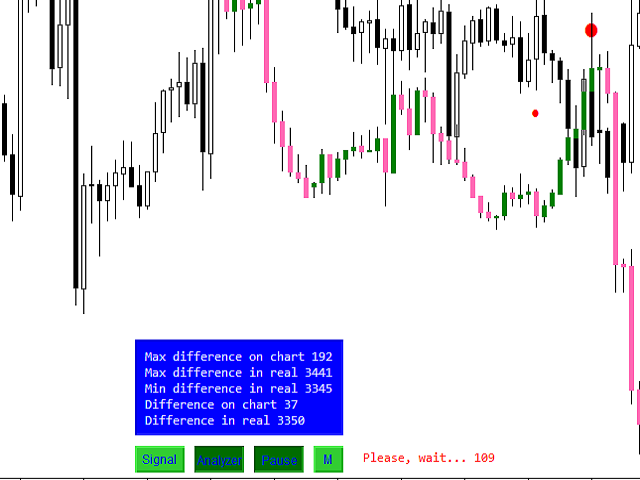
  • Analyzer: see the screenshot. Only demo and real, not tester.
  • Signal: see the screenshot. Only demo and real, not tester.
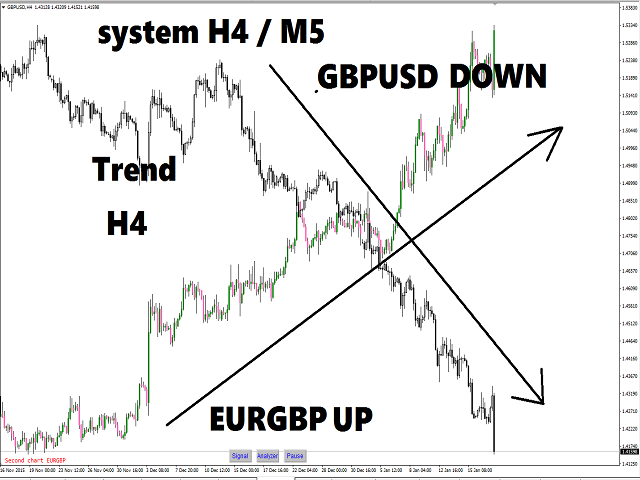
  • System H4/M5 - gratis. See the screenshot.


On Chart

  • Button - Signal. Signal buy and sell for first chart and second chart. Only demo and real, not tester.
  • Button - Analyzer. The difference between charts. Only demo and real, not tester.
  • Button - Pause. Pause analyzer. Only demo and real, not tester.
  • Button - Measure. The measure for the second chart. Only demo and real, not tester.
  • Button - Sensitivity. Plus/Minus. Only demo and real, not tester.
  • Max difference on chart: First chart - second chart. [Maximum]
  • Max difference in real: First pair - second pair. [Maximum]
  • Min difference in real: First pair - second pair. [Minimum]
  • Difference on chart: First chart- second chart. [Bars analyzed on this chart]
  • Difference in real: First pair - second pair. [Bars analyzed on this chart]

Wingdings on chart:

  • 115 - Max difference on chart.
  • 159 - Max difference in real.
  • 158 - Min difference in real.
  • 242 - Difference on chart and difference in real. Analyzer step by step.
  • 244 - Difference on chart [current].
  • 181 - Signal buy or sell.

Help: http://docs.mql4.com/constants/objectconstants/wingdings

レビュー 4
NLM63
34
NLM63 2024.01.18 11:23 
 

Really nice for correlation.

toomuchlbcake
274
toomuchlbcake 2022.10.15 19:10 
 

Helps tremendously with correlation trading. Thank you very much.

Emiliano La Rocca
86
Emiliano La Rocca 2020.08.25 07:05 
 

Excellent product in line with expectations.

おすすめのプロダクト
Oscillator helps determine the direction of the market Shows the direction of the price movement and is painted in the appropriate color. Allows you to conduct trend and counter trend trading It works on all timeframes, on any currency pairs, metals and cryptocurrency Can be used when working with binary options Distinctive features Does not redraw; Simple and clear settings; It works on all timeframes and on all symbols; Suitable for trading currencies, metals, options and cryptocurrency (Bitco
FREE
BreakoutSR shows you possible breakouts for current/following day . With integrated Support and Resistance lines and a menu you have a better overview of the chart. If the candle closes above "LONG" go long , if the candle closes below "SHORT" go short . Same is for SHORT/LONG Breakouts. Quick and easy to understand - tool, perfect for all types of traders. BreakOutSR Inputs MT4 Alert - Alerts you on ur MT4 Terminal Broker GTM - your Broker GTM BreakOuts: Draw Breakouts - Draw the Breakout lin
The Trend Champion indicator works on all timeframes and currency pairs. The indicator should be used as an auxiliary tool for technical analysis, it helps to determine the direction of the trend: either upward or downward price movement for a particular currency pair. Can be used along with oscillators as filters. Trend Champion is a trend indicator. Arrows indicate favorable moments and directions for entering the market. The indicator can be used both for pipsing on small periods and for l
Power Average
Khurram Mustafa
4.25 (8)
This Indicator is a  affordable trading tool  because with the help of  Popular Developers & Support of M Q L Platform  I have programmed this strategy. I tried to combine logic of  Moving Averages, Parabolic Stop And Reverse, Trend Strength, Oversold, Overbought . Furthermore, I have also care about  Support Resistance  that Trader can easily get in touch with market by selecting one indicator only. What is in for Trader? Trading Modes:  This selection is for  activate whole strategy  "Power
FREE
Indicator is able to alert by pop and acoustic alarm the achievement of the average price range of the last periods so as to be able to set our operation. It allows different percentage variables reached and periods of variation according to the parameters entered. Apply your reverse strategies to achieving that threshold so you get higher success rates. Indispensabile per le strategie reverse intraday.
Knowledge of the strength and weakness of each currency is vital for every forex trader. Our   Currency Strength Meter indicator   measures the strength of eight major currencies (USD, EUR, GBP, CHF, JPY, CAD, AUD, NZD) by using the Relative Strength Index indicator, also known as RSI. The Currency Strength Meter indicator shows you, simply and quickly, when a currency is oversold, overbought, or in "normal area". This way, you can identify which currency is the strongest and the weakest. Our
the trend line Alert indicator will inform you when the candlesticks crosses or touches the desired line. the indicator is having pop up and push notifications, see the pictures down how to setup, e.x, 1. pic one is alert 2. pic two is right click of the chart  3. pic three is how to change names of the trend so the indicator will detect 4. pic four is how you changed in the correct way  any assistance please drop me via mql5 chat
The indicator is a trading system for AUDUSD or NZDUSD currency pairs. The indicator was developed for time periods: M15, M30. At the same time, it is possible to use it on other tools and time periods after testing. "Kangaroo Forex" helps to determine the direction of the transaction, shows entry points and has an alert system. When the price moves in the direction of the transaction, the maximum length of the movement in points is displayed. The indicator does not redraw, all actions o
ToolBox 360 is the swiss knife of all indicators. It is full packed with useful tools to help you with your trading. It can be used to find best entry and exit points and help you to decide if you should open a trade or not. It shows market trends, candlestick formations outside / inside bars and you can sett time based allerts. Main features: Time based Fibonacci lines Choose a start and end time and the indicator shows you Fibonacci lines within the selected time range including range high
Introducing Daily Hedge - Your Advanced Custom Hedge System for Forex Trading Unleash the Power of Daily Hedge - Your Ultimate Trading Companion Experience the next level of trading sophistication with Daily Hedge, an advanced custom hedge system designed to revolutionize your Forex trading experience. With its cutting-edge features and intelligent algorithms, Daily Hedge empowers you to make informed decisions and seize profitable opportunities like never before. Unlocking Advanced Trading Str
** All Symbols x All Timeframes scan just by pressing scanner button ** *** Contact me after the purchase to send you instructions and add you in "ABCD scanner group" for sharing or seeing experiences with other users. Introduction This indicator scans AB=CD retracement patterns in all charts. The ABCD is the basic foundation for all harmonic patterns and highly repetitive with a high success rate . The ABCD Scanner indicator is a scanner reversal ABCD pattern that helps you identify when the p
Indicator for binary options arrow is easy to use and does not require configuration works on all currency pairs, cryptocurrencies buy signal blue up arrow sell signal red down arrow tips do not trade during news and 15-30 minutes before their release, as the market is too volatile and there is a lot of noise it is worth entering trades one or two candles from the current period (recommended for 1 candle) timeframe up to m 15 recommended money management fixed lot or fixed percentage of the depo
**Binary Smart Systemのご紹介:究極のトレードパートナー** Binary Smart Systemは単なるインジケーターではありません。様々な市場で的確なシグナルを提供し、洗練されたアルゴリズムと豊富なテクニカルインジケーターの集合をベースにした、トレーダーを的確さとタイムリーなシグナルで装備するための厳選されたトレードツールです。 **インジケーターコンポーネント:** 1. **移動平均パーセンテージ(MAP):** このコンポーネントは複数の移動平均の加重平均を計算し、トレンドの特定の強力な基盤を形成します。MAPは市場の状況に動的に適応し、現在のトレンド方向に対する洞察を提供します。 2. **商品チャネル指数(CCI):** 平均価格からの偏差を分析することで、CCIは買われすぎと売られすぎの状態を評価します。Binary Smart SystemのCCI統合は、ポテンシャルな反転ポイントを特定する包括的なアプローチを保証します。 3. **移動平均収束拡散法(MACD):** シンプルなクロスオーバーを超えるMACDコンポーネント
KT Candlestick Patterns Scanner is a Multi-Symbol and Multi-Timeframe scanner that fetches and shows various candlestick patterns on 28 currency pairs and 9 time-frames concurrently . The scanner finds the candlestick patterns by loading the KT Candlestick Patterns indicator as a resource in the background. Features The scanner can find the candlestick patterns on 252* combinations of symbols and time-frames from a single chart. Open the signal's chart loaded with a predefined template with
The most important thing in my system of forces, is the variation and changing of these forces. It is the key to the whole system, and from this point, my second indicator called FORCES-VARIATION appeares important. The indicator is represented in a separate window in the form of the green histogram and the red curve . The parameter NPIuPeriod represents the number of bars on which we calculate the variation of buyers forces. The parameter NPIdPeriod represents the number of bars on which we cal
This is a simple arrow system based on Engulfing Candlestick Pattern. It gives you alerts on your smartphone when there is an engulfing candlestick pattern happens. Which type of alerts available? 1. It paints on chart Up/Down Arrows. 2. Popup message and sound alert in trading terminal window. 3. Push notification or Alert on your Android and IOS mobile phones (requires MT4 or MT5 app installed!) *Note: Use it on higher timeframes like H4 (4 hours), D1 (1 Day) then find trade opportunities on s
Renko Starは、練行チャートを取引するように設計されたMT4矢印タイプのインジケーターです。このインジケーターには、勝率や獲得ポイントなどの役立つ情報をトレーダーに伝えるバックテストダッシュボードがあり、ATR x乗算のtpとslも提供されます。バーオープンまたはイントラバーのシグナルであり、シグナルが与えられた正確な価格を示す黄色のマークが付いています。このインジケーターの使用方法は、インジケーターが示す矢印に従って買いまたは売りを開始し、tpを設定することです。インジケーターによって与えられる sl や sl も、インジケーターの設定をいじってみると結果が良くなったり最悪になったりするため、信頼できるダッシュボードで良い結果が得られるまでインジケーター設定を変更する必要があります。 このインジケーターは再ペイントまたはバックペイントを行いません パラメーター : atr tp : atrに基づくtp値 atr sl : atrに基づくsl値 atr期間 星期 スターフィルター History : バックテストする履歴の量 スプレッド : 計算にスプレッドを使用した
The Pairs Cross indicator is a unique tool for negatively correlated trading instruments, such as EURUSD and USDCHF currency pairs. It is based on a concept called pairs trading (or spread trading). Our indicator compares the strength of two currency pairs that are inversely correlated and quickly tells you when it’s time to buy the first pair and short a second pair, and vice versa. This is a straightforward approach to trading currency pairs that works very well. How to you use the Pairs Cr
Market Structure MTF Dashboard Alerts:  Is an fast way of checking the currently market structure on 4 timeframes! It lets you know if you are trading in the direction of both long-term and shor-term market bias. It is setup to track the High and Low positions to determine the current bias. Once the bias is shifting on the any of the 4 timeframes - you have the option to have an alarm notify you of the change.  Once the alarm has gone off - you will be able to see a break of structure (BOS) form
ゴールドターゲットは最良のトレンド指標です。 このインジケーターの独自のアルゴリズムは、テクニカル分析と数学的分析の要素を考慮して資産価格の動きを分析し、最も収益性の高いエントリーポイントを決定し、矢印の形でシグナルと価格レベル(買いエントリー/売りエントリー)を発行します。 注文を開きます。 このインジケーターには、ストップロスの価格レベルとテイクプロフィットの 5 つの価格レベルもすぐに表示されます。 注意: このインジケーターは非常に使いやすいです。 ワンクリックでチャートにインジケーターをインストールし、そのシグナルと価格レベルに基づいて取引します。 インジケーターの利点: 1. インジケーターは高精度の信号を生成します。 2. インジケーター信号は再描画されません。 価格が各ラインを超えた場合に音声通知(アラート&メッセージ)を搭載しています。 3. どのブローカーの MetaTrader 4 取引プラットフォームでも取引できます。 4. あらゆる資産(通貨、金属、暗号通貨、株、指数など)を取引できます。 5. 任意の時間枠で取引できます (M15-M30 スキ
As the title says, this is an indicator that shows the current open market (session). It has 4 sessions with customizable schedule : 1. London session, 2. New York session, 3. Sydney session, 4. Tokyo session. Indicator inputs: - The color of each session. - The open time and close time of the sessions. - The line width. The objective of the indicator, is to follow each sessions, observe at what times are multiple sessions open, and thus take the chance of the high market movements.
FREE
This indicator calculates the strength of the major currencies (EUR, USD, CAD, GBP, CHF, NZD, USD, JPY) and shows the top 4 strongest currency pairs that are currently in a high probability trend for the day or for the week. Usage The indicator displays 8 currency pairs with a trend direction (e.g. "EURUSD-DOWN") and ranked according to strength, with 1 being ths strongest. There will be 4 pairs for intraday and 4 pairs for intraweek If a currency pair is present in the top 4 intraday, it is i
CSS " currency strength slope "  is a a multi currency strength indicator that use Forex major currencies, EUR, USD, CAD, AUD, NZD, JPY, CHF, GBP. it use 28 major pairs to calculate the power of every currency using a based moving averages algorithm : you will see volatility clearly between currencies. input: MA Fast & Slow. - MA Mode : simple, exponential, smoothed, linear weighted - Applied Price : close, open, high, low, median price, typical price, weighted price.
Anemone
Sean Christian Hammond
人工知能(AI)を用いて、生物の目に見える行動パターンを傾向分析に取り込むために作成。 カオス理論は移動平均と出会う。 イソギンチャクに餌を与えるフィルターは、その蔓を伸ばして栄養の海に出し、自分自身を豊かにします。 私は過度に長い説明であなたの時間を無駄にしません、概念はこれらの用語で理解できます。 そのカスタマイズ可能な期間回転移動平均は、あなたが指定した時間入力で、単純、指数、加重、平滑化の間で切り替わります。 ローテーションはセミカオスであり、市場自体によって注入されたランダム性です。 これらのMAを積み重ねると、イソギンチャクのフィルターが巻きひげを環境に伸ばして餌を摂るような効果が得られます。
The indicator calculates currency strength of eight major and also can calculate strength of any other currency, metal or CFD. You don't need to look through a lot of charts to determine the strong and weak currencies, as well as their current dynamics. The picture of the whole currency market for any period can be viewed in a single indicator window. Built-in tools for monitoring and controlling the situation will help you not to miss out on profits. Main Features It is able to display only t
Scalper Vault は、スキャルピングを成功させるために必要なすべてを提供するプロフェッショナルなスキャルピング システムです。このインジケーターは、外国為替およびバイナリー オプションのトレーダーが使用できる完全な取引システムです。推奨される時間枠は M5 です。 システムは、トレンドの方向に正確な矢印シグナルを提供します。また、トップとボトムのシグナルとギャン マーケット レベルも提供します。 インジケーターは、プッシュ通知を含むすべてのタイプのアラートを提供します。 インジケータの購入後にご連絡ください。私の個人的な取引の推奨事項と素晴らしいボーナス指標を無料で共有します! 幸せで有益な取引をお祈りします!
The FFx Dashboard MTF alerter will show you on a single chart all the timeframes (M1 to Monthly) with their own status for the indicator. 2 Alert Options: Single timeframe: each selected timeframe alert separately when a signal occurs Multi timeframes: all selected timeframes must agree for an alert to be triggered Both options have an input to select the timeframes to be used for the alert(s). How to understand the status: Green/Red square: ADX above level Grey square: ADX below level Red b
MA Speedometer
Davit Beridze
4.71 (14)
Non standard attitude to the standard moving average indicator. The essence of the indicator is to determine the strength and speed of the price direction by determining the tilt angle of the moving average. A point is taken on the fifteenth MA candle and a point on the last closed MA candle, a straight line is drawn between them, it is movable and on a hemisphere shows an angle of inclination from 90 degrees to -90. above 30 degrees is the buying area, below -30 degrees is the selling area. abo
Does your trading consist of Multiple EA's, Multiple time frames an no clear indication of how each individual strategy or time frame is performing, then this indicator will help. Assign the EA Magic number to this indicator and track it's performance on the chart by selecting on chart the period, today, week, month year or all history to view. Easy visual colour changing header to display the performance of the EA for the respective periods.    Minimize the panel to reduce chart clutter. Add yo
Leave a review for this product, and receive another "Free" product that you choose. You can see my other products here: https://www.mql5.com/en/users/zakri/seller Harmonic Patterns Detector indicator draws harmonic patterns on chart. Harmonic patterns have a high hit-rate of around 80% and are excellent for trade entries. They are used as price reversal points. Some of them have a long history of usage and were created by famous traders like H. M. Gartley. Many harmonic patterns are included
このプロダクトを購入した人は以下も購入しています
Gann Made Easy は、ミスター・ギャンの理論を使用した取引の最良の原則に基づいた、プロフェッショナルで使いやすい外国為替取引システムです。 W・D・ガン。このインジケーターは、ストップロスとテイクプロフィットレベルを含む正確な買いと売りのシグナルを提供します。 PUSH通知を利用して外出先でも取引可能です。 購入後はご連絡ください!私の取引のヒントと素晴らしいボーナスインジケーターを無料で共有します! おそらく、ギャンの取引手法についてはすでに何度も聞いたことがあるでしょう。通常、ギャンの理論は初心者のトレーダーだけでなく、すでにある程度の取引経験がある人にとっても非常に複雑なものです。なぜなら、ギャンの取引手法は理論的にはそれほど簡単に適用できるものではないからです。私はその知識を磨き、最良の原則を私の外国為替インジケーターに組み込むために数年を費やしました。 このインジケーターは非常に簡単に適用できます。必要なのは、それをチャートに添付し、簡単な取引推奨事項に従うだけです。このインジケーターは常に市場分析の仕事を行い、取引の機会を探します。適切なエントリーポイントを検出
まず第一に、この取引インジケーターは再描画されず、再描画されず、遅延しないことを強調する価値があります。これにより、手動取引とロボット取引の両方に理想的なものになります。 アトミックアナリストは、価格の強さとモメンタムを利用して市場でより良いエッジを見つけるためのPA価格アクションインジケーターです。ノイズや誤ったシグナルを除去し、取引ポテンシャルを高めるための高度なフィルターを備えています。複雑なインジケーターの複数のレイヤーを使用して、アトミックアナリストはチャートをスキャンし、複雑な数学的計算をシンプルなシグナルと色に変換します。これにより、どのような初心者トレーダーでも理解して使用し、一貫した取引の決定を行うことができます。 「アトミックアナリスト」は、新規および経験豊富なトレーダー向けにカスタマイズされた包括的な取引ソリューションです。プレミアムインジケーターとトップノッチの機能を1つの取引戦略に組み合わせ、すべてのタイプのトレーダーにとって汎用性のある選択肢にします。 デイリートレーディングとスキャルピング戦略:高速で正確なデイトレーディングおよび短期トレード
TPSpro TRENDPRO  - is a trend indicator that automatically analyzes the market and provides information about the trend and each of its changes, as well as giving signals for entering trades without redrawing! The indicator uses each candle, analyzing them separately. referring to different impulses - up or down impulse. Exact entry points into transactions for currencies, crypto, metals, stocks, indices!  -  Version MT5               DETAILED DESCRIPTION        /       TRADING SETUPS           
ご紹介   クォンタム トレンド スナイパー インジケーターは 、トレンド反転を特定して取引する方法を変革する画期的な MQL5 インジケーターです。 13年以上の取引経験を持つ経験豊富なトレーダーのチームによって開発されました。     クォンタムトレンドスナイパーインジケーター   は、非常に高い精度でトレンドの反転を識別する革新的な方法で、あなたのトレーディングの旅を新たな高みに押し上げるように設計されています。 ***Quantum Trend Sniper Indicatorを購入すると、Quantum Breakout Indicatorを無料で入手できます!*** クォンタム ブレイクアウト インジケーターは、トレンドの反転を特定するとアラートを発し、矢印を示し、3 つのテイクプロフィットレベルを提案します。 初心者トレーダーにもプロのトレーダーにも適しています。 量子EAチャネル:       ここをクリック MT5のバージョン:       ここをクリック 推奨事項: 期間: すべての時間枠。最良の結果を得るには、
Trend Screener
STE S.S.COMPANY
4.83 (86)
トレンドインジケーター、1つのツールに組み込まれたすべての重要なトレンド機能を備えたトレンドトレーディングとフィルタリングのための画期的なユニークなソリューション! これは、すべてのシンボル/商品(外国為替、商品、暗号通貨、インデックス、株式)で使用できる100%再描画されていないマルチタイムフレームおよびマルチ通貨インジケーターです。 トレンドスクリーナーは、チャート内のドットで矢印トレンドシグナルを提供するインジケーターに続く効率的なインジケーターです。 トレンド分析インジケーターで使用できる機能: 1.トレンドスキャナー。 2.最大利益分析を備えたトレンドライン。 3.トレンド通貨強度メーター。 4.アラート付きのトレンド反転ドット。 5.アラート付きの強いトレンドドット。 6.トレンド矢印 毎日の分析例、毎日のシグナルパフォーマンス...など、トレンドスクリーナーインジケーターを使用して、ここで見つけることができます: ここをクリックしてください 期間限定オファー:トレンドスクリーナーインジケーターは、50ドルと生涯でのみご利用いただけます。 (元の価格125 $) MQ
A key element in trading is zones or levels from which decisions to buy or sell a trading instrument are made. Despite attempts by major players to conceal their presence in the market, they inevitably leave traces. Our task was to learn how to identify these traces and interpret them correctly. Reversal First Impulse levels (RFI)   -  Version MT5                INSTRUCTIONS                 RUS                 ENG                                       R ecommended to use with an indicator   -  
現在26%オフ 初心者やエキスパートトレーダーに最適なソリューション! このインジケーターは、独自の機能と新しい計算式を取り入れた、ユニークで高品質、かつ手頃な価格のトレーディングツールです。たった1枚のチャートで28の為替ペアの通貨強度を読み取ることができます。新しいトレンドやスキャルピングチャンスの引き金となるポイントを正確に特定することができるので、あなたのトレードがどのように改善されるか想像してみてください。 ユーザーマニュアルはこちら  https://www.mql5.com/en/blogs/post/697384 これが最初の1本、オリジナルだ! 価値のないクローンを買わないでください。 特別な サブウィンドウの矢印で強い通貨の勢いを表示 GAPがあなたのトレードを導く! 基準通貨や気配値が売られすぎ・買われすぎのゾーン(外相フィボナッチレベル)にあるとき、個別チャートのメインウィンドウに警告表示。 通貨がレンジの外側から反落した場合、プルバック/リバーサルのアラート。 クロスパターンの特別なアラート 複数の時間枠を選択可能で、トレンドを素早く
まず第一に、この取引ツールはノンリペイント、ノンリドロー、ノンラグの指標であり、プロの取引に理想的ですことを強調する価値があります。 スマートプライスアクションコンセプトインジケーターは、新米から経験豊富なトレーダーまで、非常 に強力なツールです。Inner Circle Trader AnalysisやSmart Money Concepts Trading Strategiesなど、20以上の有用な指標を1つに組み合わせています。このインジケーターはスマートマネーコンセプトに焦点を当て、大手機関の取引方法を提供し、彼らの動きを予測するのに役立ちます。 特に、流動性分析に優れており、機関がどのように取引しているかを理解しやすくしています。市場のトレンドを予測し、価格の動きを慎重に分析するのに優れています。機関の戦略とトレードを合わせることで、市場の動向についてより正確な予測ができます。このインジケーターは多目的であり、市場構造を分析し、重要な注文ブロックを特定し、さまざまなパターンを認識するのに優れています。 このインジケーターはBOSやCHoCHなどのパターンの識
現在20%OFF! 初心者やエキスパートトレーダーのためのベストソリューション! このダッシュボードソフトウェアは、28の通貨ペアで動作しています。それは私達の主要な指標(高度な通貨の強さ28と高度な通貨インパルス)の2に基づいています。それは全体の外国為替市場の大きい概観を与えます。それは、すべての(9)時間枠で28の外国為替ペアのための高度な通貨の強さの値、通貨の動きの速度と信号を示しています。チャート上で1つのインディケータを使用して市場全体を観察し、トレンドやスキャルピングの機会をピンポイントで見つけることができたら、あなたのトレードがどのように改善されるか想像してみてください。 このインディケータには、強い通貨と弱い通貨の識別、潜在的な取引の識別と確認がより簡単になるような機能が搭載されています。このインディケータは、通貨の強さや弱さが増加しているか減少しているか、また、すべての時間枠でどのように機能しているかをグラフィカルに表示します。 新機能として、現在の市場環境の変化に適応するダイナミックなマーケットフィボナッチレベルが追加され、すでに当社のAdvan
これはMT4のインジケーターで、再描画なしで取引に参入するための正確なシグナルを提供します。 外国為替、暗号通貨、金属、株式、インデックスなど、あらゆる金融資産に適用できます。かなり正確な見積もりを提供し、取引を開始して終了するのに最適な時期を教えてくれます。1つのシグナルを処理しただけでインジケーターの元が取れた例の 動画 (6:22)をご覧ください。Entry PointsPro インジケーターの助けを借りたほとんどのトレーダーの最初の1週間の結果が改善しています。 Telegramグループ に登録してください。Entry Points Proインジケーターのメリットは次の通りです。 再描画のないエントリーシグナル 再描画されるインジケーターでは一度表示されたシグナルが削除されて大きな金銭的損失につながることがありますが、これと異なり、表示されて確認されたシグナルは消えることがありません。 エラーなしの取引開始 インジケーターアルゴリズムによって取引を開始する(資産を売買する)理想的な瞬間を見つけることができます。それを使用するすべてのトレーダーの成功率が向上します。
Advanced Supply Demand
Bernhard Schweigert
4.92 (310)
現在33%オフ 初心者にもエキスパートトレーダーにも最適なソリューション このインジケーターは独自の機能と新しい公式を多数内蔵しており、ユニークで高品質かつ手頃な取引ツールです。このアップデートでは、2つの時間枠ゾーンを表示できるようになります。より長いTFだけでなく、チャートTFとより長いTF(ネストゾーンを表示)の両方を表示できます。すべてのSupply Demandトレーダーの皆さんのお気に召すはずです。:) 重要情報の公開 Advanced Supply Demandの可能性を最大化するには、 https://www.mql5.com/ja/blogs/post/720245 にアクセスしてください。   エントリーまたはターゲットの正確なトリガーポイントを正確に特定できれば取引がどのように改善されるか想像してみてください。新しい基盤となるアルゴリズムに基づいて構築されているため、買い手と売り手の間の潜在的な不均衡をさらに簡単に特定できます。これは、最も強い需要と供給のゾーンと、過去のパフォーマンス(古いゾーンを表示)がグラフィカルに表現されるためです。これらの機能は、最適
Step into the realm of Forex trading with confidence and precision using XQ, a cutting-edge Forex indicator designed to elevate your trading game to unprecedented heights. Whether you're a seasoned trader or just stepping into the world of currency exchange,   XQ Forex Indicator   empowers you with the insights and signals needed to make informed trading decisions. The signal conditions are a combination of three indicators, and XQ Forex Indicator only display  medium and long-term trends . The
TrendMaestro
Stefano Frisetti
5 (2)
note: this indicator is for METATRADER4, if you want the version for METATRADER5 this is the link: TRENDMAESTRO recognizes a new TREND in the bud, he never makes mistakes. The certainty of identifying a new TREND is priceless. DESCRIPTION TRENDMAESTRO identifies a new TREND in the bud, this indicator examines the volatility, volumes and momentum to identify the moment in which there is an explosion of one or more of these data and therefore the moment in which prices have strong probability of f
驚異的なFXインジケーター「Miraculous」をご紹介します。完璧な結果を得るための1時間足を含むすべてのタイムフレームで効果的に機能する、最強の強力な特殊MT4フォレックスインジケーターです。 すべてのタイムフレームで優れた結果を提供する最高のFXインジケーターを探し続けるのに疲れましたか?これ以上探す必要はありません!「Miraculous」フォレックスインジケーターをご紹介します。このインジケーターは、トレーディングの経験を変革し、収益を新たなレベルに引き上げるために設計されました。 先進のテクノロジーと長年にわたる緻密な開発に基づいて構築された「Miraculous」フォレックスインジケーターは、FX市場における力と正確さの頂点となります。この素晴らしいツールは、すべてのレベルのトレーダーのニーズを満たすように設計されており、一貫した収益性を追求する上で比類のない優位性を提供します。 「Miraculous」フォレックスインジケーターの他との違いは、その非常に適応性にあります。デイトレーダー、スウィングトレーダーであろうと、長期ポジションを好む方であろうと、このインジケータ
mql5と Telegramの モーニング・ブリーフィングで、詳細とスクリーンショットを含む毎日のマーケット・アップデートをご覧 ください! FX Power MT4 NGは 、長年の人気を誇る通貨強度計FX Powerの次世代モデルです。 この次世代ストレングスメーターは何を提供するのでしょうか?初代FXパワーの魅力すべて プラス GOLD/XAUの強さ分析 より正確な計算結果 個別に設定可能な分析期間 カスタマイズ可能な計算上限値により、さらに優れたパフォーマンスを実現 もっと見たい人のための特別なマルチインスタンス設定 すべてのチャートでお好みの色を無限に設定可能 数え切れないほどの通知オプションにより、重要なことを見逃すことはありません。 Windows 11とmacOSのスタイルで角を丸くした新しいデザイン 魔法のように動くインジケーターパネル FXパワーの主な機能 すべての主要通貨の強さの完全な履歴 すべての時間枠における通貨の強さの履歴 すべてのブローカーとチャートで同一の計算結果 100%信頼できるリアルタイム計算 -> リペイントなし ドロップダウン・リストから
ブレーカートレーダーになり、価格が反転すると市場構造からの利益が変化します。 注文ブロックブレーカーインジケーターは、トレンドまたは価格の動きが枯渇に近づいており、逆転の準備ができていることを識別します。通常、反転または大規模なプルバックが発生しようとしているときに発生する市場構造の変化について警告します。 この指標は、ブレイクアウトと価格の勢いを識別する独自の計算を使用します。使い果たされる可能性のあるポイントの近くで新しい高値が形成されるたびに、インディケーターはその高値の作成を担当する最後の注文ブロックを描きます。次に、移動する価格とともに注文ブロックを追跡します。その後、価格が反対方向にシフトし、その注文ブロックを突破すると、新しい市場構造を作成し、トレンドまたは大きな後退の可能性のある反転の開始を警告します。 注文ブロックは、高値/安値が作成される前の最後の反対色のろうそくであり、価格がこれらの重要な領域を下抜けすると、トレンドの短期的ま​​たは長期的な反転の兆候です。 特徴 重要な枯渇点での市場構造の変化を警告します 価格が使い果たされるレベルに近づくと、
複数通貨と複数フレームの売買に関するアラート。 自動トレーリングストップとリスク報酬で利益を獲得! インジケーターが市場をスキャンして分析するため、何もする必要はありません。 1 つのチャートですべての通貨を取引しましょう!   購入後、コメントを残して私に連絡してください。トレードアシスタントEAをお送りします。 このインジケーターはいくつかのオシレーターと付属のフィルターを使用して、最良の確認されたエントリーポイントを見つけますので、それについて心配する必要はありません。 警告が表示され、監視することを選択したすべての時間枠と通貨のボタンが描画されます。 ボタンを押すだけでチャートに移動し、取引を開始できます。 このインジケーターは、すべての基本通貨と市場監視通貨の強さパネルも描画します (設定で調整可能)。これにより、すべてのペアの通貨と選択されたより高い時間枠が表示されます。 インジケーターウィンドウ: チャート通貨のトレンドフィルターとマルチタイムフレームトレンドパネルを備えた特別なMACDヒストグラム! すべての通貨と時間枠の取引アラートを提供し、
ご紹介     Quantum Breakout PRO は 、ブレイクアウト ゾーンの取引方法を変革する画期的な MQL5 インジケーターです。 13年以上の取引経験を持つ経験豊富なトレーダーのチームによって開発された Quantum Breakout PROは 、革新的でダイナミックなブレイクアウトゾーン戦略により、あなたの取引の旅を新たな高みに押し上げるように設計されています。 クォンタム ブレイクアウト インジケーターは、5 つの利益ターゲット ゾーンを備えたブレイクアウト ゾーン上のシグナル矢印と、ブレイクアウト ボックスに基づいたストップロスの提案を提供します。 初心者トレーダーにもプロのトレーダーにも適しています。 量子EAチャネル:       ここをクリック MT5バージョン:   ここをクリック 重要!購入後、インストールマニュアルを受け取るためにプライベートメッセージを送ってください。 推奨事項: 時間枠: M15 通貨ペア: GBPJPY、EURJPY、USDJPY、NZDUSD、XAUUSD アカウントの種類: ECN、Raw、また
通貨強さウィザードは、取引を成功させるためのオールインワン ソリューションを提供する非常に強力な指標です。このインジケーターは、複数の時間枠のすべての通貨のデータを使用して、このまたはその外国為替ペアのパワーを計算します。このデータは、使いやすい通貨インデックスと通貨パワーラインの形式で表され、特定の通貨のパワーを確認するために使用できます。 必要なのは、取引したいチャートにインジケーターを接続することだけです。インジケーターは、取引する通貨の実際の強さを示します。このインジケーターは、トレンドに合わせて取引するときに有利に利用できる売買高の圧力の極値も示します。このインジケーターには、フィボナッチに基づく可能なターゲットも表示されます。 このインジケーターは、PUSH 通知を含むあらゆるタイプのアラートを提供します。 購入後ご連絡下さい。私の取引のヒントをあなたと共有し、素晴らしいボーナスインジケーターを無料で提供します! 幸せで有益な取引をお祈りします。
PRO Renko Systemは、特別にRENKOチャートを取引するために設計された高精度の取引システムです。 これは、様々な取引商品に適用することができる普遍的なシステムです。 システムは効果的に正確な逆転信号へのアクセスを与えるいわゆる市場の騒音を中和する。 表示器は非常に使いやすく、信号の生成に責任がある1つの変数だけがあります。 あなたは簡単にお好みの任意の取引ツールとレンコバーのサイズにツールを適応させることができます。 私はいつもあなたが私のソフトウェアで収益性の高い取引を支援するために余分なサポートを提供する準備ができています! 私はあなたに幸せで収益性の高い取引をしたいです! ご購入後にご連絡ください! 私はあなたに私のレンコチャートジェネレータを送信します。 私はまた、私の個人的な推奨事項やシステムの他のモジュールを無料で共有します!
TrendDecoder Premium
Christophe, Pa Trouillas
5 (3)
レンジと次の動きを特定    |  トレンドの最も早いシグナルと強さを得る   |  反転の前に明確な出口を得る   |  価格がテストするフィボ・レベルを見つける。 非リペイント、非遅延インディケータ - マニュアルおよび自動売買に最適 - すべての資産、すべての時間単位に対応 期間限定キャンペーン   >> 50%OFF 購入後、 推奨セッティングについては、このチャンネルで私に連絡してください。 MT5 バージョン: ここをクリック BladeSCALPER   と   PowerZONES   を使った完全な方法を入手する どのようなものですか? TrendDECODERは、トレンド監視をシンプルかつ簡単にするための複数のイノベーションを集約したものです。 Projective TrendLine (投影トレンドライン) - 今後のトレンドのスピードリファレンス。 RealTime TrendLine vs. Projective TrendLine (リアルタイムトレンドライン vs. Projective TrendLine) - 市場が同じ方
This indicator is unstoppable when combined with our other indicator called Katana. After purchase, send us a message and you could get Katana for FREE as a BONUS After purchase, send us a private message for your instructions.  MT5 version: click here There are limited copies available at $45. Next price is $99. Don't miss this great deal!  The Trend Forecasting indicator is a very unique & easy tool that is able to make prediction about future price movement based on the signals
カスタムMT4インジケーターで外国為替取引を成功させるための秘密を発見してください! 外国為替市場で成功を達成し、リスクを最小限に抑えながら一貫して利益を得る方法を疑問に思ったことはありますか? これがあなたが探している答えです! 取引へのアプローチに革命をもたらす独自のMT4インジケーターを導入できるようにします。 ユニークな汎用性 私たちのインジケータは、RenkoとRangeBarのろうそくのフォーメーションを好むユーザー向けに特別に設計されています。 これらのチャートタイプは多くの経験豊富なトレーダーに好まれていることを理解しています。そのため、私たちのインジケーターはそれらとシームレスに統合され、比類のない市場分析を提供します。 クリアトレンドシグナル 複雑な分析を忘れてください! 私たちのインジケーターは、鮮やかな色と明確なドット構造を利用して、市場の動向を明確に示しています。 赤と青の点は、価格の動きの方向性について疑いの余地がなく、取引の迅速な意思決定を可能にします。 HH/HL HL/LL戦略とのアライメント HH/HLおよびHL/LL構
TakePropips Donchian Trend Pro
Eric John Pajarillaga Aldana
4.82 (17)
TakePropips Donchian Trend Pro   (MT4) は、ドンチャン チャネルを使用してトレンドの方向を自動的に検出し、エントリーとエグジットの取引シグナルを提供する強力で効果的なツールです! この多機能インジケーターには、トレンド スキャナー、取引シグナル、統計パネル、スクリーナー、取引セッション、およびアラート履歴ダッシュボードが含まれます。取引シグナルを提供し、チャートを分析する時間を節約するように設計されています! ユーザー マニュアルとインストール ガイドは、ブログ投稿 (   https://www.mql5.com/en/blogs/post/751368   ) からダウンロードできます。 今日は 50% オフ! 98ドルから49ドルに値下げ! このインジケーターは、ストラテジー テスターでテストできます (ビジュアル モードを有効にします)。ライブ チャートでテストしたい場合は、7 日間の試用版を入手するようにメッセージを送ることもできます。 詳細については、説明の下にあるビデオ チュートリアルも利用できます。 ご不明な点やサポートが必
SALE NOW! Limited Time Offer! An exclusive indicator that utilizes an innovative algorithm to swiftly and accurately determine the market trend. The indicator automatically calculates opening, closing, and profit levels, providing detailed trading statistics. With these features, you can choose the most appropriate trading instrument for the current market conditions. Additionally, you can easily integrate your own arrow indicators into Scalper Inside Pro to quickly evaluate their statistics and
buy sell star indicator has a different algoritms then up down v6 and buy sell histogram indicators. so that i put this a another indicator on market. it is no repaint and all pairs and all time frame indicator. it need minimum 500 bars on charts. when  the white  x sign on the red histogram that is sell signals. when the white x sign on the blue  histogram that is sell signals. this indicator does not guarantie the win.price can make mowement on direction opposite the signals. this is multi tim
FX Volume
Daniel Stein
4.6 (35)
mql5と Telegramの モーニング・ブリーフィングで、詳細とスクリーンショットを含む毎日のマーケット・アップデートをご覧 ください! FX Volumeは、ブローカーの視点から市場のセンチメントをリアルに洞察する、最初で唯一の出来高インジケーターです。 ブローカーのような機関投資家が外国為替市場でどのようなポジションをとっているか、COTレポートよりもはるかに速く、素晴らしい洞察を提供します。 この情報をチャート上で直接見ることは、あなたの取引にとって真のゲームチェンジャーであり、画期的なソリューションです。 以下のようなユニークなマーケットデータ洞察から利益を得てください。 比率は 、通貨のロングポジションとショートポジションの比率をパーセントで表示します。 比率の変化は 、選択した期間内のロング比率とその変化率を表示します。 Volumes Totalは 、通貨の取引量(ロングとショート)の合計をロット単位で表示します。 Volumes Long :全通貨のロングポジションの取引量を表示します。 Volumes(ショート )は、全通貨のショートポジションの取引量を表示
Cycle Sniper
Elmira Memish
4.41 (34)
NEW YEAR SALE PRICE FOR LIMITED TIME!!! Please contact us after your purchase and we will send you the complimentary indicators to complete the system Cycle Sniper is not a holy grail but when you use it in a system which is explained in the videos, you will feel the difference. If you are not willing to focus on the charts designed with Cycle Sniper and other free tools we provide, we recommend not buying this indicator. We recommend watching the videos about the indiactor and system before pu
このインジケータは、手動および自動的な方法でチャートに描かれたハーモニックパターンを検出します。ユーザーマニュアルは、このリンクから参照できます: あなたのレビューを追加し、入手するために私たちに連絡してください。 この製品をmt4で試すための無料版があります。 GartleyおよびNenstarパターンを検出するために使用できます。 https://www.mql5.com/en/market/product/30181 完全なMT4バージョンを購入するには、次の場所から購入できます。 https://www.mql5.com/en/market/product/15212 注 インジケータにはコントロールパネルがあり、すべての(チャート&時間枠)設定が保存されます。チャート上でスペースをより多く確保するために、最小化することができ、他の分析ツールで作業する場合は、すべてのインジケータデータを非表示にするために閉じるボタンを押すことができます。 このインジケータを使用して設定を変更し、移動平均やボリンジャーバンドなどのインジケータを追加すると、編集のテンプレートが自動的に保存され、必
ADR反転インジケーターは、通常の1日の平均レンジに関連して価格が現在取引されている場所を一目で示します。価格が選択した平均範囲とレベルを超えると、ポップアップ、電子メール、またはプッシュを介して即座にアラートを受け取るため、プルバックと逆転にすばやくジャンプできます。インディケータは、チャート上に1日の平均レンジの極値で水平線を描画し、それらを超える価格の数学的確率が付加されているレベルを超える延長も描画します。詳細については、以下をご覧ください... インジケーターとモニターを補完するADRアラートダッシュボードここでも利用可能なすべてのペア:https:// www.mql5.com/en/market/product/62756 MT5バージョンはこちらからも入手できます:https:// www.mql5.com/en/market/product/64477/ 通常の1日平均レンジ(ADR)内で価格が取引され、これらのレベルを上回っている時間の約60%は、通常、その後の引き戻し(利益確定)の動きを伴う急激な価格の動きの指標です。毎日の範囲の上部または下部からの
作者のその他のプロダクト
There is already a test of version 5.70 (starting March 18, 2024)                          The ATR indicator (Average True Range) is a tool used to measure market volatility. It can be used to develop a trading strategy that takes into account daily and weekly price volatility. Here are some key points about using ATR in a trading strategy: Volatility Assessment: ATR helps understand how much the price of an asset has changed in a given period compared to previous periods. This is useful for as
The fact that round number levels have a significant influence on the market cannot be denied and should not be overlooked. These psychological levels are used by both retail Forex traders and major banks that deal in Forex.  Very simple and effective indicator and most importantly free. ////////////////////////////////////////////////////////////////////////////////////////////////////////////////////////////////////////////////////////////// The program does not work in the strategy tester.
FREE
Rediscover trading. The future of Forex is intuitive hybrids. Hello, my name is Szymon, I am a professional algorithm developer for trading on financial markets forex. Working experience in finance and programming for more than 10 years. I specialize in grid systems and martingale. Black Horse EA is an automated forex robot (this is not your usual grid or martingale). This EA trades based on the breakout of price levels (according to the mathematical algorithm, it determines the area of ​​a rang
This indicator displays the histogram and arrows on chart. When Simple The Best Pro are placed on a chart, they identify the trend.  The color of may be blue or red. The blue color stands for upside moves and the red color stands for downside trends. The indicator offers to set Stop Loss (SL) and  Take Profit (TP)  setting. The default value is ATR. Indicator has automatic optimization. The STB is a unique indicator that shows the tendency (button Bars) of a particular signals. The STB tells us
AMD Exclusive Two
Szymon Palczynski
4.5 (2)
One of the biggest problems you will face as trader is finding the right system for myself. AMD Exclusive Two can constitute a complete system for you. Don’t follow the arrows, without thinking twice. Trading using a whole system.  What we have? Automatic optimization Overbalance (manual, semi-automatic and automatic) Main and additional signals Fibonacci Pivot Linear Regression Channel Mini Tester Early warning system (yellow cloud on the chart) 3D effect Button On Chart Button [Start] - Star
Indicator basic idea is buy strong currency and sell weak currency. If A/B currency pair is in an uptrend, it shows if it is due to A strength or B weakness.On these signals one can choose the most optimal pair to trade. You can use Currency Power  System for pattern trading as well, among basic patterns which can be used are: cross trend break divergencies So much for theory.  I searched for a ready-made indicator (Currency Strength) to support my trade but did not find one. Well. I have to wr
Smart Grid Executor is an Expert Advisor built for MetaTrader 4 platform only. Smart Grid Executor will work on all account types and sizes on MetaTrader 4 brokers (outside of NFA regulations). Recommended leverage >= 1:500. Features Multicurrency EA Interval - H1 recommended Working with 4 and 5-digit brokers Working with Martingale Automatic multiplier Working with ECN Input Parameters Name - Smart Grid Executor v 4.00 Start - Short & Long, Only Long, Only Short. Time Frame [Recommended H1
V Max NX
Szymon Palczynski
Hundreds of possible combinations and only two strategies. By using automated software like an EA, you can benefit from the following advantages: it can trade while you are sleeping, it is not susceptible to emotions and you can quickly run backtests. However, it is hard to ascertain whether an EA will help you to achieve consistent profits. Lots of EAs are profitable on a demo account, but for some unknown reason, when the trader tries to apply it on a live account with their own funds, suddenl
AMD Trend Risk Reward is an indicator which belongs to the group of trend indicators. It provides the possibility to take the correct decisions about timely market entrances or exits. Trend horizontal can cause a lot of headaches to the traders and can be the reason of money loss. By automatic optimizing the settings of our AMD Trend Risk Reward indicator you can avoid most of them and save your money. How to choose the best chart? Press the button [O] on the chart. Indicator automatically optim
AMD Exclusive
Szymon Palczynski
5 (1)
AMD Exclusive characterized by high efficiency and can constitute a complete system. Indicator based on Price Action, Statistics and Overbalance. We encourage you to study indicator on its own until you know the tendencies of how it behaves relative to price movement. Indicator automatically optimizes time frame M15, M30, H1, H4, D1 and W1 (press the button [O] on the chart). Filter OVB (overbalance) has three modes: Manual [button F on chart]. Semi-automatic [button F on chart]. Automatic [butt
I am writing as is. Remember... "Another alarming fact can be a huge profit stated in the description of a trading robot. If the attached Strategy Tester reports show a sky-high balance, it most likely has to do with curve fitting. Often developers of such "money printing machines" do not even realize that their system is over-optimized and has too many external parameters. Let us support this assertion by another chart from the above-mentioned report   Optimization VS Reality: Evidence from ATC
Spider Bot Pro
Szymon Palczynski
3.67 (3)
No fabricated fake forward tests or meaningless optimized backtests. No artificial intelligence and similar things. In fact, there are frequently sharp differences between backtest results and actual results. One of the limitations of backtest is that they are generally prepared with the benefit of hindsight. Spider Bot Pro uses a developed innovative technology involving virtual grid. Simply put, Spider will build virtual grid in the background, using them to constantly monitor the market to he
Please Note:  The new version 3.10 default settings have been changed. If the default settings seem to bad for you this feel free to run a variation of your own settings. Remember to check the new EA for required margin and balance for your settings. Version 3.10 added the ability for greater profitability and slightly safer exits with 5 new parameters: - Multiplier - Next Multiplier - Take Profit (Chart) - Next Take Profit (Chart) - Repeated  The strategy is based on Bollinger Bands.
I personally love trading robots, but there are many situations where semi-auto trading is superior to automation. The system is very simple and effective.  Trend lines are typically used with price charts, however they can also be used with a range of technical analysis charts such as CCI and RSI.  What is the trend line?  Trend line is a bounding line for the price movement. It is formed when a diagonal line can be drawn between a minimum of three or more price pivot points. A line c
Multi-currency expert. Mission Impossible is a fully automated trading system on all major currency pairs. Very focused on small gains with minimizing the risk of loss (see  Entering/ Ellipse/Ellipse Size).  Advantage thanks to technique.  Not for complete amateurs taking too much risk !!! Forex is a risky business on itself - remember. Systems - Partial closing. - Run. - Open bar/ Every Tick.  Recommended: - VPS or Remote Desktop (e.g Chrome  Remote Desktop) Input Parameters Start Dep
Virtual Bot Pro will open virtual trades, using them to monitor the market to determine the entry point(according to the inputs parameters), at which point Virtual Bot Pro will start opening real trades.  It is recommended to test this Expert on demo account or cent account.  Input Parameters TF - the choice of time frame Start - choose whether you want to trade long or short positions only or both. Trend  Disabled  Enabled TF Trend - the choice of Time Frame for trend.   Spread - for 5 d
My new system... This is not a regular channel. Who is it for: - For people who want to understand the market. Tested and used in the real market (I use and not just encodes) Important !!! The system requires thinking. Only for real traders. If you are looking for a holy grail - please don't bother me. Is it possible? Trading has never been so easy. A combination of fibonacci and an intelligent channel plus levels of support and resistance. Setting out a channel is now very easy.
Veil
Szymon Palczynski
Dualistic indicator with multi-functional panel. Using trading indicators is part of any technical trader’s strategy. Paired with the right tools, it could help you gain more insight into price trends. The Veil indicator combines price points of a financial instrument over a specified time frame and makes summary calculations. In a nutshell, it identifies market trends, showing current support and resistance levels, and also forecasting future levels. Is the system important?  "The AMOUNT of m
Commercial version of open code . A forex trader can create a simple trading strategy to take advantage trading opportunities using MA Histogram or associated indicators. MA Histogram are used primarily as trend indicators and also identify support and resistance levels. Improved version 1.30 Added:  Take Profit  Stop Loss  Automatic optimization  Result  R/R  Consecutive losses
V Max
Szymon Palczynski
One of the most common Bollinger Band strategies is using them to gauge if a market is overbought or oversold.A lot of traders will use these bands and look for price to revert back the middle band or to the mean.When using a mean reversion strategy we are assuming that if price deviates or moves too far away from the mean it will eventually have to come back.This is often looked at as price moving back from an overbought or oversold market into more true value. Bollinger Bands react to price a
MA Histogram Pro is an expensive version of the indicator. It is equipped with the second Take Profit (TP) and is more equipped ( has a positive optimization method) than its cheaper brother.  Simple and effective system with automatic optimization. See my forecasts . MA Histogram are used primarily as trend indicators and also identify support and resistance levels. Equipment:  Take Profit 1    Take Profit 2   Stop Loss  Automatic optimization  Result  R/R  Consecutive losses
Envelopes System
Szymon Palczynski
5 (1)
The Simple Envelopes forex trading strategy combines the popular envelopes indicator and two others(ATR, Trend indicator) to look for trade entry  in the direction of the major trend. What are Moving Average Envelopes? A moving average envelope consists of a   moving average and two other lines . One line is above the moving average and the other line is below the moving average. Together, these two lines form an upper and lower envelope. Entry example:  Upper Envelope: 14-day SMA + (14-day S
Professional strategy This EA clearly controls the market and and performs a statistical price analysis.  The best technologies for professional trading: universal strategy that always works! All this is available in this versatile robot! What should be remembered. Some advice: Don't buy at the top and sell at the bottom.  Play with the main trend. Calculate your entry risk. If possible, it is better to choose the market, which is the most suitable for this trading strategy. If you do not have
Price reach indicator. It also serves as the perfect term for supports and resistance. I use it in two experts. The basic tool for professional trading. The indicator analyzes the last 500 bar and uses this to determine the levels ( but it doesn't predict the future ) . Personally, I use it on TF H1.  It is very simple. Four lines on chart and that's all. Only two input parameters.  Thousands of indicators. Why this? Is good ? No! Is very good. Please test the indicator prior to purchasing.
Rediscover trading. The future of Forex is intuitive hybrids. Hello, my name is Szymon, I am a professional algorithm developer for trading on financial markets forex. Working experience in finance and programming for more than 10 years. I specialize in grid systems and martingale. Black Horse EA is an automated forex robot (this is not your usual grid or martingale). This EA trades based on the breakout of price levels (according to the mathematical algorithm, it determines the area of ​​a ran
This EA clearly controls the market and performs a statistical price analysis.  The best technologies for professional trading: a universal strategy that always works! All this is available in this versatile robot! What should be remembered? Some advice: Don't buy at the top and sell at the bottom.  Play with the main trend. Calculate your entry risk. If possible, it is better to choose the market, which is the most suitable for this trading strategy. If you do not have a proven expert, you
Dual Space Time
Szymon Palczynski
5 (1)
Important !!! Only for real traders. If you are looking for a holy grail - please don't bother me. Multi-currency expert.          At the beginning, I suggest: EURUSD and GBPUSD               Tested in three steps ( Tester/Demo/Real  ) TF - H1  recommended Personally i use M1 for EURUSD only The most important thing is to get out of position                     "Stable version. Tester/Demo/Real ";                      "  Applied systems:";            "- Positioning system";          
Do you like to trade on EURUSD and GBPUSD?  This expert may be for you. Trading starts with pending orders: buylimit and selllimit. The second order is at the market price - the so-called probing order (reduces risk). Then the EA adjusts subsequent orders according to the market situation. Both the first and subsequent orders are closed based on a trailing stop. The expert selects the volume himself, as well as how many positions will be closed.          input start_enum      inp_start= 2 ; //S
The Forex grid trading strategy is a technique that seeks to make a profit on the natural movement of the market. The robot is designed to trade on GBPUSD, but can also trade on other pairs. EA has the advantage of simplicity and a unique position enhancer. What is important. Positions are opened at the close of the candle.  Input parameters: Start   Trend in pips. Comment; Max Spread (Digits 5) Slippage Magic Number  Stop Loss Take Profit (first position)  Average Take Profit  PipsStep for gr
Nimitz-type expert. Simply atomic. I am an automated trading geek but I think the future for me is hybrid trading. I think hybrid commerce has a huge future. While many grid traders finish up with huge drawdowns, I don't believe it is inevitable. Of course, risks are and always will be. Many of my testing and investigation suggests that grid (position averaging) trading is possible with consistently very modest drawdown. If achieved, this then makes grid trading a very attractive proposition. Ma
フィルタ:
NLM63
34
NLM63 2024.01.18 11:23 
 

Really nice for correlation.

Szymon Palczynski
14949
開発者からの返信 Szymon Palczynski 2024.01.19 12:28
Thanks
toomuchlbcake
274
toomuchlbcake 2022.10.15 19:10 
 

Helps tremendously with correlation trading. Thank you very much.

Antonio Jose Goncalves Ataide
163
Antonio Jose Goncalves Ataide 2021.03.19 18:43 
 

It does what I expected but must have an 2 or 3 lines explanation on how it works. You can manage to work but that would be nice

Emiliano La Rocca
86
Emiliano La Rocca 2020.08.25 07:05 
 

Excellent product in line with expectations.

レビューに返信
バージョン 1.40 2024.01.28
Font size added.
バージョン 1.30 2022.10.13
Add:
Send Notification
バージョン 1.20 2021.12.16
Currency Correlation Plus was compiled using a new compiler build.
バージョン 1.10 2016.01.28
Button Measure - fixed an error.