• 概要
  • レビュー (22)
  • コメント (124)
  • 最新情報

Blahtech Market Profile

4.61

Was: $249  Now: $99  

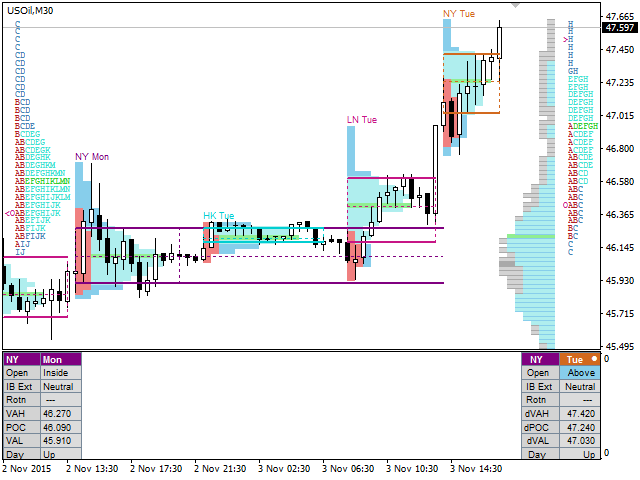
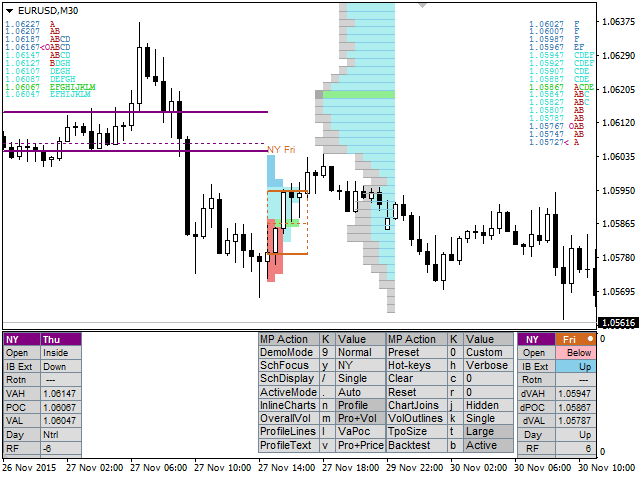
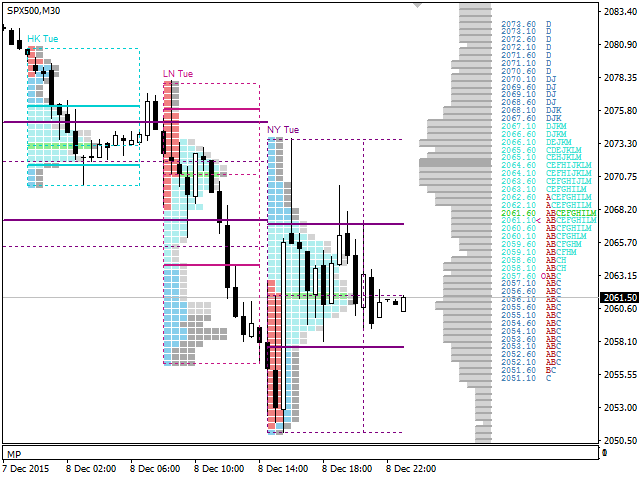
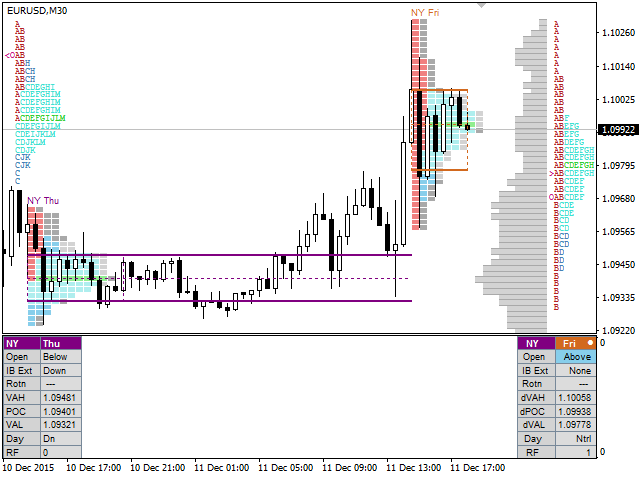
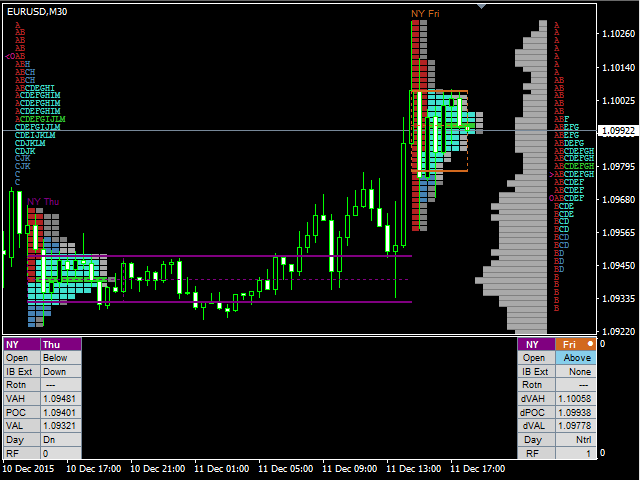
Market Profile defines a number of day types that can help the trader to determine market behaviour. A key feature is the Value Area, representing the range of price action where 70% of trading took place. Understanding the Value Area can give traders valuable insight into market direction and establish the higher odds trade. It is an excellent addition to any system you may be using.

Blahtech Limited presents their Market Profile indicator for the MetaTrader community. Inspired by Jim Dalton’s book “Mind Over Markets”, this indicator is designed to suit the needs of all profile traders. It delivers functionality usually only available on futures platforms and adds innovations like auto switching of focus and the backtest mode.

Links [ Documentation | Install | Update | Training All Products ]


Feature Highlights

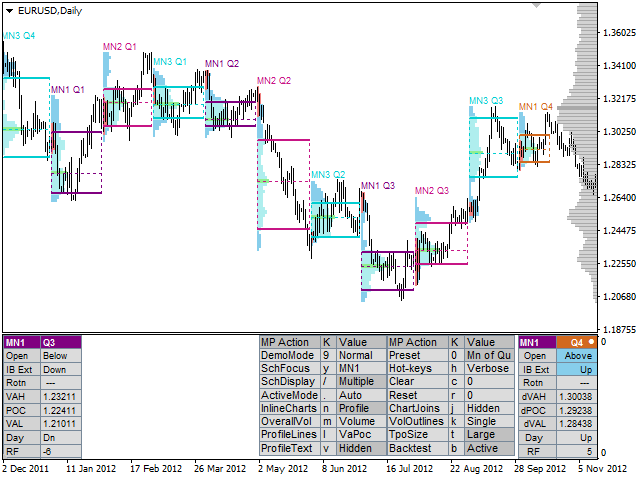
  • Configuration presets for schedules on higher timeframes
  • Auto switching of focus to next active session
  • Highlight of business rules – Open, IB Extension and Rotation Rules
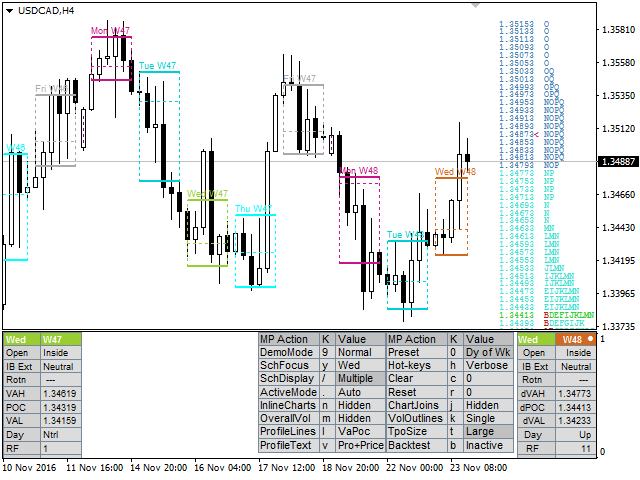
  • Multi-session display
  • Backtest directly on the chart
  • Custom session times
  • Custom intervals and timeframe period
  • Market and volume profiles
  • Overall market and volume profiles
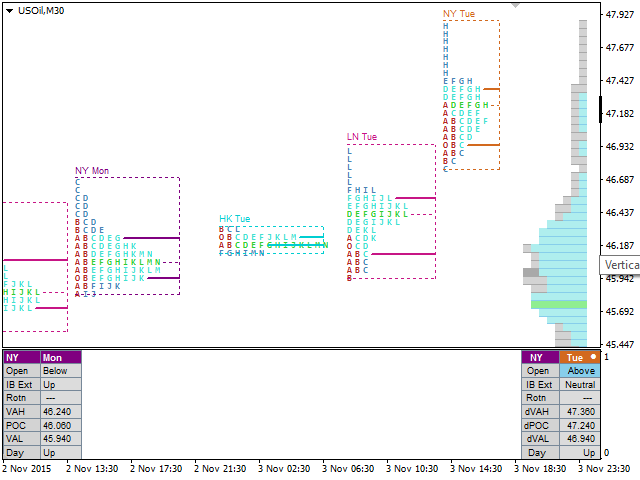
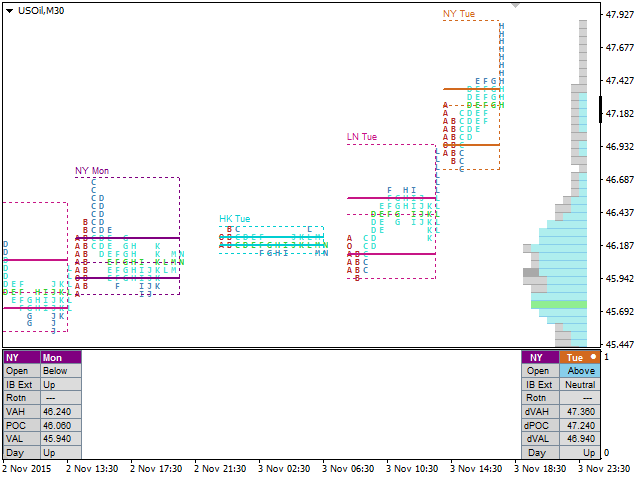
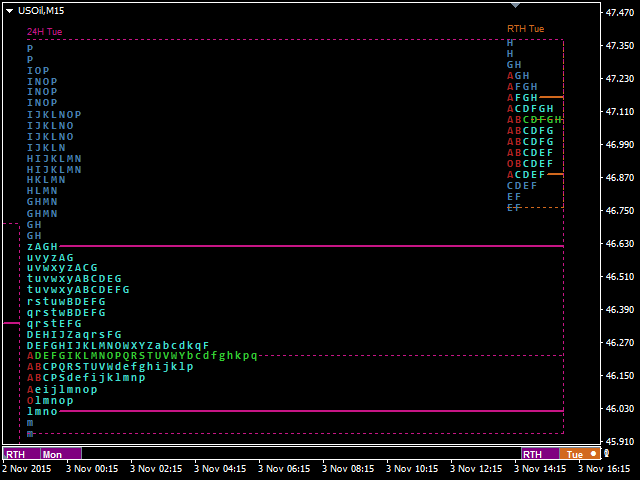
  • Text based TPO profiles
  • Configurable TPO start letter
  • Value area, Volume value area
  • Initial balance, Point of control
  • Fast access hot-keys


Developer buffers

Seven buffers, see full documentation for details


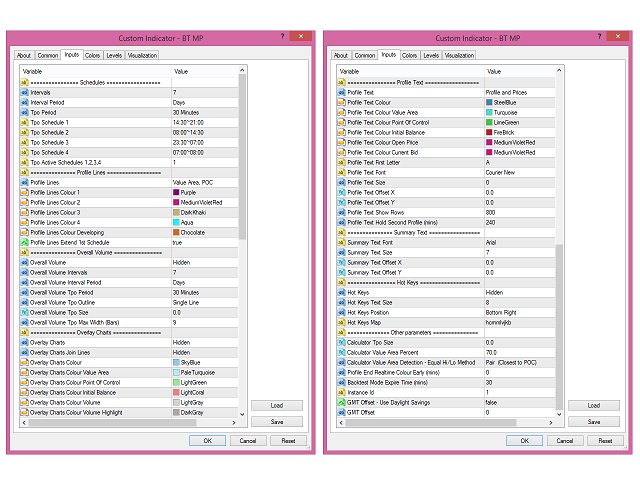
Input Parameters

Presets

  • Configuration Preset – Choose custom or predefined schedules. Hotkey “0”

Schedules

  • Intervals- Number of interval periods to display
  • Interval Period - Timeframe of the intervals (Days)
  • TPO Period - Timeframe for each TPO row (30 mins)
  • TPO size
  • TPO Schedule 1-7
  • TPO Schedule Names
  • TPO Schedule Display - Single / Multi. Hotkey “/”
  • TPO Schedule Active Mode - Auto/Man. Hotkey “.”
  • TPO Active Schedules - e.g. 2,1,3

Profile Lines

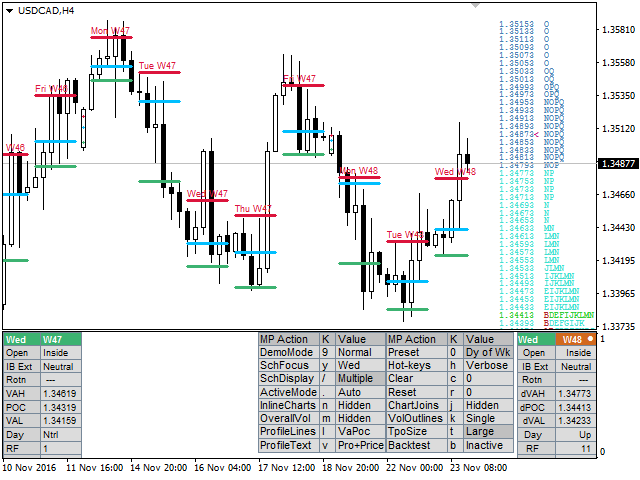
  • Profile Lines - Choose which lines are shown on chart. Hot-Key "L"
  • Profile Lines Colour 1-7, styles, fonts
  • Profile Lines Width Horizontal
  • Profile Lines Width Vertical - (0 to remove)
  • Profile Lines Titles - Choose the titles to be displayed on the chart
  • Profile Lines Extend Active Schedule - Extend previous active schedule lines to the next interval

Overall Volume

  • Overall Volume - Display graphic profile. Hot-Key "M"
  • Overall Volume Interval Period - Timeframe of the intervals (Days)
  • Overall Volume TPO Period - Timeframe for each TPO row (30 mins)
  • Overall Volume TPO size
  • Overall Volume TPO Outline - Outline style (Single line). Hot-Key "K"
  • Overall Volume TPO Size
  • Overall Volume TPO Offset (Bars)
  • Overall Volume Max Width (Bars)
  • Overall Volume Highlight Value Area
  • Overall Volume Custom Schedule

Overlay Charts

  • Overlay Charts - Display graphic profile. Hot-Key "N"
  • Overlay Charts Join Lines - Separators between each TPO. Hot-Key "J"
  • Overlay Charts Colours x7

Profile Text

  • Profile Text – Display text profile at the sides of the chart. Hot-Key "V"
  • Profile Text Colours x6
  • Profile Text Show Rows - Set limit for the maximum number of TPO rows to display
  • Profile Text First Letter - Start char for TPO letters (A)

Summary Text

  • Summary Text Font, Size, positions
  • Summary Text Composite Day Text

Hot Keys

  • Hot Keys - Display Hot Keys dialog. Hot-Key "H"
  • Hot Keys Text Size, Positions
  • Hot Key Map - Keyboard hot-key input map - Allows the user to re-assign the hot-keys

Other Parameters

  • Instance Id - Unique id for multiple instances per chart
  • Calculator Tpo Size Factor - Normal/Large TPO scaling. Hotkey “T”
  • Calculator Value Area Percent - TPO within the Value Area (70%)
  • Calculator Value Area Detection – Equal Hi/Low Method - Methodology when equal TPO above/below POC
  • Calculator Recalculate Tolerance (Percent TPO Size) – Schedules, Overall - Control price recalc triggers
  • Configuration Presets – Overall Volume Intervals – Override for presets
  • Profile End Realtime Colour Early (mins) - Stop the developing profile early
  • Backtest Mode Expire Time (mins) - Auto disable backtest
  • GMT Offset - Use Daylight Savings - Use Daylight savings. Adjust the time by 1 hour in March/September
  • GMT Offset - Manual GMT offset in seconds
レビュー 20
OldBoomer
19
OldBoomer 2023.04.17 12:00 
 

Amazing tool! I love the ability to switch between, sessions, daily, weekly and quarterly profiles instantly.

Ninerair929
41
Ninerair929 2021.09.15 16:53 
 

This system is worth every dollar. Back up service also good

efecetinel
111
efecetinel 2021.05.05 20:16 
 

Perfect. Just perfect. Thank you.

おすすめのプロダクト
これは、キャンドルの終値を予測する指標です。 このインジケータは、主にD1チャートでの使用を目的としていますが. この指標は、従来の外国為替取引とバイナリオプション取引の両方に適しています。 インジケーターは、スタンドアロンのトレーディングシステムとして使用することも、既存のトレーディングシステムへの追加として機能させることもできます。 このインジケーターは、現在のキャンドルを分析し、キャンドル自体の内部の特定の強度係数と、前のキャンドルのパラメーターを計算します。 したがって、この指標は、市場の動きのさらなる方向性と現在のキャンドルの終値を予測します。 この方法のおかげで、この指標は、短期の日中取引だけでなく、中期および長期の取引にも適しています。 インジケーターを使用すると、市場の状況の分析中にインジケーターが生成する潜在的な信号の数を設定できます。 インジケーターの設定には、このための特別なパラメーターがあります。 また、インジケーターは、チャート上のメッセージの形式で、電子メールで、およびPUSH通知の形式で、新しい信号について通知することができます。 購入後は必ず私に書いて
A technical indicator that calculates its readings on trading volumes. In the form of a histogram, it shows the accumulation of the strength of the movement of the trading instrument. It has independent calculation systems for bullish and bearish directions. Works on any trading instruments and time frames. Can complement any trading system. The indicator does not redraw its values, the signals appear on the current candle. It is easy to use and does not load the chart, does not require additi
BoxChart MT4
Evgeny Shevtsov
4.57 (7)
The market is unfair if only because 10% of participants manage 90% of funds. An ordinary trader has slim changes to stand against these "vultures". This problem can be solved. You just need to be among these 10%, learn to predict their intentions and move with them. Volume is the only preemptive factor that faultlessly works on any timeframe and symbol. First, the volume appears and is accumulated, and only then the price moves. The price moves from one volume to another. Areas of volume accumu
The Chaikin Oscillator is a technical indicator developed by Marc Chaikin that combines price and volume data to measure the accumulation and distribution of a financial instrument. It aims to identify potential buying and selling opportunities in the market. The Chaikin Oscillator is calculated by subtracting a 10-day exponential moving average of the Accumulation Distribution Line (ADL) from a 3-day exponential moving average of the ADL. Here's how to use the Chaikin Oscillator indicator in tr
インディケータは現在のクオートを作成し、これを過去のものと比較して、これに基づいて価格変動予測を行います。インジケータには、目的の日付にすばやく移動するためのテキスト フィールドがあります。 オプション: シンボル - インジケーターが表示するシンボルの選択; SymbolPeriod - 指標がデータを取る期間の選択; IndicatorColor - インジケータの色; HorisontalShift - 指定されたバー数だけインディケータによって描画されたクオートのシフト; Inverse - true は引用符を逆にします。false - 元のビュー。 ChartVerticalShiftStep - チャートを垂直方向にシフトします (キーボードの上下矢印)。 次は日付を入力できるテキストフィールドの設定で、「Enter」を押すとすぐにジャンプできます。
Was: $299  Now: $99   Supply Demand uses previous price action to identify potential imbalances between buyers and sellers. The key is to identify the better odds zones, not just the untouched ones. Blahtech Supply Demand indicator delivers functionality previously unavailable on any trading platform. This 4-in-1 indicator not only highlights the higher probability zones using a multi-criteria strength engine, but also combines it with multi-timeframe trend analysis, previously confirmed swings
TWO PAIRS SQUARE HEDGE METER INDICATOR Try this brilliant 2 pairs square indicator It draws a square wave of the relation between your two inputs symbols when square wave indicates -1 then it is very great opportunity to SELL pair1 and BUY Pair2 when square wave indicates +1 then it is very great opportunity to BUY pair1 and SELL Pair2 the inputs are : 2 pairs of symbols         then index value : i use 20 for M30 charts ( you can try other values : 40/50 for M15 , : 30 for M30 , : 10 for H1 ,
The indicator allows you to trade binary options. The recommended time frame is М1 and the expiration time is 1,2,3 minutes. The indicator suitable for auto and manual trading. A possible signal is specified as a arrows above/under a candle. You should wait until the candle closes! Arrows are not re-painted Trade sessions: TOKYO section (Half-end) Currency pairs: USD/JPY Working time frame: M1 Expiration time: 1,2,3 minutes. The indicator also shows good results when using the martingale strateg
FREE
Noize Absorption Index - is the manual trading system that measures the difference of pressure between bears forces and bulls forces. Green line - is a noize free index that showing curent situation. Zero value of index shows totally choppy/flat market.Values above zero level shows how powerfull bullish wave is and values below zero measures bearish forces.Up arrow appears on bearish market when it's ready to reverse, dn arrow appears on weak bullish market, as a result of reverse expectation. S
This unique multi-currency strategy simultaneously determines the strength of trends and market entry points, visualizing this using histograms on the chart. The indicator is optimally adapted for trading on the timeframes М5, М15, М30, Н1. For the convenience of users, the indicator renders the entry point (in the form of an arrow), recommended take profit levels (TP1, TP2 with text labels) and the recommended Stop Loss level. The take profit levels (TP1, TP2) are automatically calculated for
This indicator displays the histogram and arrows on chart. When Simple The Best Pro are placed on a chart, they identify the trend.  The color of may be blue or red. The blue color stands for upside moves and the red color stands for downside trends. The indicator offers to set Stop Loss (SL) and  Take Profit (TP)  setting. The default value is ATR. Indicator has automatic optimization. The STB is a unique indicator that shows the tendency (button Bars) of a particular signals. The STB tells us
Descption: The Volume Profile displays detailed informations of historical trading activities at certain price levels (Market Profile). So you can locate the areas with the best prices in the market and get an advantage about other market participants. Support: Please do not hesitate to contact me via the MQL5 Platform. I am very grateful about any Bug report, so that i can constantly improve the indicator. I also appreciate any public review for this product.  Features: Customizable Volume
This is a trend indicator without redrawing Developed instead of the binary options strategy (by the color of the Martingale candlestick) Also works well in forex trading When to open trades (binary options) A signal will appear in the place with a candle signaling the current candle It is recommended to open a deal for one candle of the current timeframe M1 and M5 When a blue dot appears, open a deal up When a red dot appears, open a trade down. How to open trades on Forex. When a signal is rec
The Volume by Price Indicator for MetaTrader 4 features Volume Profile and Market Profile TPO (Time Price Opportunity). Get valuable insights out of currencies, equities and commodities data. Gain an edge trading financial markets. Volume and TPO histogram bar and line charts. Volume Footprint charts. TPO letter and block marker charts including split structures. Versatile segmentation and compositing methods. Static, dynamic and flexible ranges with relative and/or absolute visualizations. Lay
VR Calculate Martingale インジケータは、収益または損失を計算するための注文とポジションの強力な計算ツールです。 注文とポジションの計算ツールを使用して、トレーダーは通貨、株式、通貨の暗号など、あらゆる為替の平均価格を計算できます。 これで、インジケータを接続して、実際の注文と位置に仮想注文を重ねて表示する機能を開始できます。 追加の仮想位置を作成することで、任意のイベントを計算できます。 インジケータには、ロット計算機、ポジション平均化計算機、テイク損益計算機、ストップロスレベル計算機が含まれます。 特別な機能を使用すると、現在の価格のあらゆる方向への移動をシミュレートし、 1 つまたは複数のポジションの利益または損失を計算できます。 購入や販売のポジションはたくさんありますか? VR Calculate Martingale - すべてのポジションをゼロまたは小さな利益でクローズできる平均価格を計算します。 平均価格で注文をグループ化し、 1 つ以上のポジションをクローズするための最も収益性の高いソリューションを見つけることができます。 テクニカルサポート、設
Market Profile 3
Hussien Abdeltwab Hussien Ryad
4 (4)
Market Profile 3 MetaTrader 4 indicator  — is a classic Market Profile implementation that can show the price density over time, outlining the most important price levels, value area, and control value of a given trading session. This indicator can be attached to timeframes between M1 and D1 and will show the Market Profile for daily, weekly, monthly, or even intraday sessions. Lower timeframes offer higher precision. Higher timeframes are recommended for better visibility. It is also possible t
FREE
インディケータは、フィボナッチのサポートとレジスタンスのレベルを自動的に計算してプロットします。これは、市場分析に最も効果的なツールの1つです。 計算では、選択した期間と時間枠の平均価格データが使用されます。この期間の最小値と最大値は、移動の開始と終了と見なされます。 フィボナッチレベルを使用すると、価格の動きが遅くなったり逆転したりする可能性のある潜在的な参照ポイントを確認できます。つまり、フィボナッチレベルは、さらなる動きを予測したり、ストップ注文や指値注文を行うために使用されます。 パラメーター: PartsShow-現在のバーから表示された履歴レベルの数 CalcPeriod-価格平均期間 SmoothingMethod-価格平均化方法(26オプション) TF-計算に使用される時間枠 LevelColor-レベルラインの色 ZeroLevelColor-ゼロレベルの色 ShowVerticalLine-レベル間の垂直線の表示を有効/無効にします VLineStyle-垂直線のスタイル VLineColor-垂直線の色 ShowInfo-レベルパーセンテージの値に関する情報をラベ
トレンドトレーディング は、タイミングのプルバックとブレイクアウトにより、市場で起こっているトレンドから可能な限り利益を得るように設計された指標です。確立されたトレンドの中で価格が何をしているかを分析することにより、取引の機会を見つけます。 [ インストールガイド | 更新ガイド | トラブルシューティング | よくある質問 | すべての製品 ] 自信を持って効率的に金融市場を取引する むち打ちにならずに確立されたトレンドから利益を得る 収益性の高いプルバック、ブレイクアウト、早期の逆転を認識する この指標は、独自の品質とパフォーマンスを分析します 複数時間枠のダッシュボードを実装します インジケーターは再描画されていません 電子メール/音声/視覚アラートを実装します 確立されたトレンドは多くの取引機会を提供しますが、ほとんどのトレンド指標はそれらを完全に無視しています。インジケーターの解釈はかなり簡単です: (1) トレンドの変化 (2) トレンドの方向への後退 (3) トレンドの方向へのブレイクアウト 赤いダッシュ は下降トレンド中の修正です 青いダッシュ は上昇ト
For sure, this indicator has become very popular amongst traders. Through coding this indicator will give you the most accurate levels possible for your trading analysis. We have also added in the ability for you to receive alerts when the price breaks above or below a Support or Resistance lines! HOW TO USE The red rectangles represent your resistance/supply zone. The green rectangles represent your support/demand zone.  BONUS FEATURES We coded this indicator with the ability to switch between
Owl smart levels
Sergey Ermolov
4.63 (54)
MT5版  |   FAQ Owl Smart Levels Indicator   は、 Bill Williams   の高度なフラクタル、市場の正しい波構造を構築する Valable ZigZag、エントリの正確なレベルをマークする Fibonacci レベルなどの一般的な市場分析ツールを含む 1 つのインジケーター内の完全な取引システムです。 利益を得るために市場と場所に。 戦略の詳細な説明 インジケータを操作するための指示 顧問-取引助手 プライベートユーザーチャット ->購入後に私に書いて、私はプライベートチャットにあなたを追加し、あなたはそこにすべてのボーナスをダウンロードすることができます 力はシンプルさにあります! Owl Smart Levels   取引システムは非常に使いやすいので、専門家にも、市場を勉強し始めて自分で取引戦略を選択し始めたばかりの人にも適しています。 戦略と指標に秘密の数式や計算方法が隠されているわけではなく、すべての戦略指標は公開されています。 Owl Smart Levels を使用すると、取引を開始するためのシグナルをすばやく確認し、
VN Trade Panel II
Vyacheslav Nekipelov
4 (1)
The new version of the trading panel, which now has the ability to separately close Buy and Sell orders, display targets for all orders on the chart, as well as the ability to use the panel to trade with brokers working on the FIFO rule. Also, the new version adds option buttons for separate management of open orders. It has a convenient visualized interface and intuitive control without a lot of additional tabs to which traders have to be distracted and switch their attention. Thanks to this
Forex Gump
Andrey Kozak
2.83 (6)
Forex Gump is a fully finished semi-automatic trading system. In the form of arrows, signals are displayed on the screen for opening and closing deals. All you need is to follow the instructions of the indicator. When the indicator shows a blue arrow, you need to open a buy order. When the indicator shows a red arrow, you need to open a sell order. Close orders when the indicator draws a yellow cross. In order to get the most effective result, we recommend using the timeframes H1, H4, D1. There
フィボナッチリトレースと拡張ラインツール DiNapoliポイント取引方法とゴールデンセクション取引を使用するトレーダーにとって理想的なMT4プラットフォームのフィボナッチリトレースと拡張ラインツール 主な特長: あなたはフィボナッチリトレースメントの複数のセットを直接描くことができ、重要なリターンポイント間の関係は一目瞭然です。 2.フィボナッチ拡張を描画することができます。 3.フィボナッチフォールドバックとラインの延長は、簡単な観察と数値表示のために左右に動かすことができます。 4.チャートは非常に爽やかな 5.数字キーでサイクルを切り替えることができます。 ファンクションキー: 1。 [戻るを押す、要求に応じて描画する、最大8つのグループにする 2。拡張]を描くには[押す] 3。 \を押すと、現在のサイクルの下にあるすべての拡張機能と折り畳みが削除されます 4。フォールドバックを移動して削除して展開する (1)最初のフォールドバックセットのF5行をクリックします。 一度クリックすると(黄色に変わります)、キーボードのDel
Features Supports the creation of Monthly, Weekly, Daily, 4 Hours, 1 Hours and 30 Minutes Market Profile. Daily Profile can have custom start time. Merge and Split of Market Profile Market Profile References Point can be exported to CSV format for any further analysis. Indicator Parameters Indicator Update Interval - Choose indicator calculation period from 250 milliseconds to 2.5 seconds Indicator Setting ID - An ID for this particular indicator setting. Profile Number - The Number of Market
Старый, добрый "AP" в версии трендового осциллятора. Это простой индикатор, который использует максимум возможностей языка MQL4. Но при этом он работает достаточно быстро даже на процессорах 1 Гигагерц и менее. При анализе следует обращать внимание на пересечение уровня 50, если вы намеренны использовать его как трендовый индикатор. Индикатор не перерисовывает, и работает на всех типах графиков и таймфреймах. Сделаны основные возможности оповещения, оповещения работают в обоих направлениях
The Th3Eng PipFinite indicator is based on a very excellent analysis of the right trend direction with perfect custom algorithms. It show the true direction and the best point to start trading. With StopLoss point and Three Take Profit points. Also it show the right pivot of the price and small points to order to replace the dynamic support and resistance channel, Which surrounds the price. And Finally it draws a very helpful Box on the left side on the chart includes (take profits and Stop loss
A tall upper shadow occurs when the price moves during the period, but goes back down, which is a bearish signal. A tall lower shadow forms when bears push the price down, but bulls pull it back up, which leaves a long line or shadow. This is considered a bullish signal. Some technical analysts believe a tall or long shadow means the stock will turn or reverse. Some believe a short or lower shadow means a price rise is coming. In other words, a tall upper shadow means a downturn is coming, whil
The Point61 indicator is the result of many years of monitoring of price behavior of currency pairs and metals. It is not a secret, that in times of uncertainty, traders are looking for possible levels of support and resistance - the point, where price should stop its movement. There are 2 possible scenarios at these points: 1. Reverse (correction) to the opposite direction; 2. Breakthrough to continue movement. Very often these points are used to set stop orders - TakeProfit or
VR Cub
Vladimir Pastushak
VR Cub は、質の高いエントリーポイントを獲得するためのインジケーターです。このインジケーターは、数学的計算を容易にし、ポジションへのエントリーポイントの検索を簡素化するために開発されました。このインジケーターが作成されたトレーディング戦略は、長年にわたってその有効性が証明されてきました。取引戦略のシンプルさはその大きな利点であり、初心者のトレーダーでもうまく取引することができます。 VR Cub はポジション開始ポイントとテイクプロフィットとストップロスのターゲットレベルを計算し、効率と使いやすさを大幅に向上させます。取引の簡単なルールを理解するには、以下の戦略を使用した取引のスクリーンショットを見てください。 設定、設定ファイル、デモ版、説明書、問題解決方法は、以下から入手できます。 [ブログ] レビューを読んだり書いたりすることができます。 [リンク] のバージョン [MetaTrader 5] エントリーポイントの計算ルール ポジションをオープンする エントリーポイントを計算するには、VR Cub ツールを最後の高値から最後の安値までストレッチする必要があります。
このプロダクトを購入した人は以下も購入しています
驚異的なFXインジケーター「Miraculous」をご紹介します。完璧な結果を得るための1時間足を含むすべてのタイムフレームで効果的に機能する、最強の強力な特殊MT4フォレックスインジケーターです。 すべてのタイムフレームで優れた結果を提供する最高のFXインジケーターを探し続けるのに疲れましたか?これ以上探す必要はありません!「Miraculous」フォレックスインジケーターをご紹介します。このインジケーターは、トレーディングの経験を変革し、収益を新たなレベルに引き上げるために設計されました。 先進のテクノロジーと長年にわたる緻密な開発に基づいて構築された「Miraculous」フォレックスインジケーターは、FX市場における力と正確さの頂点となります。この素晴らしいツールは、すべてのレベルのトレーダーのニーズを満たすように設計されており、一貫した収益性を追求する上で比類のない優位性を提供します。 「Miraculous」フォレックスインジケーターの他との違いは、その非常に適応性にあります。デイトレーダー、スウィングトレーダーであろうと、長期ポジションを好む方であろうと、このインジケータ
現在20%OFF! 初心者やエキスパートトレーダーのためのベストソリューション! このダッシュボードソフトウェアは、28の通貨ペアで動作しています。それは私達の主要な指標(高度な通貨の強さ28と高度な通貨インパルス)の2に基づいています。それは全体の外国為替市場の大きい概観を与えます。それは、すべての(9)時間枠で28の外国為替ペアのための高度な通貨の強さの値、通貨の動きの速度と信号を示しています。チャート上で1つのインディケータを使用して市場全体を観察し、トレンドやスキャルピングの機会をピンポイントで見つけることができたら、あなたのトレードがどのように改善されるか想像してみてください。 このインディケータには、強い通貨と弱い通貨の識別、潜在的な取引の識別と確認がより簡単になるような機能が搭載されています。このインディケータは、通貨の強さや弱さが増加しているか減少しているか、また、すべての時間枠でどのように機能しているかをグラフィカルに表示します。 新機能として、現在の市場環境の変化に適応するダイナミックなマーケットフィボナッチレベルが追加され、すでに当社のAdvan
TPSpro TRENDPRO  - is a trend indicator that automatically analyzes the market and provides information about the trend and each of its changes, as well as giving signals for entering trades without redrawing! The indicator uses each candle, analyzing them separately. referring to different impulses - up or down impulse. Exact entry points into transactions for currencies, crypto, metals, stocks, indices!  -  Version MT5               DETAILED DESCRIPTION        /       TRADING SETUPS           
A key element in trading is zones or levels from which decisions to buy or sell a trading instrument are made. Despite attempts by major players to conceal their presence in the market, they inevitably leave traces. Our task was to learn how to identify these traces and interpret them correctly. Reversal First Impulse levels (RFI)   -  Version MT5                INSTRUCTIONS                 RUS                 ENG                                       R ecommended to use with an indicator   -  
現在26%オフ 初心者やエキスパートトレーダーに最適なソリューション! このインジケーターは、独自の機能と新しい計算式を取り入れた、ユニークで高品質、かつ手頃な価格のトレーディングツールです。たった1枚のチャートで28の為替ペアの通貨強度を読み取ることができます。新しいトレンドやスキャルピングチャンスの引き金となるポイントを正確に特定することができるので、あなたのトレードがどのように改善されるか想像してみてください。 ユーザーマニュアルはこちら  https://www.mql5.com/en/blogs/post/697384 これが最初の1本、オリジナルだ! 価値のないクローンを買わないでください。 特別な サブウィンドウの矢印で強い通貨の勢いを表示 GAPがあなたのトレードを導く! 基準通貨や気配値が売られすぎ・買われすぎのゾーン(外相フィボナッチレベル)にあるとき、個別チャートのメインウィンドウに警告表示。 通貨がレンジの外側から反落した場合、プルバック/リバーサルのアラート。 クロスパターンの特別なアラート 複数の時間枠を選択可能で、トレンドを素早く
まず第一に、この取引インジケーターは再描画されず、再描画されず、遅延しないことを強調する価値があります。これにより、手動取引とロボット取引の両方に理想的なものになります。 アトミックアナリストは、価格の強さとモメンタムを利用して市場でより良いエッジを見つけるためのPA価格アクションインジケーターです。ノイズや誤ったシグナルを除去し、取引ポテンシャルを高めるための高度なフィルターを備えています。複雑なインジケーターの複数のレイヤーを使用して、アトミックアナリストはチャートをスキャンし、複雑な数学的計算をシンプルなシグナルと色に変換します。これにより、どのような初心者トレーダーでも理解して使用し、一貫した取引の決定を行うことができます。 「アトミックアナリスト」は、新規および経験豊富なトレーダー向けにカスタマイズされた包括的な取引ソリューションです。プレミアムインジケーターとトップノッチの機能を1つの取引戦略に組み合わせ、すべてのタイプのトレーダーにとって汎用性のある選択肢にします。 デイリートレーディングとスキャルピング戦略:高速で正確なデイトレーディングおよび短期トレード
An exclusive indicator that utilizes an innovative algorithm to swiftly and accurately determine the market trend. The indicator automatically calculates opening, closing, and profit levels, providing detailed trading statistics. With these features, you can choose the most appropriate trading instrument for the current market conditions. Additionally, you can easily integrate your own arrow indicators into Scalper Inside Pro to quickly evaluate their statistics and profitability. Scalper Inside
TrendMaestro
Stefano Frisetti
5 (2)
note: this indicator is for METATRADER4, if you want the version for METATRADER5 this is the link: TRENDMAESTRO recognizes a new TREND in the bud, he never makes mistakes. The certainty of identifying a new TREND is priceless. DESCRIPTION TRENDMAESTRO identifies a new TREND in the bud, this indicator examines the volatility, volumes and momentum to identify the moment in which there is an explosion of one or more of these data and therefore the moment in which prices have strong probability of f
Step into the realm of Forex trading with confidence and precision using XQ, a cutting-edge Forex indicator designed to elevate your trading game to unprecedented heights. Whether you're a seasoned trader or just stepping into the world of currency exchange,   XQ Forex Indicator   empowers you with the insights and signals needed to make informed trading decisions. The signal conditions are a combination of three indicators, and XQ Forex Indicator only display  medium and long-term trends . The
Advanced Supply Demand
Bernhard Schweigert
4.92 (310)
現在33%オフ 初心者にもエキスパートトレーダーにも最適なソリューション このインジケーターは独自の機能と新しい公式を多数内蔵しており、ユニークで高品質かつ手頃な取引ツールです。このアップデートでは、2つの時間枠ゾーンを表示できるようになります。より長いTFだけでなく、チャートTFとより長いTF(ネストゾーンを表示)の両方を表示できます。すべてのSupply Demandトレーダーの皆さんのお気に召すはずです。:) 重要情報の公開 Advanced Supply Demandの可能性を最大化するには、 https://www.mql5.com/ja/blogs/post/720245 にアクセスしてください。   エントリーまたはターゲットの正確なトリガーポイントを正確に特定できれば取引がどのように改善されるか想像してみてください。新しい基盤となるアルゴリズムに基づいて構築されているため、買い手と売り手の間の潜在的な不均衡をさらに簡単に特定できます。これは、最も強い需要と供給のゾーンと、過去のパフォーマンス(古いゾーンを表示)がグラフィカルに表現されるためです。これらの機能は、最適
ご紹介   クォンタム トレンド スナイパー インジケーターは 、トレンド反転を特定して取引する方法を変革する画期的な MQL5 インジケーターです。 13年以上の取引経験を持つ経験豊富なトレーダーのチームによって開発されました。     クォンタムトレンドスナイパーインジケーター   は、非常に高い精度でトレンドの反転を識別する革新的な方法で、あなたのトレーディングの旅を新たな高みに押し上げるように設計されています。 ***Quantum Trend Sniper Indicatorを購入すると、Quantum Breakout Indicatorを無料で入手できます!*** クォンタム ブレイクアウト インジケーターは、トレンドの反転を特定するとアラートを発し、矢印を示し、3 つのテイクプロフィットレベルを提案します。 初心者トレーダーにもプロのトレーダーにも適しています。 量子EAチャネル:       ここをクリック MT5のバージョン:       ここをクリック 推奨事項: 期間: すべての時間枠。最良の結果を得るには、
ご紹介     Quantum Breakout PRO は 、ブレイクアウト ゾーンの取引方法を変革する画期的な MQL5 インジケーターです。 13年以上の取引経験を持つ経験豊富なトレーダーのチームによって開発された Quantum Breakout PROは 、革新的でダイナミックなブレイクアウトゾーン戦略により、あなたの取引の旅を新たな高みに押し上げるように設計されています。 クォンタム ブレイクアウト インジケーターは、5 つの利益ターゲット ゾーンを備えたブレイクアウト ゾーン上のシグナル矢印と、ブレイクアウト ボックスに基づいたストップロスの提案を提供します。 初心者トレーダーにもプロのトレーダーにも適しています。 量子EAチャネル:       ここをクリック MT5バージョン:   ここをクリック 重要!購入後、インストールマニュアルを受け取るためにプライベートメッセージを送ってください。 推奨事項: 時間枠: M15 通貨ペア: GBPJPY、EURJPY、USDJPY、NZDUSD、XAUUSD アカウントの種類: ECN、Raw、また
ON Trade Waves Patterns Harmonic Elliot Wolfeをご紹介します。これは手動および自動の方法を使用して市場のさまざまなパターンを検出するために設計された高度なインジケーターです。以下はその動作方法です: ハーモニックパターン: このインジケーターは、チャートに表示されるハーモニックパターンを識別できます。これらのパターンは、Scott Carneyの「Harmonic Trading vol 1および2」で説明されているように、ハーモニックトレーディング理論を実践するトレーダーにとって重要です。手動で描画するか、自動検出に頼るかにかかわらず、ON Trade Waves Patternsがお手伝いします。 コントロールパネル: このインジケーターはユーザーフレンドリーなコントロールパネルを備えています。チャートと時間枠の設定を保存し、異なる構成間をスムーズに切り替えることができます。チャートスペースを最大限に活用するために最小化することもできます。他の分析ツールで作業することを好む場合、閉じるボタンをクリックするだけで、すべてのインジケーターデ
mql5と Telegramの モーニング・ブリーフィングで、詳細とスクリーンショットを含む毎日のマーケット・アップデートをご覧 ください! FX Power MT4 NGは 、長年の人気を誇る通貨強度計FX Powerの次世代モデルです。 この次世代ストレングスメーターは何を提供するのでしょうか?初代FXパワーの魅力すべて プラス GOLD/XAUの強さ分析 より正確な計算結果 個別に設定可能な分析期間 カスタマイズ可能な計算上限値により、さらに優れたパフォーマンスを実現 もっと見たい人のための特別なマルチインスタンス設定 すべてのチャートでお好みの色を無限に設定可能 数え切れないほどの通知オプションにより、重要なことを見逃すことはありません。 Windows 11とmacOSのスタイルで角を丸くした新しいデザイン 魔法のように動くインジケーターパネル FXパワーの主な機能 すべての主要通貨の強さの完全な履歴 すべての時間枠における通貨の強さの履歴 すべてのブローカーとチャートで同一の計算結果 100%信頼できるリアルタイム計算 -> リペイントなし ドロップダウン・リストから
Cycle Sniper
Elmira Memish
4.41 (34)
NEW YEAR SALE PRICE FOR LIMITED TIME!!! Please contact us after your purchase and we will send you the complimentary indicators to complete the system Cycle Sniper is not a holy grail but when you use it in a system which is explained in the videos, you will feel the difference. If you are not willing to focus on the charts designed with Cycle Sniper and other free tools we provide, we recommend not buying this indicator. We recommend watching the videos about the indiactor and system before pu
TakePropips Donchian Trend Pro
Eric John Pajarillaga Aldana
4.82 (17)
TakePropips Donchian Trend Pro   (MT4) は、ドンチャン チャネルを使用してトレンドの方向を自動的に検出し、エントリーとエグジットの取引シグナルを提供する強力で効果的なツールです! この多機能インジケーターには、トレンド スキャナー、取引シグナル、統計パネル、スクリーナー、取引セッション、およびアラート履歴ダッシュボードが含まれます。取引シグナルを提供し、チャートを分析する時間を節約するように設計されています! ユーザー マニュアルとインストール ガイドは、ブログ投稿 (   https://www.mql5.com/en/blogs/post/751368   ) からダウンロードできます。 今日は 50% オフ! 98ドルから49ドルに値下げ! このインジケーターは、ストラテジー テスターでテストできます (ビジュアル モードを有効にします)。ライブ チャートでテストしたい場合は、7 日間の試用版を入手するようにメッセージを送ることもできます。 詳細については、説明の下にあるビデオ チュートリアルも利用できます。 ご不明な点やサポートが必
このインディケータは、当社の2つの製品 Advanced Currency IMPULSE with ALERT  +   Currency Strength Exotics . のスーパーコンビネーションです。 このインジケーターは全ての時間枠で作動し、8つの主要通貨と1つのシンボルの強弱のインパルスをグラフで表示します。 このインジケータは、金、エキゾチックペア、商品、インデックス、先物など、あらゆるシンボルの通貨強度の加速度を表示することに特化されています。金、銀、原油、DAX、US30、MXN、TRY、CNHなどの通貨強度の加速度(インパルスまたは速度)を表示するために、任意のシンボルを9行目に追加できる、この種の最初のものです。 新しいアルゴリズムに基づいて構築され、潜在的な取引の特定と確認がさらに容易になりました。これは、通貨の強さや弱さが加速しているかどうかをグラフィカルに表示し、その加速の速度を測定するためです。加速すると物事は明らかに速く進みますが、これはFX市場でも同じです。つまり、反対方向に加速している通貨をペアリングすれば、潜在的に利益を生む取
FX Volume
Daniel Stein
4.6 (35)
mql5と Telegramの モーニング・ブリーフィングで、詳細とスクリーンショットを含む毎日のマーケット・アップデートをご覧 ください! FX Volumeは、ブローカーの視点から市場のセンチメントをリアルに洞察する、最初で唯一の出来高インジケーターです。 ブローカーのような機関投資家が外国為替市場でどのようなポジションをとっているか、COTレポートよりもはるかに速く、素晴らしい洞察を提供します。 この情報をチャート上で直接見ることは、あなたの取引にとって真のゲームチェンジャーであり、画期的なソリューションです。 以下のようなユニークなマーケットデータ洞察から利益を得てください。 比率は 、通貨のロングポジションとショートポジションの比率をパーセントで表示します。 比率の変化は 、選択した期間内のロング比率とその変化率を表示します。 Volumes Totalは 、通貨の取引量(ロングとショート)の合計をロット単位で表示します。 Volumes Long :全通貨のロングポジションの取引量を表示します。 Volumes(ショート )は、全通貨のショートポジションの取引量を表示
Gann Signal is a very simple indicator at first glance, but hidden inside is many years of experience in studying W.D.Ganna methods. The indicator gives accurate BUY/SELL signals, without redrawing. The indicator is very easy to use. All you need to do is attach it to your chart and follow its recommendations. The indicator constantly analyzes the market for entry opportunities. When such an opportunity appears, the indicator gives a signal in the form of an arrow. I repeat, all signals are NOT
これはMT4のインジケーターで、再描画なしで取引に参入するための正確なシグナルを提供します。 外国為替、暗号通貨、金属、株式、インデックスなど、あらゆる金融資産に適用できます。かなり正確な見積もりを提供し、取引を開始して終了するのに最適な時期を教えてくれます。1つのシグナルを処理しただけでインジケーターの元が取れた例の 動画 (6:22)をご覧ください。Entry PointsPro インジケーターの助けを借りたほとんどのトレーダーの最初の1週間の結果が改善しています。 Telegramグループ に登録してください。Entry Points Proインジケーターのメリットは次の通りです。 再描画のないエントリーシグナル 再描画されるインジケーターでは一度表示されたシグナルが削除されて大きな金銭的損失につながることがありますが、これと異なり、表示されて確認されたシグナルは消えることがありません。 エラーなしの取引開始 インジケーターアルゴリズムによって取引を開始する(資産を売買する)理想的な瞬間を見つけることができます。それを使用するすべてのトレーダーの成功率が向上します。
現在20%OFF! 初心者やエキスパートトレーダーに最適なソリューションです。 このインディケータは、エキゾチックペア・コモディティ・インデックス・先物など、あらゆるシンボルの通貨の強さを表示することに特化したインディケータです。金、銀、原油、DAX、US30、MXN、TRY、CNHなどの通貨の強さを表示するために、9行目にどのシンボルでも追加することができます。独自の機能を多数搭載し、新しい計算式を採用したため、ユニークで高品質、かつ手頃な価格のトレーディングツールとなっています。新しいトレンドやスキャルピングチャンスのトリガーポイントを正確に把握することができるため、あなたのトレードがどのように改善されるか想像してみてください。 ユーザーマニュアル:ここをクリック   https://www.mql5.com/en/blogs/post/708876 すべての時間枠に対応します。あなたはすぐにトレンドを見ることができるようになります! 新しいアルゴリズムに基づいて設計されているため、潜在的な取引の特定と確認がより簡単になります。これは、8つの主要通貨と1つのシンボ
Reversal Sniper is designed to find the extreme reversals of the price. Indicator collects data of Cycle Sniper Indicator. NOTE: REVERSAL SNIPER Indicator is made for Cycle Sniper Users as an additional tool.  However, it can be used by the traders who look for finding out strong reversal levels. Indicator works on all timeframes and all instruments. Reversal  Sniper  Checks: Harmonic Patterns RSI Zig Zag and Harmonic Swings Cycle Sniper Indicator's Buy / Sell Signals The complex algo i
Ultimate Sniper Dashboard
Hispraise Chinedum Abraham
4.84 (25)
299ドルで割引中! 今後値上げの可能性あり! 下の説明を読んでください! 究極のスナイパーダッシュボードのための最高のエントリーシステム。究極のダイナミックレベル。(私の製品をチェックしてください) 究極のスナイパーダッシュボードはMT4多通貨テスト制限のため、ライブマーケットでのみ作動します。 究極のスナイパーダッシュボードをご紹介します。HA-Sniper、MA-Sniper、その他多くの特別なモードが含まれる最高の製品です。究極のスナイパーダッシュボードは絶対的な獣です! 初心者やエキスパートトレーダーにとって最高のソリューションです。もう二度と動きを見逃さない! シンプルさとピップを愛するトレーダーのために、特別な製品をご用意しました。シンプルでありながら、ダッシュボードは複数のカスタムアルゴリズムに基づき28の通貨ペアを監視し、すべての作業を行います。たった一つのチャートで、プロのように市場を読み解くことができます。もし、為替ペアが動き出したときに、その方向性を正確に特定することができれば、あなたの取引はどれほど改善されることでしょう。   当社のシ
This indicator is based on the mathematics of the great trader W.D. Ganna. With its help, you can easily find strong levels by analyzing swings to find the optimal entry point. The indicator works on all instruments and all timeframes. The indicator is fully manual and has control buttons. All you need to do is press the NEW button, a segment will appear, which you can place on any movement, swing or even 1 candle that you want to analyze. By placing the segment, press the OK button. A grid (th
もちろんです。以下は、提供いただいたテキストの日本語への翻訳です: MT4用の天文学指標をご紹介します:究極の天体トレーディングコンパニオン トレーディング体験を天空の高みに高める準備はできていますか?私たちの革命的なMT4用の天文学指標をご紹介します。この革新的なツールは、複雑なアルゴリズムの力を借りて、類まれなる天文学的洞察と精密な計算を提供します。 あなたの指先で宇宙の情報を: 宝のような天文学的データが明らかになる包括的なパネルをご覧ください。惑星の地理的/太陽中心座標、太陽と地球の距離、星の大きさ、伸び、星座、黄道座標および赤道座標、さらには水平座標まで、それぞれが綿密に計算され美しく表示されています。指標によって生成される垂直線は時間値に対応し、トレーディングの旅に宇宙の視点を提供します。 惑星のラインと関係: グラフを飾る惑星のラインの魔法を体験し、スケールと角度をカスタマイズできます。直感的なコントロールパネルを介して各惑星のラインの表示を簡単に切り替えることができます。指定された時刻範囲内での合会、六分会、四分会、三分会、対会、逆行の指標で天体の関係の芸術を発見してく
Price Action Entry Alerts
Stephen Sanjeeve Sahayam
5 (3)
このインジケーターは、売買圧力についてすべてのバーをスクリーニングし、最大量の 4 種類のローソク足パターンを特定します。次に、これらのローソク足はいくつかの線形フィルターを使用してフィルター処理され、買いまたは売りのシグナルが表示されます。シグナルは、より高い時間枠の方向と組み合わせて、取引量が多い時間帯に取引される場合に最も効果的に機能します。すべてのフィルターはカスタマイズ可能で、独立して動作します。ボタンをクリックするだけで単一方向の信号を表示できます。 このインジケーターには、意思決定プロセスに役立つ最も重要な価格アクションとスマート マネーの概念も組み込まれています。 シグナルとトレードに関する教育をすべて 1 つのツールにまとめました。 特徴: 信号は再描画されません。 飲み込むキャンドル、拒否キャンドル、拡張範囲キャンドル、ピンバーを識別します。 有効なシグナルごとに複数のエントリー、ストップロス、複数のテイクプロフィットレベルを表示します。 大容量セッションでフィルタリングします。 サポート/レジスタンスレベルとローソク足の構造でフィルターします。 MACD ヒ
Weis Wave with Alert
Trade The Volume Waves Single Member P.C.
4.79 (19)
Rental/Lifetime Package Options and Privileges' * For optimum results the yearly or lifetime package is suggested due to live training and Discord  channel trading with the  creator! Rent Monthly Six Months   Yearly/Lifetime Weis Wave with Speed with Alert+Speed Index x x x Manual  x x x Quick Set up Video x x x Blog x x x Lifetime Updates x x x Setup and Training Material x x Free Rectangle Break Alert Tool      x Discord Access Channel "The SI traders" x 2-hour live methodology traini
StalkeR Arrow
Abdulkarim Karazon
5 (4)
StalkeR Arrow は、バーオープン/バー内で売買シグナルを与える矢印インジケーターです。このインジケーターは価格行動パターンとフラクタルに基づいています。 このインジケーターは、各買いシグナルと売りシグナルの tp と sl を与えます。tp と sl は各シグナルの上下の線の形式であり、新しいシグナルが形成されるまで延長されます。 このインジケーターには、履歴シグナルの勝敗統計を提供するバックテスト パネル/ダッシュボードがありますが、このインジケーターは再ペイントやバックペイントを行いません。 パラメーター : StalkeR 周期 : 矢印周期、数値が大きいほど信号が少なくなります スプレッド: ポイント単位のスプレッド値を使用して、パネル上の勝敗を計算します。 ストップロス ATR x : atr 乗算における SL 値 Takeprofit ATR x : atr乗算のTP値 ATR 期間 : に基づいて tp と sl を計算するために使用する atr 期間 TP/SL ラインの色と幅 矢印の色と幅 パネル/ダ
現在20%OFF! このダッシュボードは、複数のシンボルと最大9つのタイムフレームで動作するソフトウェアの非常に強力な部分です。 このソフトは、弊社のメインインジケーター(ベストレビュー:Advanced Supply Demand)をベースにしています。    Advanced Supply Demand ダッシュボードは、素晴らしい概要を提供します。それは示しています。  ゾーン強度評価を含むフィルタリングされた需給値。 ゾーン内/ゾーンへのPips距離。 ネストされたゾーンがハイライトされます。 選択されたシンボルの4種類のアラートを全ての(9)時間枠で提供します。 それはあなたの個人的なニーズに合わせて高度に設定可能です。 あなたの利益! すべてのトレーダーにとって最も重要な質問です。 市場に参入するのに最適なレベルはどこか? 成功のチャンスとリスク/リターンを得るために、強力な供給/需要ゾーン内またはその近くで取引を開始します。 損切りの最適な位置はどこですか? 最も安全なのは、強力な供給/需要ゾーンの下/上にストップを置くことで
The indicator is designed to work on any trading platform. The program is based on proprietary algorithms and W.D.Ganna's mathematics, allowing you to calculate target levels of price movement based on three points with the highest degree of certainty. It is a great tool for stock trading. The indicator has three buttons: NEW - call up a triangle for calculation. DEL - delete the selected triangle. DELS - completely remove all constructions. The probability of achieving the goals is more than 80
作者のその他のプロダクト
Was: $249  Now: $99   Market Profile defines a number of day types that can help the trader to determine market behaviour. A key feature is the Value Area, representing the range of price action where 70% of trading took place. Understanding the Value Area can give traders valuable insight into market direction and establish the higher odds trade. It is an excellent addition to any system you may be using. Inspired by Jim Dalton’s book “Mind Over Markets”, this indicator is designed to suit the
Was: $299  Now: $99   Supply Demand uses previous price action to identify potential imbalances between buyers and sellers. The key is to identify the better odds zones, not just the untouched ones. Blahtech Supply Demand indicator delivers functionality previously unavailable on any trading platform. This 4-in-1 indicator not only highlights the higher probability zones using a multi-criteria strength engine, but also combines it with multi-timeframe trend analysis, previously confirmed swings
Over 100,000 users on MT4 and MT5 Blahtech Candle Timer displays the remaining time before the current bar closes and a new bar forms. It can be used for time management Links [  Install  |  Update  |  Training  ] Feature Highlights The only candle timer on MT5 with no stutter and no lag S electable Location Tracks server time not local time Multiple colour Schemes Configurable Text Customisable alerts and messages Optimised to reduce CPU usage Input Parameters Text Location - Beside / Upper L
FREE
Over 100,000 users on MT4 and MT5 Blahtech Candle Timer displays the remaining time before the current bar closes and a new bar forms. It can be used for time management Links [  Install  |  Update  |  Training  ] Feature Highlights The only candle timer on MT4 with no stutter and no lag S electable Location Tracks server time not local time Multiple colour Schemes Configurable Text Customisable alerts and messages Optimised to reduce CPU usage Input Parameters Text Location   - Beside / Upper
FREE
Was: $69  Now: $34   Blahtech VWAP - Volume Weighted Average Price (VWAP) is the ratio of price to total volume. It provides an average price over a specified time interval.  Links [  Install  |  Update  |  Documentation   ] Feature Highlights Configurable VWAP Line Sessions, intervals, anchored or continuous Previous day settlement line Standard Deviation bands Alerts at bar close or real time Automatic Broker or Tick volumes Significantly reduced CPU usage Input Parameters Expert Advisor
Blahtech Fisher Transform indicator is an oscillator that displays overbought and oversold locations on the chart. The Fisher Transform algorithm transforms prices with any distribution shape into a normal distribution. The end result is a curve with sharp turning points that may help to identify bullish or bearish trends. Fisher Transform values exceeding 1.66 on the daily chart are considered to be good areas for reversal trades. Links [  Install  |  Update  |  Training   |  All Products  ]
Blahtech VWAP
Blahtech Limited
5 (2)
Was: $69    Now: $34   Blahtech VWAP - Volume Weighted Average Price (VWAP) is the ratio of price to total volume. It provides an average price over a specified time interval.  Links [  Install  |  Update  |  Documentation   ] Feature Highlights Configurable VWAP Line Sessions, intervals, anchored or continuous Previous day settlement line Standard Deviation bands Alerts at bar close or real time Automatic Broker or Tick volumes Significantly reduced CPU usage Input Parameters Expert Advis
Was: $99  Now: $34   Blahtech Daily Range indicator displays the average daily range alongside the individual session ranges. Using the daily open price as a reference the indicator shows fixed range and dynamic range targets as lines on the charts. These lines clearly show when the average range has been exhausted. Daily and session ranges can be useful for confirming entries or setting targets and is an excellent odds enhancer for many trading systems. Links [  Documentation   |   Install  | 
Was: $49    Now: $34  Blahtech Better Volume provides an enhanced version of the vertical volume bars. Each bar is compared to the previous 20 bars. Depending on its volume, range and volume density it will be assigned a state and colour. Low Volume – Minimum volume High Churn   – Significant volume with limited movement Climax Neutral –   High volume with unclear direction Climax Up   – High volume with bullish direction Climax Dn   – High volume with bearish direction Climax Churn – High vol
Blahtech Moving Average indicator is a multitimeframe version of the standard Moving Average indicator. It is also enhanced with customisable alerts, period breaks and other configuration options. The 50 day and 200 day moving averages are widely followed by investors and traders, with breaks above and below the MA lines considered to be signals of interest. Links [  Install  |  Update  |   Training   |   All Products  ] Feature Highlights Up to three timeframes Configurable calculation variab
FREE
Blahtech Fisher Transform indicator is an oscillator that displays overbought and oversold locations on the chart. The Fisher Transform algorithm transforms prices with any distribution shape into a normal distribution. The end result is a curve with sharp turning points that may help to identify bullish or bearish trends. Fisher Transform values exceeding 1.66 on the daily chart are considered to be good areas for reversal trades. Links [  Install  |  Update  |  Training   |  All Products  ]
Was: $99  Now: $34   Blahtech Daily Range indicator displays the average daily range alongside the individual session ranges. Using the daily open price as a reference the indicator shows fixed range and dynamic range targets as lines on the charts. These lines clearly show when the average range has been exhausted. Daily and session ranges can be useful for confirming entries or setting targets and is an excellent odds enhancer for many trading systems. Links [  Documentation   |   Install  |
フィルタ:
OldBoomer
19
OldBoomer 2023.04.17 12:00 
 

Amazing tool! I love the ability to switch between, sessions, daily, weekly and quarterly profiles instantly.

Ninerair929
41
Ninerair929 2021.09.15 16:53 
 

This system is worth every dollar. Back up service also good

DaJenks Jenks
323
DaJenks Jenks 2021.05.19 05:25 
 

It works I just have to figure it out

Shuman Rotula
33
Shuman Rotula 2021.05.10 13:35 
 

ユーザーは評価に対して何もコメントを残しませんでした

efecetinel
111
efecetinel 2021.05.05 20:16 
 

Perfect. Just perfect. Thank you.

sincitytrader
84
sincitytrader 2021.02.10 20:15 
 

What a fantastic indicator. Exactly what I've been looking for for volume profiles

Gui Jacobucci
73
Gui Jacobucci 2020.12.19 18:49 
 

Absolutely Outstanding indicator! Bought the Indicator, installed and it was straight forward. Once installed I have set it up as per my needs and it is working perfectly.

Nicolas Dobrovsky
689
Nicolas Dobrovsky 2020.09.18 11:44 
 

The best market profile indicator for MT4 on the market. Great alternative if you don't want to use Sierra chart or Ninja trader.

T3chAddict
59
T3chAddict 2020.09.17 15:21 
 

Great tool. I had used other market profile indicators before that were just crashing MT4. Finally an indicator that works well and is very clear to use. Plus, like the other indicators, has a back-testing mode that is very useful.

Kostbar
514
Kostbar 2020.05.13 15:44 
 

Bester Indikator ... vielseitig, präzise, zuverlässig ... absolute Kaufempfehlung!

Lorant Nemeth
393
Lorant Nemeth 2020.01.19 22:21 
 

Extremely detailed and profession tool for Volume Profile trading.

Thank you

cvdestyfx
2702
cvdestyfx 2019.10.14 21:06 
 

Three stars due to lack of sufficient material explaining the purpose of each setting and how to use it. When you are selling a high-end indicator such as this with so many settings, you should at least provide sufficient documentation (with images) explaining how to use each setting and what its purpose is. You have provided some material, but for the most part, you have left it up to the user to figure out how to use the indicator. That's not a professional way to do business.

jaya thilaka
275
jaya thilaka 2019.06.29 08:40 
 

Highly recommended tool

Thomas Fairhurst
1186
Thomas Fairhurst 2019.06.15 10:30 
 

Waste of money! Most of the times doesn't show anything, no profile at all. If it shows any profile it is with barely any detail. Highly overrated! Not recommended for purchase.

Minh Nguyen Nam
1528
Minh Nguyen Nam 2017.09.05 04:24 
 

it is a great tool for traders. Thanks for your development!

Best,

Minh

Ng Choong Huan
229
Ng Choong Huan 2017.06.06 06:29 
 

The best indicator on MT4 market.

Useful and fully functional.

Highly recommended.

Marco Gundel
738
Marco Gundel 2017.04.12 20:40 
 

I bought this indicator together with the Daily Range indicator over a month ago so that I can give an honest review. I have to say....just as the Daily Range Indicator, Market Profile is amazing. I have this indicator currently running on 15 charts at the same time on an older PC and I have not once experienced a slowdown or freezing of MT4. The features in this indicator are truly amazing, which makes my life so much easier. Thank you Blahtech :-)

Julian Lo
716
Julian Lo 2017.01.20 15:39 
 

ユーザーは評価に対して何もコメントを残しませんでした

cozyman
321
cozyman 2016.04.30 13:10 
 

I can't compliment Blahtech limited and Deeyana enough, they have made excellent work providing these high quality indicators for sale.

simply the best market profile I have seen for Mt4, they are professional indicators for people who want the best tools available,

I bought the market profile and they even customized it for me at no extra cost, that is a great company and great people. the indicators cost a bit more than others out there, but the quality and features they provide makes no comparison on the Mt4 market, and easily makes up for the price, totally worth it if you want the best tools! recommended

Lee Bryant
2679
Lee Bryant 2016.04.04 18:05 
 

ユーザーは評価に対して何もコメントを残しませんでした

12
レビューに返信
バージョン 4.0 2024.04.09
- Keyboard - Fix Ctrl and Shift Click mappings on MT5
バージョン 3.9 2024.01.11
- Asian Session - Change default TK session to 01:30
- Add Initial Balance Size (IB Size) to Summary Panel
- Keyboard - Fix Ctrl and Shift Click mappings on MT5
バージョン 3.8 2022.02.07
- Highlight Open Above High and Open Above Low in the Summary panels
- Add option to display close price in the summary panels
- Fix Halfback colour parameter
- Add Preset file with colour scheme for dark backgrounds
バージョン 3.7 2021.05.18
Enhancements
- Add Overall Volume Show Value Areas parameter

Fixes
- Reduce number of calculations when snap to grid is enabled
- Improve auto TPO size for futures contracts with single digit quotes
バージョン 3.6 2021.05.10
Fixes:
- Hotkeys - Keep Hotkey panel hidden when switching timeframes
バージョン 3.5 2021.05.05
Enhancements
- Profiles - Add parameter "Clear Hotkeys On Terminal Close" to improve profile switching on MT5
- Offline Charts - Add support for offline charts and backtest tools with missing market data and unsynced current time

Fixes
- Mouse Events - Keep CHART_EVENT_MOUSE_MOVE enabled if other indicators are waiting on mouse events
バージョン 3.4 2021.04.20
Enhancements
- MT5 - Add support for extended timeframes

Performance
- Clear Hotkey - Improve performance of clear chart calls
- Recalc Triggers - TpoTolerance - Ensure consistency across snapped to grid and unsnapped profiles
バージョン 3.3 2021.04.08
Enhancements
- Snap To Grid - Add option to map TPO to a fixed price grid rather than TPO stacked from lowest price (Dalton)
- Snap to Grid - Add parameter to offset all the TPO prices (TPO Size factor)
- Snap to Grid - Add button to Hotkey Panel
- Line Extensions - Add button to Hotkey panel

Fixes
- Max TPO Rows - Change default from 300 => 150
- Demo Modes - Add Snap To Grid and Line Extensions to demo modes
- Demo Modes - Improve handling of user set parameters in the strategy tester

Performance
- Hotkeys - Reduce redraw time when hotkeys pressed (especially with large numbers of profiles)
- Real time - Reduce number of calculations when TPO Tolerance parameter is set
- Real time - Reduce number of calculations when Snap To Grid is enabled
バージョン 3.2 2021.03.04
Enhancements
- Summary Panel - Highlight increased Tpo Size when Max Tpo Rows limit is breached
- Parameters - Write simple list of changed parameters to experts log when Ctrl+Q keys are pressed
- Parameters - Create detailed report of changed parameters in Files/Blahtech directory to assist users and support

Fixes
- Tpo Size - Improve automatic calculation for assets with one digit prices
- Tpo Size - Improve recalulation of Tpo Size when Max Tpo Rows limit is breached
- Max Tpo Rows - Change default from 500 => 300
- Expert Advisor Mode - Change to a single option named "Reserved For iCustom Calls"
バージョン 3.1 2021.01.20
Enhancements
- Volume Text - Add parameters to set colour and size of chart volume text
- Inline Charts - Add "Volume Separate" and "Volume Opposing" graphics chart options
- Inline TPO Charts - Decouple "Inline Charts" from "Inline TPO" so both can be on the chart concurrently
- Profile Line Titles - Add parameter to allow user to set custom text for the chart profile titles
- Chart Zones - Add parameter "Ranges - Draw To End Time" to extend drawing of session zone boxes to the next candle (Default false)
- Profile text - Add parameter "Profile Text Show Previous" to control display of previous profile text on left of chart
- Prices - Add parameter "Profile Lines Prices Only Show Final" to clean up display by only showing prices for last profile
- Intervals - Add "Decades" to the intervals to enable creation of longer term profiles (also add five year preset file)

Fixes
- Summary Panel - Improve text scaling and layout of Summary Panels
- Summary Text Size - Change default text size from 7 to 8 for clarity on 27 inch 1440p monitors
- Expanded letter TPO - Draw Sunday letters correctly on Sunday candles (Mn Of Qu preset)
- Profile Text - Fix font scaling on right hand profile text
バージョン 2.9 2019.08.01
Enhancements
- Add option to display Interval + Session for profile titles
- Add IntervalMultipler to support more advanced schedules

Fixes
- Clear candles from the chart when Style is set to Letters
バージョン 2.8 2019.06.19
Enhancements
- Add parameter to configure Calculator Max Tpo Rows
- Add option to display Halfback profile lines on the chart
- Left clicking any description in the Hud Panel now resets the value back to its input parameter version

Fixes
- Fix custom schedules for Overall Volume
- Do not override user set TPO sizes when cycing through presets
- Change defaults to display more features on chart at startup
- Remove extended profile lines from Days Of weeks preset
- PocLine PocArea - Reformat and swap display values round so MaxTpoWidth comes before TotalTpo
バージョン 2.7 2018.05.15
Changes
- Remember Chart Clear setting on terminal restart
- Use TPO Size as the default when Vol TPO Size is 0.0
- Set Chart Joines to Hidden for demo modes
バージョン 2.5 2017.08.29
Enhancements
- Add option to set number of bars for initial balance and/or rotation rule
- Add option to set hourly intervals for profiles on the lowest timeframes
- Add option to display the prices for the profile lines
- Add option to display Naked POC extension profile lines
- Add option to display volume text alongside the TPO rows
- Add option to configure the Open and Close letters within the profile text
- Remember hotkey states when restarting terminal
- Support iCustom calls with 64+ parameters by using a set file

Fixes/Changes
- Only highlight rotation rule when it closes within the configured bars
- Add tooltips to summary panel rows
- Add reserved keys parameter to prevent clashes with other products
バージョン 2.3 2017.04.06
Enhancements
- Support individual start letters for each schedule
- Support simple statistics in profile titles

Fixes
- Fixed the order that inline charts are displayed when shift-"n" key is used
- Clear Charts - Forced redraw rather than waiting for next tick
- Rebuilt with latest compiler for MetaTrader platform changes
バージョン 2.2 2017.03.09
New features
- Added inline charts with TPO letters and expanded TPO letters

Enhancements
- Added the option to clear candles from the chart
- Added the option to exclude weekend schedules
- Allows a user to choose schedules for multi session display
= Inline charts
- Added "Profile and Volume Separate" and "Profile and Volume Opposing"
- Added the option to display charts as bars
- Allows a user to adjust font sizes and spaces of inline letters
= Presets
- Added "TPOs" demo mode
- Added the "Futures Of Days" profile (AMP Futures setup)
= Summary Panel:
- Option to hide the panel
- Allows a user to configure row contents
= Hotkey panel:
- Added the button for auto/fixed price scale
- Added the button for broker/tick volumes
- Added the buttons for adjusting TPO letter font sizes/spaces
- Reverse order of hotkey changes when the Shift key is pressed
- Support multi region keyboard layouts

Fixes
- Improved default TPO tick sizes
- Changed HK session to start at midnight
- Improved scaling of panels when font sizes are changed
- Changed timeframe enums, so MT5 version can share set files with MT4 version
- Support 8-digit instruments in summary panel

Performance
- Backtest - only redraw older schedules when the day changes
- Optimized the code that gets executed each tick

New Hotkeys
- "`" - chart candles - show/clear
- "7" - inline TPOs - graphics/TPOs/expanded TPOs
- "e" - inline TPOs - adjust a font size

Parameters
- See the parameters documentation for details - http://www.blahtech.co.uk/marketprofile
バージョン 2.0 2016.12.09
New Features
- Support multiple developing schedules HK,LN,NY rather than just the first one in the list
- Automatically switch focus to the next session as it becomes active
- Add configuration presets for some standard schedules on higher timeframes
- Highlight of business rules – Open, IB Extension and Rotation Rules

Enhancements
- Schedules - Increase number of custom schedules from 4 to 7
- Overall Volume - Change default VolumeIntervals from 7 to 1
- Demo Mode - Allow user to switch between default and demo settings
= Profile Lines:
- Display session and interval titles on the chart
- Add option to switch off vertical lines
- Add option to change line styles for Start, End and Extension line
- Add option to set different colours and styles for HIGH, VAH, POC, VAL, LOW
= Summary Display:
- Draw summary display as a panel rather than simple text
- Add TPO Timeframe row
- Change titles to session name and interval name
- Support clicking on title to change schedule focus
- Add dot icon to title to highlight when auto schedule mode is active
= Hotkey display:
- Add verbose display
- Move panel from main window to sub window
- Allow user to change value by clicking on the rows
- Support clicking then dragging panel to new location
- Highlight values that have changed from input parameter settings

Fixes
- Hotkeys - Update position when window height is changed
- Backtest - Use TimeLocal for backtest expire so it works when market is closed
- Reset - Force clear and redraw of all objects on Reset

Performance
- Only refresh each tick if next level has been touched or broken
- Only redraw Hotkey display if chart width has changed

New Hotkeys
- "9" - Demo mode
- "0" - Presets

Parameters
- See parameters documentation for details http://www.blahtech.co.uk/marketprofile
バージョン 1.1 2016.04.12
- Bug Fix : Schedules - Fix error with schedules that span midnight
- Enhancement : Charts - Improve tooltips
- Enhancement : Charts - Add Hotkey "T" - Temporarily double the Ticksize
- Enhancement : Charts - Add Hotkey "Y" - Switch to the alternate schedule/session
- Enhancement : Summary - Change BUY/SELL/NTRL to UP/DN/NTRL
- Enhancement : Developers - Add support for iCustom buffers 0=Empty 1=VAH 2=POC 3=VAL 4=dVAH 5=dPOC 6=dVAL
- Enhancement : Daylight Savings - UseDaylightSavings parameter - Change default to true
- Enhancement : High Res Displays - WindowsDesktopScaling - Add parameter to support desktop scaling for 4K and other high res screens
- Performance : Backtest Mode - Do not recalculate every tick when in backtest mode