• 概要
  • レビュー (526)
  • コメント (712)
  • 最新情報

True Direction Oscillator

4.89

または(TDO)は、「純粋な勢い」の原則を使用して価格変動率を測定する指標です。

証券価格が10から15に上がると、価格の変化率は150%になりますが、15から10に戻ると、価格の変化率は33.3%になります。そのため、「価格変化率」(ROC)や「モメンタム」などのテクニカル分析指標は、下降するものよりも上昇する価格の動きの方が高い値を示します。 TDOはこの問題を修正して、トレーダーが勢いを正しく読み取るのを支援します。


重要な情報

    TDOユーザーズマニュアル:https://www.mql5.com/en/blogs/post/717970
        TDO FAQ:https://www.mql5.com/en/blogs/post/722015
            TDOビデオライブラリ:https://www.mql5.com/en/blogs/post/722018
                TDOエキスパートアドバイザーの例:https://www.mql5.com/en/blogs/post/731141

                  TDOの機能

                    TDOは純粋な勢いをパーセントとして計算するため、さまざまな市場のさまざまな証券を比較するために使用されます。 (例:EURUSDをGold&Dow Jones Industrialと比較してください)。

                    TDOパネルの計算は、幅広い市場サイクルをカバーするために5つの異なる期間に依存し、トレンドを把握するのにより効果的です。

                    TDO矢印は、すべてのTDOパネルドットが初めて一列に並んだときに表示されます。この機能により、誤ったゼロラインクロス信号の数が最小数に減少します。

                    トレンドが強まり、新しいトレンドの開始時に矢印信号が表示されたときに、音声でアラートを送信します。

                    シンボルボタンを押すと、FXペアを切り替えることができます。新しいウィンドウでチャートを開くことを選択できます。

                    チャネルボタンを押すと、標準偏差チャネルまたは線形回帰チャネルを追加できます。

                    さまざまなレベルのラウンド数からグリッドを追加できます。

                    サポートとレジスタンスのレベルを追加できます。

                    ユーザーがパラメーター間を移動するのに役立つ、適切に設計されたパラメーター。

                    TDOコードは、ユーザーのPCメモリを消費しないように改訂されています。

                    TDO矢印は、結果を再描画または再計算しません。


                    重要なTDOパラメータ


                    1)TDO設定

                    • 最初のTDO期間[最小= 1]:これはTDOパネルの最初のサイクルです。デフォルトは10です。

                    2)TDOカラーリストとボタン

                    • チャートの色リスト:4つの異なる色リストから選択するか、(何もしない)を選択できます。

                      3)TDOの矢印とアラート
                      4)TDOパネルアラート
                      5)TDOシンボルボタン

                      • シンボルパネルを表示するウィンドウ: メインチャートウィンドウまたは TDOウィンドウにシンボルボタンを表示します。
                      • ボタンクリックアクション: 同じウィンドウまたは 新しいウィンドウでチャートを開きます。
                      • シンボルソース元: カスタムシンボルリストまたは マーケットウォッチからシンボルを取得します。
                      • 記号のリスト(「;」で区切られます):カスタムリストから記号を選択する場合は、記号を「;」で区切ります。
                      • 横列のボタン[最小=(1)]:一列に表示するボタンの数。
                      • 表示する時間枠[最小=(1)&最大=(9)]:デフォルトは7です。

                      6)TDOチャンネル

                      • チャネルの種類: 標準偏差チャネルまたは 線形回帰チャネルから選択します。
                      • チャンネル光線:チャンネルを光線として表示します。
                      • チャネル長:チャネル計算で使用されるキャンドルの数。デフォルトは160です。

                      7)TDOグリッドライン

                      • サブグリッドレベル数:メイングリッドレベル間に0から10のサブレベルを追加できます。

                      8)TDOジグゾーンレベル


                      ご不明な点がございましたら、プライベートメッセージでご連絡いただくか、コメント欄にご記入ください。
                      ムハンマドアルベルマウイ、CMT


                      レビュー 20
                      ovno27
                      109
                      ovno27 2024.04.07 09:07 
                       

                      The direction is really true!!!

                      pornchai_p
                      340
                      pornchai_p 2023.06.08 18:37 
                       

                      This is excellent indicator, highly recommended. Now I have Bermaui bands, Bermaui RSI Candles and TDO.

                      Shimaa Kamal
                      42
                      Shimaa Kamal 2023.05.26 23:14 
                       

                      This is a great indicator ... Thank you very much

                      おすすめのプロダクト
                      Strong Retracement Points Pro demo edition! SRP (Strong Retracement/Reversal Points) is a powerful and unique support and resistance indicator. It displays the closest important levels which we expect the price retracement/reversal! If all level are broken from one side, it recalculates and draws new support and resistance levels, so the levels might be valid for several days depending on the market! If you are still hesitating to start using this wonderful tool, you can check this link to see h
                      GG TrendBar Indicator - Your Multitimeframe ADX Trading Solution Experience the power of multi-timeframe trading with the "GG TrendBar Indicator." This versatile tool, built upon the ADX indicator, offers precise insights by considering multiple timeframes, ensuring you make well-informed trading decisions. Basic Details : Indicator Type : GG TrendBar Indicator (Multi-Timeframe ADX) Key Metrics : Real-time ADX analysis across multiple timeframes. Customization : Enable or disable specific timefr
                      WPR by Profile, or WPR for Professionals Geo_WprPro is one of the well-known currency profile indicators. It simultaneously displays two WPR indicators with different parameters in the matrix form on all timeframes of multiple currency pairs forming the currency profile . As follows from the description, " WPR is a leading indicator that often goes ahead of the price chart. The oscillator frequently reaches extreme values before the price reversal as if anticipating that event: it almost always
                      The Infinity Expert Advisor is a scalper. When the resistance and support levels are broken, trades are opened in the direction of the price movement. Open positions are managed by several algorithms based on the current market situation (fixed stop loss and take profit, trailing stop, holding positions in case of trend indication, etc.). Requirements for the broker The EA is sensitive to spread, slippages and execution quality. It is strongly recommended not to use the EA for currencies with
                      Owl smart levels
                      Sergey Ermolov
                      4.63 (54)
                      MT5版  |   FAQ Owl Smart Levels Indicator   は、 Bill Williams   の高度なフラクタル、市場の正しい波構造を構築する Valable ZigZag、エントリの正確なレベルをマークする Fibonacci レベルなどの一般的な市場分析ツールを含む 1 つのインジケーター内の完全な取引システムです。 利益を得るために市場と場所に。 戦略の詳細な説明 インジケータを操作するための指示 顧問-取引助手 プライベートユーザーチャット ->購入後に私に書いて、私はプライベートチャットにあなたを追加し、あなたはそこにすべてのボーナスをダウンロードすることができます 力はシンプルさにあります! Owl Smart Levels   取引システムは非常に使いやすいので、専門家にも、市場を勉強し始めて自分で取引戦略を選択し始めたばかりの人にも適しています。 戦略と指標に秘密の数式や計算方法が隠されているわけではなく、すべての戦略指標は公開されています。 Owl Smart Levels を使用すると、取引を開始するためのシグナルをすばやく確認し、
                      Instantaneous cycle identifier
                      Mahmoud Helmy Sedik Mohamed Mansour
                      This is first public release of detector code entitled "Enhanced Instantaneous Cycle Period" for PSv4.0 I built many months ago. Be forewarned, this is not an indicator, this is a detector to be used by ADVANCED developers to build futuristic indicators in Pine. The origins of this script come from a document by   Dr   . John   Ehlers   entitled "SIGNAL ANALYSIS CONCEPTS". You may find this using the NSA's reverse search engine "goggles", as I call it. John Ehlers' MESA used this measurement to
                      | Fully-automated Smart Money Concept (ICT) inspired trading solution with multi-strategy capabilities | Built by a grid trader >> for grid traders.  This is MT4 version, click  here  for  Blue CARA MT5  (settings and logics are same in both versions)     Real monitoring signal  -->  Cara Gold Intro Blue CARA EA   ('CARA') - short for  C omprehensive  A lgorithmic R esponsive A dvisor is a next-gen  multi-currency    multi-timeframe  EA base on the widely known (and perhapse most popular) Inn
                      This is a trend indicator without redrawing Developed instead of the binary options strategy (by the color of the Martingale candlestick) Also works well in forex trading When to open trades (binary options) A signal will appear in the place with a candle signaling the current candle It is recommended to open a deal for one candle of the current timeframe M1 and M5 When a blue dot appears, open a deal up When a red dot appears, open a trade down. How to open trades on Forex. When a signal is rec
                      Noize Absorption Index - is the manual trading system that measures the difference of pressure between bears forces and bulls forces. Green line - is a noize free index that showing curent situation. Zero value of index shows totally choppy/flat market.Values above zero level shows how powerfull bullish wave is and values below zero measures bearish forces.Up arrow appears on bearish market when it's ready to reverse, dn arrow appears on weak bullish market, as a result of reverse expectation. S
                      Ilanis
                      Mikhail Sergeev
                      4.61 (28)
                      Ilanis is and Expert Advisor for stock trading, it can be used for trading on Forex and other markets, including commodities, metals and index markets. To determine the market entry, the EA uses the modern and ultra-light adaptive indicator FourAverage. Principle of position maintaining is similar to that of the popular Forex robot Ilan, using averaging. But unlike Ilan, Ilanis uses an accurate entry into the market. The robot pays a lot of attention to position control, if the price goes in the
                      ShinZuka
                      Muhammad Asyraf Bin Mohamad
                      Using MACD value for direction. Using RSI as reversal indicator. Using open trading hour. (Recommend Hour 10,11,15 & 19 : MT4-Time) Counter trade if signal failed. Cutloss trade if signal failed. Auto lot calculate based on target profit & takeprofit. Able to set counter trade value. Suitable for commodities & currency.  Timeframe H1. Able to set limit lot open. Able to select day to trade.
                      Traders are humans. The markets are controlled by "fear" and "greed" and there are patterns for it. We found these patterns via years of writing and monitoring algorithm, and we now introduce to you our LaserAlgo MT4. We used our 7 years’ experience in the markets to convert this concept into a fully AI algorithm.   Link to MT5 version: https://www.mql5.com/en/market/product/89546 Link to live run of EA: https://www.mql5.com/en/signals/1780127 This is a promotional price and will be increased
                      H4 GBPUSD Trend Scalper is a trend signal scalper The EA trades according to the trend strategy using original built-in indicator for opening and closing orders. The external inputs for limiting trading on Fridays and Mondays are available. The purpose of the strategy is to use the current trend with the most benefit. According to the results of testing and working on demo and real accounts, the best results achieved by using the Н4 timeframe on the GBP/USD pair Works on MetaTrader 4 Build 971+
                      FoxFx
                      Salavat Yulamanov
                      5 (1)
                      Fox は、RSI 指標を使用した平均値への価格回帰に基づくリトレースメント グリッド取引システムです。 ボリンジャーバンド、さまざまな時間枠からのダブルストキャスティクス!!! 部分的な決済とポジションのヘッジを伴う合計利益に基づく決済。 シグナル https://www.mql5.com/ru/signals/1525221?source=サイト +プロフィール+販売者   通貨ペア: AUDCAD、AUDNZD、NZDCAD。 時間枠: M15 アドバイザは、すべてのシンボルを取引するために 1 つのチャートのみにインストールされます ブローカーがサフィックス (NZDCAD.с など) を使用している場合は、設定にサフィックスを入力する必要があります。 設定   固定ロット0.01   リスクロット リスク20   ロット値動的 10000   固定初回デポジット False   MaximumLot=10 最大ロット   ヘッジを許可 - True   取引可能な通貨ペア AUDNZD、AUDCAD、NZDCAD   ボリンジ
                      Vizzion is a fully automated scalping Expert Advisor that can be run successfully using GBPJPY currency pair at H1 timeframe. Very Important This Expert Advisor can not run with any EAs in the same account. As part of the money management plan, it calculates and monitors the Margin Level % and assumes that all open trades are created by it. If you want an Expert Advisor that trades in a daily basis, this EA is not for you because using this requires a patience to wait for a few days or weeks o
                      This Expert Advisor trades based on trend lines, as well as on the basis of volume analysis. Volumes are calculated using minute bars, in order to determine if they were ascending or descending. The trend lines are drawn based on High and Lows in the trade history. There are also additional indicators. Buy or sell signals depend on all those factors. This allows the EA to enter the market with more accuracy and to perform more deals. Input parameters Lots - lot size (if 0, a lot is calculated
                      The Moving Average Convergence Divergence (MACD) is a popular technical analysis tool used by traders and analysts to identify trends and potential buy or sell signals in a financial instrument, such as a stock, currency pair, or commodity. It's essentially a combination of two moving averages, often referred to as the "fast" and "slow" moving averages. Here's how the MACD is calculated: Fast Moving Average (12-period EMA): This is a 12-period Exponential Moving Average (EMA) of the asset's pric
                      Indicator which identifies Trend and also buy/sell opportunities. Use for entries aligned to the Trend.  Although Diamond Trend is very accurate identifying entry points, it is always recommended to use a support indicator in order to reconfirm the operation. Remind to look for those Assets and Timeframes which best fit to your trader behavior/need... Valid for Scalping and Long Term operations. Please, set up a Bars Chart to be able to visualize the indicator properly...  ...And remind to give
                      Gyroscope        professional forex expert   (for EURUSD, GBPUSD, USDJPY, AUDUSD, USDCHF, EURGBP, EURJPY, NZDUSD, USDCAD, EURCHF, AUDJPY, CADJPY pairs)   alyzing the market using the Elliot Wave Index. Elliott wave theory is the interpretation of processes in financial markets through a system of visual models (waves) on price charts. The author of the theory, Ralph Elliott, identified eight variants of alternating waves (of which five are in the trend and three are against the trend). The mo
                      The Official Automated Version of the Reliable Indicator PipFinite Breakout EDGE EA Breakout EDGE takes the signal of PipFinite Breakout EDGE indicator and manages the trade for you. Because of numerous financial instruments to consider, many traders want the signals to be fully automated. The EA will make sure all your trades are executed from entry to exit. Saving you time and effort while maximizing your profits. The Edge of Automation Effortless price action trading is now possible
                      Alpha Trend
                      Evgeny Belyaev
                      3.33 (3)
                      Alpha Trend is a trend indicator for the MetaTrader 4 platform; it has been developed by a group of professional traders. The Alpha Trend indicator finds the most probable tendency reversal points, which allows making trades at the very beginning of a trend. This indicator features notifications, which are generated whenever a new signal appears (alert, email, push-notification). This allows you to open a position in a timely manner. Alpha Trend does not redraw, which makes it possible to evalua
                      "The trend is your friend" is one of the best known sayings in investing, because capturing large trendy price movements can be extremely profitable. However, trading with the trend is often easier said than done, because many indicators are based on price reversals not trends. These aren't very effective at identifying trendy periods, or predicting whether trends will continue. We developed the Trendiness Index to help address this problem by indicating the strength and direction of price trend
                      Taurus All4 Taurus All4 is a high-performance indicator, it will tell you the strength of the trend, and you will be able to observe the strength of the candle. Our indicator has more than 4 trend confirmations. It is very simple and easy to use. Confirmation Modes Candle Trend Confirmations: When the candle switches to light green the trend is high. When the candle switches to light red the trend is reverting down. When the candle changes to dark red the trend is low. Trendline Trend Conf
                      ロボットは、ボリンジャーバンド指標のラインをブレイクする取引戦略を使用します。 この戦略の本質は、インジケーターラインの継続的な分析と、そのラインの最も効果的なブレイクアウトポイントの検索にあります。 価格がいずれかの方向で指標線を突破すると、ロボットはその方​​向で取引を開始し、それに追従し始めますが、ロボットは指標線が突破されるたびに取引を開始するわけではなく、指標線が突破された場所でのみ取引を開始しますそれが最も効果的であると考えられます。 これは、世界中の何千人ものトレーダーによって長年にわたってテストされてきた、非常に信頼できる戦略です。 これは、GPTchat が学習のために提供する実用的なスキャルピング戦略の 1 つです。 人工知能は、これが M5 時間枠で最も効果的な取引スキャルピング戦略の 1 つであると信じています。 私たちは人工知能にも同意し、この戦略の実際の有効性を確認します。 ロボットの利点: マーチンゲールは使用しません。 ロットサイズはトレーダーが設定で指定します。 残高が10%増加するごとにロットが10%増加します ロボットは適応型リスク管理機能を
                      *This is TradingView indicator converted to mql4* The SuperTrend V indicator is a popular technical analysis tool used to identify trends and potential trend reversals in financial markets. It is based on the concept of the SuperTrend indicator but incorporates additional features and variations. The SuperTrend V indicator uses a combination of price action and volatility to determine the trend direction and generate trading signals. Here are the key components and features of the indicator:
                      The trend is your friend! This is what this indicator is all about. Follow this famous saying and be safe. Characteristics: Buy/Sell signals fixed on the close of a bar. Works on all symbols and all timeframes. Clear visual market trend laser line, Buy/Sell signal arrows, market strength meter, TP1 & TP2 boxes. Visual signals when to enter, when to exit the market. No repainting. Compatible with Flexible EA for trading automation. (Ask for a free set file optimized to perform 2010-2018) Para
                      Many traders, especially the beginners, get tired of manual trading and start using robots. Of course, advertising plays a significant role in choosing the algorithm. Often, system and EA vendors hide information about their product until the customer buys it. Profit Hunter EA is no exception, so in our review we will try to find out whether this robot is efficient or you should better search for its counterparts. Profit Hunter EA  A variation of the "martingale" technique used in the EA is
                      Elevate your trading experience with   Dynamic Trader EA MT4 , a cutting-edge trading robot designed to optimize your investment strategy. This advanced algorithm harnesses the power of four key indicators:   RSI   ( Relative Strength Index ),   Stochastic Oscillator ,   MACD   ( Moving Average Convergence Divergence ) and   ATR   ( Average True Range ) to make informed and precise trading decisions. ATR is used to dynamically set stop-loss and take-profit levels based on market volatility. IMP
                      Red Hawk EA
                      Profalgo Limited
                      4.22 (18)
                      NEW PROMO: Only a few copies copies available at 349$ Next price: 449$ Make sure to check out our " Ultimate EA combo package " in our   promo blog ! Red Hawk is a "mean reversion" trading system, that trades during the quiet times of the market. It runs on 9 pairs currently: EURUSD, GBPUSD, USDCHF, EURCHF, EURGBP, AUCAD, AUDJPY, EURAUD and USDCAD. Recommended timeframe: M5 Since this kind of strategy works best with low spread and fast execution, I advise using an good ECN broker. IMPORTANT
                      無限からの通貨の強さを測定するためのこの革新的な指標は、長い間取引されているダフ屋やトレーダーにとって不可欠な助手です。 通貨の強さ/弱さを分析するためのシステムは、世界の主要なトレーダーによって市場で長い間知られており、使用されてきました。 任意の裁定取引は、この分析なしでは完全ではありません。 私たちの指標は、互いに関連して基本通貨の強さを簡単に決定します。 これは、インスタント分析を可能にし、最強のエントリポイントを検索し、すべてまたは現在の通貨ペアの折れ線グラフが表示されます。 インジケータは直感的で、すぐに見つけて任意のペアに切り替えることができ、地下室とメインチャートの両方に配置できるモバイルパネルがあります。 通貨の強さの変化の通知のタイマーモードは、トレーダーに電話で通知を受け取る機会を与えます。  通貨パワーメーターインフィニティ指標を使用するためのいくつかの戦略: 1. 通貨の強さの線形表示のチャートを使用して、交差点を新興トレンドの信号として検索します 2. トレンド反転信号が表示された後、強い通貨の方向に頭皮 3. 通貨の強さの発散分析を使用して、
                      このプロダクトを購入した人は以下も購入しています
                      Gann Made Easy は、ミスター・ギャンの理論を使用した取引の最良の原則に基づいた、プロフェッショナルで使いやすい外国為替取引システムです。 W・D・ガン。このインジケーターは、ストップロスとテイクプロフィットレベルを含む正確な買いと売りのシグナルを提供します。 PUSH通知を利用して外出先でも取引可能です。 購入後はご連絡ください!私の取引のヒントと素晴らしいボーナスインジケーターを無料で共有します! おそらく、ギャンの取引手法についてはすでに何度も聞いたことがあるでしょう。通常、ギャンの理論は初心者のトレーダーだけでなく、すでにある程度の取引経験がある人にとっても非常に複雑なものです。なぜなら、ギャンの取引手法は理論的にはそれほど簡単に適用できるものではないからです。私はその知識を磨き、最良の原則を私の外国為替インジケーターに組み込むために数年を費やしました。 このインジケーターは非常に簡単に適用できます。必要なのは、それをチャートに添付し、簡単な取引推奨事項に従うだけです。このインジケーターは常に市場分析の仕事を行い、取引の機会を探します。適切なエントリーポイントを検出
                      驚異的なFXインジケーター「Miraculous」をご紹介します。完璧な結果を得るための1時間足を含むすべてのタイムフレームで効果的に機能する、最強の強力な特殊MT4フォレックスインジケーターです。 すべてのタイムフレームで優れた結果を提供する最高のFXインジケーターを探し続けるのに疲れましたか?これ以上探す必要はありません!「Miraculous」フォレックスインジケーターをご紹介します。このインジケーターは、トレーディングの経験を変革し、収益を新たなレベルに引き上げるために設計されました。 先進のテクノロジーと長年にわたる緻密な開発に基づいて構築された「Miraculous」フォレックスインジケーターは、FX市場における力と正確さの頂点となります。この素晴らしいツールは、すべてのレベルのトレーダーのニーズを満たすように設計されており、一貫した収益性を追求する上で比類のない優位性を提供します。 「Miraculous」フォレックスインジケーターの他との違いは、その非常に適応性にあります。デイトレーダー、スウィングトレーダーであろうと、長期ポジションを好む方であろうと、このインジケータ
                      現在20%OFF! 初心者やエキスパートトレーダーのためのベストソリューション! このダッシュボードソフトウェアは、28の通貨ペアで動作しています。それは私達の主要な指標(高度な通貨の強さ28と高度な通貨インパルス)の2に基づいています。それは全体の外国為替市場の大きい概観を与えます。それは、すべての(9)時間枠で28の外国為替ペアのための高度な通貨の強さの値、通貨の動きの速度と信号を示しています。チャート上で1つのインディケータを使用して市場全体を観察し、トレンドやスキャルピングの機会をピンポイントで見つけることができたら、あなたのトレードがどのように改善されるか想像してみてください。 このインディケータには、強い通貨と弱い通貨の識別、潜在的な取引の識別と確認がより簡単になるような機能が搭載されています。このインディケータは、通貨の強さや弱さが増加しているか減少しているか、また、すべての時間枠でどのように機能しているかをグラフィカルに表示します。 新機能として、現在の市場環境の変化に適応するダイナミックなマーケットフィボナッチレベルが追加され、すでに当社のAdvan
                      TPSpro TRENDPRO  - is a trend indicator that automatically analyzes the market and provides information about the trend and each of its changes, as well as giving signals for entering trades without redrawing! The indicator uses each candle, analyzing them separately. referring to different impulses - up or down impulse. Exact entry points into transactions for currencies, crypto, metals, stocks, indices!  -  Version MT5               DETAILED DESCRIPTION        /       TRADING SETUPS           
                      A key element in trading is zones or levels from which decisions to buy or sell a trading instrument are made. Despite attempts by major players to conceal their presence in the market, they inevitably leave traces. Our task was to learn how to identify these traces and interpret them correctly. Reversal First Impulse levels (RFI)   -  Version MT5                INSTRUCTIONS                 RUS                 ENG                                       R ecommended to use with an indicator   -  
                      現在26%オフ 初心者やエキスパートトレーダーに最適なソリューション! このインジケーターは、独自の機能と新しい計算式を取り入れた、ユニークで高品質、かつ手頃な価格のトレーディングツールです。たった1枚のチャートで28の為替ペアの通貨強度を読み取ることができます。新しいトレンドやスキャルピングチャンスの引き金となるポイントを正確に特定することができるので、あなたのトレードがどのように改善されるか想像してみてください。 ユーザーマニュアルはこちら  https://www.mql5.com/en/blogs/post/697384 これが最初の1本、オリジナルだ! 価値のないクローンを買わないでください。 特別な サブウィンドウの矢印で強い通貨の勢いを表示 GAPがあなたのトレードを導く! 基準通貨や気配値が売られすぎ・買われすぎのゾーン(外相フィボナッチレベル)にあるとき、個別チャートのメインウィンドウに警告表示。 通貨がレンジの外側から反落した場合、プルバック/リバーサルのアラート。 クロスパターンの特別なアラート 複数の時間枠を選択可能で、トレンドを素早く
                      まず第一に、この取引インジケーターは再描画されず、再描画されず、遅延しないことを強調する価値があります。これにより、手動取引とロボット取引の両方に理想的なものになります。 アトミックアナリストは、価格の強さとモメンタムを利用して市場でより良いエッジを見つけるためのPA価格アクションインジケーターです。ノイズや誤ったシグナルを除去し、取引ポテンシャルを高めるための高度なフィルターを備えています。複雑なインジケーターの複数のレイヤーを使用して、アトミックアナリストはチャートをスキャンし、複雑な数学的計算をシンプルなシグナルと色に変換します。これにより、どのような初心者トレーダーでも理解して使用し、一貫した取引の決定を行うことができます。 「アトミックアナリスト」は、新規および経験豊富なトレーダー向けにカスタマイズされた包括的な取引ソリューションです。プレミアムインジケーターとトップノッチの機能を1つの取引戦略に組み合わせ、すべてのタイプのトレーダーにとって汎用性のある選択肢にします。 デイリートレーディングとスキャルピング戦略:高速で正確なデイトレーディングおよび短期トレード
                      An exclusive indicator that utilizes an innovative algorithm to swiftly and accurately determine the market trend. The indicator automatically calculates opening, closing, and profit levels, providing detailed trading statistics. With these features, you can choose the most appropriate trading instrument for the current market conditions. Additionally, you can easily integrate your own arrow indicators into Scalper Inside Pro to quickly evaluate their statistics and profitability. Scalper Inside
                      TrendMaestro
                      Stefano Frisetti
                      5 (2)
                      note: this indicator is for METATRADER4, if you want the version for METATRADER5 this is the link: TRENDMAESTRO recognizes a new TREND in the bud, he never makes mistakes. The certainty of identifying a new TREND is priceless. DESCRIPTION TRENDMAESTRO identifies a new TREND in the bud, this indicator examines the volatility, volumes and momentum to identify the moment in which there is an explosion of one or more of these data and therefore the moment in which prices have strong probability of f
                      Step into the realm of Forex trading with confidence and precision using XQ, a cutting-edge Forex indicator designed to elevate your trading game to unprecedented heights. Whether you're a seasoned trader or just stepping into the world of currency exchange,   XQ Forex Indicator   empowers you with the insights and signals needed to make informed trading decisions. The signal conditions are a combination of three indicators, and XQ Forex Indicator only display  medium and long-term trends . The
                      カスタムMT4インジケーターで外国為替取引を成功させるための秘密を発見してください! 外国為替市場で成功を達成し、リスクを最小限に抑えながら一貫して利益を得る方法を疑問に思ったことはありますか? これがあなたが探している答えです! 取引へのアプローチに革命をもたらす独自のMT4インジケーターを導入できるようにします。 ユニークな汎用性 私たちのインジケータは、RenkoとRangeBarのろうそくのフォーメーションを好むユーザー向けに特別に設計されています。 これらのチャートタイプは多くの経験豊富なトレーダーに好まれていることを理解しています。そのため、私たちのインジケーターはそれらとシームレスに統合され、比類のない市場分析を提供します。 クリアトレンドシグナル 複雑な分析を忘れてください! 私たちのインジケーターは、鮮やかな色と明確なドット構造を利用して、市場の動向を明確に示しています。 赤と青の点は、価格の動きの方向性について疑いの余地がなく、取引の迅速な意思決定を可能にします。 HH/HL HL/LL戦略とのアライメント HH/HLおよびHL/LL構
                      通貨強さウィザードは、取引を成功させるためのオールインワン ソリューションを提供する非常に強力な指標です。このインジケーターは、複数の時間枠のすべての通貨のデータを使用して、このまたはその外国為替ペアのパワーを計算します。このデータは、使いやすい通貨インデックスと通貨パワーラインの形式で表され、特定の通貨のパワーを確認するために使用できます。 必要なのは、取引したいチャートにインジケーターを接続することだけです。インジケーターは、取引する通貨の実際の強さを示します。このインジケーターは、トレンドに合わせて取引するときに有利に利用できる売買高の圧力の極値も示します。このインジケーターには、フィボナッチに基づく可能なターゲットも表示されます。 このインジケーターは、PUSH 通知を含むあらゆるタイプのアラートを提供します。 購入後ご連絡下さい。私の取引のヒントをあなたと共有し、素晴らしいボーナスインジケーターを無料で提供します! 幸せで有益な取引をお祈りします。
                      Advanced Supply Demand
                      Bernhard Schweigert
                      4.92 (310)
                      現在33%オフ 初心者にもエキスパートトレーダーにも最適なソリューション このインジケーターは独自の機能と新しい公式を多数内蔵しており、ユニークで高品質かつ手頃な取引ツールです。このアップデートでは、2つの時間枠ゾーンを表示できるようになります。より長いTFだけでなく、チャートTFとより長いTF(ネストゾーンを表示)の両方を表示できます。すべてのSupply Demandトレーダーの皆さんのお気に召すはずです。:) 重要情報の公開 Advanced Supply Demandの可能性を最大化するには、 https://www.mql5.com/ja/blogs/post/720245 にアクセスしてください。   エントリーまたはターゲットの正確なトリガーポイントを正確に特定できれば取引がどのように改善されるか想像してみてください。新しい基盤となるアルゴリズムに基づいて構築されているため、買い手と売り手の間の潜在的な不均衡をさらに簡単に特定できます。これは、最も強い需要と供給のゾーンと、過去のパフォーマンス(古いゾーンを表示)がグラフィカルに表現されるためです。これらの機能は、最適
                      ご紹介   クォンタム トレンド スナイパー インジケーターは 、トレンド反転を特定して取引する方法を変革する画期的な MQL5 インジケーターです。 13年以上の取引経験を持つ経験豊富なトレーダーのチームによって開発されました。     クォンタムトレンドスナイパーインジケーター   は、非常に高い精度でトレンドの反転を識別する革新的な方法で、あなたのトレーディングの旅を新たな高みに押し上げるように設計されています。 ***Quantum Trend Sniper Indicatorを購入すると、Quantum Breakout Indicatorを無料で入手できます!*** クォンタム ブレイクアウト インジケーターは、トレンドの反転を特定するとアラートを発し、矢印を示し、3 つのテイクプロフィットレベルを提案します。 初心者トレーダーにもプロのトレーダーにも適しています。 量子EAチャネル:       ここをクリック MT5のバージョン:       ここをクリック 推奨事項: 期間: すべての時間枠。最良の結果を得るには、
                      ご紹介     Quantum Breakout PRO は 、ブレイクアウト ゾーンの取引方法を変革する画期的な MQL5 インジケーターです。 13年以上の取引経験を持つ経験豊富なトレーダーのチームによって開発された Quantum Breakout PROは 、革新的でダイナミックなブレイクアウトゾーン戦略により、あなたの取引の旅を新たな高みに押し上げるように設計されています。 クォンタム ブレイクアウト インジケーターは、5 つの利益ターゲット ゾーンを備えたブレイクアウト ゾーン上のシグナル矢印と、ブレイクアウト ボックスに基づいたストップロスの提案を提供します。 初心者トレーダーにもプロのトレーダーにも適しています。 量子EAチャネル:       ここをクリック MT5バージョン:   ここをクリック 重要!購入後、インストールマニュアルを受け取るためにプライベートメッセージを送ってください。 推奨事項: 時間枠: M15 通貨ペア: GBPJPY、EURJPY、USDJPY、NZDUSD、XAUUSD アカウントの種類: ECN、Raw、また
                      の紹介     Quantum平均足PRO チャート 市場のトレンドに対する明確な洞察を提供するように設計された平均足キャンドルは、ノイズを除去し、誤ったシグナルを排除する能力で知られています。混乱を招く価格変動に別れを告げ、よりスムーズで信頼性の高いチャート表現を導入しましょう。 Quantum Heiken Ashi PRO を真にユニークなものにしているのは、従来のローソク足データを読みやすい色のバーに変換する革新的なフォーミュラです。赤と緑のバーはそれぞれ弱気トレンドと強気トレンドをエレガントに強調し、潜在的なエントリーポイントとエグジットポイントを驚くほど正確に見つけることができます。 量子EAチャネル:       ここをクリック MT5のバージョン:       ここをクリック この注目すべき指標には、いくつかの重要な利点があります。 明確性の向上: 価格変動を平滑化することで、平均足バーは市場トレンドをより明確に表現し、有利な取引機会を特定しやすくします。 ノイズの削減: 誤ったシグナルを引き起こすことが多い不安定な価格変動に別れを告げます。 Quan
                      ON Trade Waves Patterns Harmonic Elliot Wolfeをご紹介します。これは手動および自動の方法を使用して市場のさまざまなパターンを検出するために設計された高度なインジケーターです。以下はその動作方法です: ハーモニックパターン: このインジケーターは、チャートに表示されるハーモニックパターンを識別できます。これらのパターンは、Scott Carneyの「Harmonic Trading vol 1および2」で説明されているように、ハーモニックトレーディング理論を実践するトレーダーにとって重要です。手動で描画するか、自動検出に頼るかにかかわらず、ON Trade Waves Patternsがお手伝いします。 コントロールパネル: このインジケーターはユーザーフレンドリーなコントロールパネルを備えています。チャートと時間枠の設定を保存し、異なる構成間をスムーズに切り替えることができます。チャートスペースを最大限に活用するために最小化することもできます。他の分析ツールで作業することを好む場合、閉じるボタンをクリックするだけで、すべてのインジケーターデ
                      Scalper Vault は、スキャルピングを成功させるために必要なすべてを提供するプロフェッショナルなスキャルピング システムです。このインジケーターは、外国為替およびバイナリー オプションのトレーダーが使用できる完全な取引システムです。推奨される時間枠は M5 です。 システムは、トレンドの方向に正確な矢印シグナルを提供します。また、トップとボトムのシグナルとギャン マーケット レベルも提供します。 インジケーターは、プッシュ通知を含むすべてのタイプのアラートを提供します。 インジケータの購入後にご連絡ください。私の個人的な取引の推奨事項と素晴らしいボーナス指標を無料で共有します! 幸せで有益な取引をお祈りします!
                      PRO Renko Systemは、特別にRENKOチャートを取引するために設計された高精度の取引システムです。 これは、様々な取引商品に適用することができる普遍的なシステムです。 システムは効果的に正確な逆転信号へのアクセスを与えるいわゆる市場の騒音を中和する。 表示器は非常に使いやすく、信号の生成に責任がある1つの変数だけがあります。 あなたは簡単にお好みの任意の取引ツールとレンコバーのサイズにツールを適応させることができます。 私はいつもあなたが私のソフトウェアで収益性の高い取引を支援するために余分なサポートを提供する準備ができています! 私はあなたに幸せで収益性の高い取引をしたいです! ご購入後にご連絡ください! 私はあなたに私のレンコチャートジェネレータを送信します。 私はまた、私の個人的な推奨事項やシステムの他のモジュールを無料で共有します!
                      mql5と Telegramの モーニング・ブリーフィングで、詳細とスクリーンショットを含む毎日のマーケット・アップデートをご覧 ください! FX Power MT4 NGは 、長年の人気を誇る通貨強度計FX Powerの次世代モデルです。 この次世代ストレングスメーターは何を提供するのでしょうか?初代FXパワーの魅力すべて プラス GOLD/XAUの強さ分析 より正確な計算結果 個別に設定可能な分析期間 カスタマイズ可能な計算上限値により、さらに優れたパフォーマンスを実現 もっと見たい人のための特別なマルチインスタンス設定 すべてのチャートでお好みの色を無限に設定可能 数え切れないほどの通知オプションにより、重要なことを見逃すことはありません。 Windows 11とmacOSのスタイルで角を丸くした新しいデザイン 魔法のように動くインジケーターパネル FXパワーの主な機能 すべての主要通貨の強さの完全な履歴 すべての時間枠における通貨の強さの履歴 すべてのブローカーとチャートで同一の計算結果 100%信頼できるリアルタイム計算 -> リペイントなし ドロップダウン・リストから
                      現在31%オフ! 初心者やエキスパートトレーダーに最適なソリューション! このインジケータは、独自の機能と秘密の数式を組み込んだ、ユニークで高品質かつ手頃な価格のトレーディングツールです。たった1枚のチャートで28の通貨ペアのアラートを表示します。新しいトレンドやスキャルピングチャンスの引き金となるポイントを正確に把握することができるので、あなたのトレードがどのように改善されるか想像してみてください! 新しい基本的なアルゴリズムに基づいて構築されているため、潜在的な取引の特定と確認がより簡単になります。これは、通貨の強さや弱さが加速しているかどうかをグラフィカルに表示し、その加速のスピードを測定するためです。加速すると物事は明らかに速く進みますが、これはFX市場でも同じです。つまり、反対方向に加速している通貨をペアにすれば、利益を生む可能性のある取引を特定することができるのです。 通貨の勢いを示す縦の線と矢印は、あなたの取引の指針となるでしょう。 ダイナミックマーケットフィボナッチ23レベルはアラートトリガーとして使用され、市場の動きに適応します。もしインパルスが黄色
                      まず最初に、このトレーディングシステムがリペイントされず、再描画されず、遅延しないことを強調する価値があります。これにより、プロのトレーディングに最適な状態になります。 「スマートサポートアンドレジスタンストレーディングシステム」は、新規および経験豊富なトレーダー向けにカスタマイズされた高度なインジケーターです。この包括的なシステムは、7以上の戦略、10のインジケーター、およびデイトレード戦略、スイングトレード戦略、サポートおよびレジスタンス戦略、ローソク足パターン戦略、VWAP戦略、マルチタイムフレームトレンド戦略など、さまざまなトレーディングアプローチを組み合わせています。これは、矢印信号、エントリーポイント、出口ポイント、トレードアラート、より高い時間枠のトレンド分析、リアルタイムのトレードモニタリング、そして洞察力のあるトレンドとボリュームキャンドルの着色を提供します。自動的なサポートとレジスタンスの検出により、さまざまな市況下でトレーダーが的確な決定を下すのを支援する多面的なインジケーターとなっています。 スマートサポートアンドレジスタンストレーディングシステムは、
                      TrendDecoder Premium
                      Christophe, Pa Trouillas
                      5 (2)
                      レンジと次の動きを特定    |  トレンドの最も早いシグナルと強さを得る   |  反転の前に明確な出口を得る   |  価格がテストするフィボ・レベルを見つける。 非リペイント、非遅延インディケータ - マニュアルおよび自動売買に最適 - すべての資産、すべての時間単位に対応 期間限定キャンペーン   >> 50%OFF 購入後、 推奨セッティングについては、このチャンネルで私に連絡してください。 MT5 バージョン: ここをクリック BladeSCALPER   と   PowerZONES   を使った完全な方法を入手する どのようなものですか? TrendDECODERは、トレンド監視をシンプルかつ簡単にするための複数のイノベーションを集約したものです。 Projective TrendLine (投影トレンドライン) - 今後のトレンドのスピードリファレンス。 RealTime TrendLine vs. Projective TrendLine (リアルタイムトレンドライン vs. Projective TrendLine) - 市場が同じ方
                      Zeusインジケーターのご紹介:トレーディングでの究極の利益ブレークスルーをサポートするツール。 このインジケーターは、ブレイクアウト戦略と深い分析の必要性を排除し、トレーディングを簡素化します。設定した時間フレームに基づいてゾーンを自動的に描画し、ストップロス(SL)、テイクプロフィット(TP)、トレーリングストップのレベルを提案します。 Zeusインジケーターは、価格が買いポイントまたは売りポイントに近づいた際に、すぐに通知し、シグナル矢印を表示します。さらに、4つの異なるテイクプロフィットレベルとさまざまなトレーリングストップオプションの推奨も行います。 このツールは初心者から熟練のトレーダーまで対応しています。 チャンネルサポート: こちらをクリック ストア: こちらをクリックしてください。 MT5バージョン: こちらをクリック おすすめ: 時間枠: M5またはM15 通貨ペア: すべての通貨ペアと互換性があります アカウントタイプ: すべてのアカウントタイプと互換性があります おすすめのストップロス: Zeusインジケーターが提供するSLの提案をご利用ください おすすめの
                      Cycle Sniper
                      Elmira Memish
                      4.41 (34)
                      NEW YEAR SALE PRICE FOR LIMITED TIME!!! Please contact us after your purchase and we will send you the complimentary indicators to complete the system Cycle Sniper is not a holy grail but when you use it in a system which is explained in the videos, you will feel the difference. If you are not willing to focus on the charts designed with Cycle Sniper and other free tools we provide, we recommend not buying this indicator. We recommend watching the videos about the indiactor and system before pu
                      TakePropips Donchian Trend Pro
                      Eric John Pajarillaga Aldana
                      4.82 (17)
                      TakePropips Donchian Trend Pro   (MT4) は、ドンチャン チャネルを使用してトレンドの方向を自動的に検出し、エントリーとエグジットの取引シグナルを提供する強力で効果的なツールです! この多機能インジケーターには、トレンド スキャナー、取引シグナル、統計パネル、スクリーナー、取引セッション、およびアラート履歴ダッシュボードが含まれます。取引シグナルを提供し、チャートを分析する時間を節約するように設計されています! ユーザー マニュアルとインストール ガイドは、ブログ投稿 (   https://www.mql5.com/en/blogs/post/751368   ) からダウンロードできます。 今日は 50% オフ! 98ドルから49ドルに値下げ! このインジケーターは、ストラテジー テスターでテストできます (ビジュアル モードを有効にします)。ライブ チャートでテストしたい場合は、7 日間の試用版を入手するようにメッセージを送ることもできます。 詳細については、説明の下にあるビデオ チュートリアルも利用できます。 ご不明な点やサポートが必
                      IX Powerは 、FX Powerの無敵の精度をついにFX以外のシンボルにも提供します。 お気に入りの指数、株式、コモディティ、ETF、さらには暗号通貨の短期、中期、長期のトレンドの強さを正確に判断します。 お使いの端末が提供する すべてを分析する ことができます。ぜひお試しいただき、取引 タイミングが大幅に改善 されることをご体験ください。 IXパワーの主な特徴 100%正確で再描画されない計算結果 - ターミナルで利用可能なすべての取引シンボルに対して 予め設定され、さらに個別に設定可能な強度分析期間のドロップダウン選択 Eメール、メッセージ、モバイル通知による無数の通知オプション EAリクエストのためのアクセス可能なバッファ カスタマイズ可能な計算制限により、さらに優れたパフォーマンスを実現 もっと見たい人のための特別なマルチインスタンス設定 すべてのチャートでお好みの色を無限に設定可能 Windows 11とmacOSのスタイルで角を丸くした新しいパネルデザイン サブ・ウィンドウとメイン・チャートの間をシームレスに移動する、魔法のように動く
                      このインディケータは、当社の2つの製品 Advanced Currency IMPULSE with ALERT  +   Currency Strength Exotics . のスーパーコンビネーションです。 このインジケーターは全ての時間枠で作動し、8つの主要通貨と1つのシンボルの強弱のインパルスをグラフで表示します。 このインジケータは、金、エキゾチックペア、商品、インデックス、先物など、あらゆるシンボルの通貨強度の加速度を表示することに特化されています。金、銀、原油、DAX、US30、MXN、TRY、CNHなどの通貨強度の加速度(インパルスまたは速度)を表示するために、任意のシンボルを9行目に追加できる、この種の最初のものです。 新しいアルゴリズムに基づいて構築され、潜在的な取引の特定と確認がさらに容易になりました。これは、通貨の強さや弱さが加速しているかどうかをグラフィカルに表示し、その加速の速度を測定するためです。加速すると物事は明らかに速く進みますが、これはFX市場でも同じです。つまり、反対方向に加速している通貨をペアリングすれば、潜在的に利益を生む取
                      FX Volume
                      Daniel Stein
                      4.6 (35)
                      mql5と Telegramの モーニング・ブリーフィングで、詳細とスクリーンショットを含む毎日のマーケット・アップデートをご覧 ください! FX Volumeは、ブローカーの視点から市場のセンチメントをリアルに洞察する、最初で唯一の出来高インジケーターです。 ブローカーのような機関投資家が外国為替市場でどのようなポジションをとっているか、COTレポートよりもはるかに速く、素晴らしい洞察を提供します。 この情報をチャート上で直接見ることは、あなたの取引にとって真のゲームチェンジャーであり、画期的なソリューションです。 以下のようなユニークなマーケットデータ洞察から利益を得てください。 比率は 、通貨のロングポジションとショートポジションの比率をパーセントで表示します。 比率の変化は 、選択した期間内のロング比率とその変化率を表示します。 Volumes Totalは 、通貨の取引量(ロングとショート)の合計をロット単位で表示します。 Volumes Long :全通貨のロングポジションの取引量を表示します。 Volumes(ショート )は、全通貨のショートポジションの取引量を表示
                      Gann Signal is a very simple indicator at first glance, but hidden inside is many years of experience in studying W.D.Ganna methods. The indicator gives accurate BUY/SELL signals, without redrawing. The indicator is very easy to use. All you need to do is attach it to your chart and follow its recommendations. The indicator constantly analyzes the market for entry opportunities. When such an opportunity appears, the indicator gives a signal in the form of an arrow. I repeat, all signals are NOT
                      作者のその他のプロダクト
                      Moving Average Cloud
                      Muhammad Elbermawi
                      4.93 (14)
                      または「MAC」。 これは、トレンドをキャプチャしてトレードするのに役立つように設計されたインジケーターです。この指標の背後にある考え方は、次のステップで説明できます。 移動の速い平均エンベロープを描画します。 移動の遅い平均エンベロープを描画します。 MACアッパーバンドは、両方のエンベロープの高値の間の最大値です。 MAC下限帯域は、両方のエンベロープの下限間の最小値です。 MACヒストグラムクラウドは、2つのバンド間の距離を埋めて、方向の変化を示します。 青い雲は上昇傾向を示し、赤い雲は下降傾向を示します。 次のブログを読んで、MACバッファーを使用して独自のEAまたはスキャナーを構築する方法を確認してください。 https://www.mql5.com/en/blogs/post/734293 MACの使い方 トレンドの方向性を特定するのに役立つフィルターとしてMACクラウドを使用します。 通常の取引ツールを使用してMACクラウドの方向に取引し、誤ったシグナルを可能な限り排除します。 提案されたエントリ矢印を使用して、開始する強力なトレンドポイントを見つ
                      Bermaui Bands
                      Muhammad Elbermawi
                      4.94 (89)
                      Bermaui Bands(BB)は、レンジとトレンドの価格変動をフィルタリングするのに役立つテクニカル分析ツールです。この指標の背後にある考え方は、次のステップで説明できます。 標準偏差を0〜100の間で移動するオシレーターとして計算します。これをBermaui偏差パーセント(BD%)と名付けます。 「BD%」がゼロに近い場合、ボラティリティは極端になります。さらに、「BD%」が100に近い場合、ボラティリティは非常に低くなります。 ボラティリティが高いということは、トレンド市場の可能性が高いことを意味し、ボラティリティが低いということは、横向きまたはレンジング市場を意味します。 標準偏差はSMAに基づいて計算されるため、中央の線は単純移動平均(SMA)です。 計算で同じバー数の単純移動平均に「BD%」を追加して、アッパーベルマウイバンドを取得します。 計算で同じ数のバーを使用した単純な移動平均から「BD%」を減算して、Lower BermauiBandsを取得します。 重要な情報 Bermaui Bandsユーザーズマニュアル: https://www.mql5.com/en/b
                      Bermaui Manual EA
                      Muhammad Elbermawi
                      5 (10)
                      これは、グリッドシステムを取引する半自動のエキスパートアドバイザーです。アイデアは、市場で徐々にさまざまなポジションを取り、次にそれらの損益分岐点を計算することです。価格がこの損益分岐点を所定の距離だけ通過すると、すべての未決済注文がクローズされます。 重要な情報 ユーザーガイドは次のとおりです。   https://www.mql5.com/en/blogs/post/730567 このEAは、他のどの製品でも試すことができ ます。https://www.mql5.com/en/users/bermaui314/seller 重要な機能 EAには、予期しない結果から取引資本を保護するためのストップロスメカニズムがあります。 EURUSD-XAUUSD-Oil-BitcoinのようなMT4シンボルを取引することができます。 MT4の時間枠をトレードすることができます。 VPSからEAを実行することをお勧めします。 パラメータとデフォルト設定 1)お金の管理設定 ロットを開始します。 レバレッジが1:400以上の場合、デフォルト設定で500ドルごとに0.0
                      または(BD%)は、ポイントではなくパーセントでボラティリティを測定するボラティリティ指数です。 BD%の考え方は、0から100パーセントの間で移動するClassic Standard Deviation(CSD)に応じてインデックスを作成することです。 BD%を使用して、異なる期間または異なる時間枠での同じ証券のボラティリティを比較できます。さらに、BD%を使用して、ポイントではなくパーセントで、さまざまな市場のさまざまな証券間のボラティリティを比較できます。 「BD%」の使い方 BD%が90%未満で、このレベルを上向きに超えた場合、これは価格がさまざまな領域で変動する可能性があることを示しています。 BD%が90%を上回り、その後このレベルを下向きに超え、価格がすでに単純移動平均を上回っている場合、これは新しい上昇トレンドの始まりの兆候です。 BD%がマイナス面に深くなるにつれて、ボラティリティとトレンドの強さが増しています。 BD%が0%の場合、これはボラティリティが最大値にあることを意味します。 BD%が90%を上回り、その後このレベルを下向きに超え、価
                      MASR Bands
                      Muhammad Elbermawi
                      5 (10)
                      または M oving A verage S upportコマンド R esistance バンド 。 MASRバンドインジケーターは、サポートレベルとレジスタンスレベルとして連携する2つのバンドに囲まれた移動平均です。統計的に、MASRバンドには93%の確率で価格キャンドルが含まれています。ステップ単位での計算方法は次のとおりです。 1.最初のステップは、X期間の最高値(HHV)と最低値(LLV)を計算することです。 2. 2番目のステップは、HHVをLLVで割って、それらの間の距離をパーセンテージで取得することです。このステップの結果をMASRフィルターと呼びます。 3. MASRフィルター=合計((HHV / LLV)-1)/バーの数 4.移動平均抵抗のショートカットであるアッパーバンドをMARと呼びます。移動平均サポートのショートカットである低帯域MASと呼びます。バンド間の移動平均は、センターラインと呼ばれます。 5. MAR = MASRセンター+(75%xMASRフィルターxMASRセンター) 6.MASRセンターは移動平均です。
                      または CKC。 この指標は、Chester W. Keltner(1909–1998)によって記述された古典的な10日間の移動平均ルールに応じて機能します。すべてのパラメーターはデフォルトでクラシックバージョンのケルトナーシステムに設定されていますが、ユーザーは必要に応じてパラメーターを変更できます。 重要な情報 CKCマニュアルを読む: https://www.mql5.com/en/blogs/post/736577 CKCエキスパートアドバイザーの例: https://www.mql5.com/en/blogs/post/734150 Keltner ChannelFormulaについて 1.標準価格(=(高+低+終値)/ 3)から単純移動平均として中心線を計算します。 2.同じ期間と中心線の計算方法を使用して、高値と安値の平均差である平均日次範囲(ADR)を計算します。 3.ケルトナー購入ライン=センターライン+ ADR。 4.ケルトナーセルライン=センターライン–ADR。 Keltner10日移動平均ルール ケルトナーの公式は、チャート上に2つの
                      Bermaui Pin Bars
                      Muhammad Elbermawi
                      5 (22)
                      ベルマウイピンバー または(BPB)は、チャート上でピンバーの価格アクションパターンを見つけるインジケーターです。ピンバーは「ピノキオバー」のショートカットです。これは、高い上部または下部の影と、ハンマー、逆ハンマー、ハンギングマン、シューティングスター、ドラゴンフライ同事、墓石同事などの非常に小さなボディを持つ日本のローソク足に代わる古典的なバーパターンです。 。 Bermaui Pin Barsインジケーターは、次のステップで説明できる式に応じてこのパターンを見つけます。 最初に、BPBはろうそくの本体の中心を計算します(= [開く+閉じる] / 2)。 次に、BPBは、体の中心とろうそくの間の距離が低いことを検出します。 最後のステップは、ステップ2の結果をろうそくの範囲で割ることです。 ろうそくの本体の中心がろうそくの高さまたは低さに近すぎる場合、BPBはピンバーパターンを検出し、ユーザーに警告します。 ベルマウイピンバーフォーミュラ : https://www.mql5.com/en/blogs/post/729139 以下を追加して、Bermauiピンバーの機能を強
                      BACD Cloud
                      Muhammad Elbermawi
                      4.57 (7)
                      または、 B ermaui A verage C onvergence D ivergence Cloud は、トレンドの方向を示し、その強さをパーセントで測定するオシレーターです。 BACDクラウドの計算は次のとおりです。 1-2つの指数移動平均を計算します。それらの1つは他よりも高速です。最初の(速い)と2番目の(遅い)と呼びます 2-それらの間の中心を見つけます。ここで、Center MA =(Fast + Slow)/ 2 3-次のようにBACDラインを計算します。BACD= 100 *(高速/中央MA) 4-BACDの指数移動平均であるBACD信号線を計算します。式は次のようになります。BACDSignal= EMA(BACD) 5-チャートからBACDシグナルラインを非表示にします。 6- BACDヒストグラムラインを計算します。これは、BACDラインとその信号ラインの差です。 (注:BACDヒストグラムは、ヒストグラムではなく線としてチャートに描画されます。) 7-(BACD Line> BACD Histogram Line)の場合、
                      Or DBD%. The indicator consists of colored tape that shows trading signals depending on two Bermaui Deviation Oscillator (BD%) and two moving averages. Bermaui Deviation Percent is a volatility index that measures volatility in percent rather than points. The idea of BD% is to make an index depending on Classic Standard Deviation (CSD) that moves between 0 and 100 percent. Important Information DBD% expert advisor example:  https://www.mql5.com/en/blogs/post/731145 If you want to know mor
                      Bermaui Channel
                      Muhammad Elbermawi
                      5 (27)
                      This is a price channel that shows five important price levels on the chart. Those levels are: 1. The Highest High (HH) of the previous x bars. 2. The Highest Low (HL) of the previous x bars. 3. The Center Line. 4. The Lowest High (LH) of the previous x bars. 5. The Lowest Low (LL) of the previous x bars. How does Bermaui Channels Captures Overbought  area Think of the distance between HH and HL levels as an overbought area. When the price candles or bars crosses the HL to the upside this
                      この指標のアイデアは、RSIをろうそくの形で描画し、それを価格チャートと比較して売買シグナルを生成することです。指標は私の発明ではありません。私は数年前にインターネット上でそれを設立しました。コードを更新し、アラート機能を追加し、BermauiUtilitiesグループのツールを追加しました。 インディケータはローソク足を引くために使用されるすべての価格のRSIを計算します(始値、高値、安値、終値のRSI)。それらの最も高いものを使用してRSIキャンドルの高い芯を描画し、最も低いものを使用してRSIキャンドルの低い芯を描画します。 RSIキャンドルのボディは高値と安値の間にあります。オープンのRSIがクローズのRSIよりも低い場合、RSIキャンドルは強気と見なされます。オープンのRSIがクローズのRSIよりも高い場合、RSIキャンドルは弱気と見なされます。 どうやって使うのですか RSIキャンドルインジケーターでトレンドラインブレイクアウトをトレードすることができます。これは、勢いが価格をリードするため、価格チャートのトレンドをリードします。 RSIキャンドルインジケーターに任意
                      Horus EA
                      Muhammad Elbermawi
                      3.67 (3)
                      MT4用のHorusEA 数千年前、古代エジプト人は、自分たちの土地を測定し、商品を計量するために使用するカウントシステムを発明しました。 このシステムは「ホルスの目 」として知られていました。 ホルスの目はオシリス神の神話と関連付けられており、ファラオの神聖なシンボルの1つになりました。 私は、フィボナッチ数列を使用したEye of Horusの数式を使用して、有名な「マルチンゲールシステム」よりも89%安全なネガティブプログレッションマネー管理システムを構築しました。 EAの技術的な部分は、 移動平均クラウド(MAC) と ストキャスティクスに 依存しています。 MACストキャスティクステクニカル分析システムはどのように機能しますか? 1-移動平均クラウド(MAC)が強気の場合、ストキャスティクスが売られ過ぎのレベルを下から横切ると、EAは買い注文を受け取ります。 2-移動平均クラウド(MAC)が弱気の場合、ストキャスティクスが買われ過ぎのレベルを上から横切ると、EAは売り注文を受け取ります。 EAの重要な機能 1-セットごとに1つの取引。 2-明確なス
                      フィルタ:
                      jmhuang
                      3067
                      jmhuang 2024.04.10 23:34 
                       

                      THE SELLER IS ASKING FOR A POSITIVE REVIEW IN EXCHANGE FOR FREE INDICATOR. THERE ARE MANY FAKE REVIEWS. THE TDO TRUE DIRECTION OSCILLATOR IS LAGGARD INDICATOR AND PRODUCES ONE TO TWO SIGNALS A DAY. EVEN THE SIGNALS ARE VERY OFTEN WRONG.DON'T BE MISLED BY THE REVIEWS. BUYER BEWARE. YOUR MONEY WILL BE WASTED

                      Muhammad Elbermawi
                      52233
                      開発者からの返信 Muhammad Elbermawi 2024.04.10 23:44
                      There are 28 majors in Forex ... Two signals on each chart equals 56 opportunities each day ... and you say that is not enough! ... I smell greed here
                      ovno27
                      109
                      ovno27 2024.04.07 09:07 
                       

                      The direction is really true!!!

                      pornchai_p
                      340
                      pornchai_p 2023.06.08 18:37 
                       

                      This is excellent indicator, highly recommended. Now I have Bermaui bands, Bermaui RSI Candles and TDO.

                      Shimaa Kamal
                      42
                      Shimaa Kamal 2023.05.26 23:14 
                       

                      This is a great indicator ... Thank you very much

                      gigoro
                      54
                      gigoro 2023.03.21 10:34 
                       

                      the idea of the indicator is good and it contains services that really save a lot of effort& time

                      Solomon Ola
                      212
                      Solomon Ola 2023.03.17 19:20 
                       

                      best indicatot i have ever see i give hit 5ster

                      passyjh
                      272
                      passyjh 2023.02.28 11:43 
                       

                      I think this is good indicator.

                      mostafa gamal
                      43
                      mostafa gamal 2023.02.14 02:15 
                       

                      I DID NOT FIND BAHIROMI STOCHASTIC

                      wuzzy66
                      886
                      wuzzy66 2023.01.13 21:24 
                       

                      BRILLIANT INDICATOR BRILLIANT CONCEPT VERY POWERFUL INDICATOR I WOULD SAY THIS IS MY BEST INDICATOR FOR THREE YEAR JUST FOLLOWING SIMPLE INSTRUCTIONS AND READY TO START MAKING GOOD PIPS STRAIGHT FORWARD TO USE A MONEY BACK GUARANTEE IF I HAD MY WAYTO SAY THAT THIS SIS AN EXCELLENT INDICATOR THE MINUTE ALL ALIGNS EITHER A BLUE OR RED YOU ARE GOOD TO GO I GIVE IT A TEN STAR RATING KEEP UP THE GOOD WORK YOU CAN RENT JUST FOR $10 FOR A MONTH AND YOU WONT BE DISAPPOINTED

                      Muhammad Elbermawi
                      52233
                      開発者からの返信 Muhammad Elbermawi 2023.01.14 02:33
                      Wow, that is an awesome review ... Happy 2023 🙏
                      davevicens
                      321
                      davevicens 2022.12.30 11:43 
                       

                      First operation and first benefit. I love this indicator!!! Happy New Year

                      Muhammad Elbermawi
                      52233
                      開発者からの返信 Muhammad Elbermawi 2022.12.30 13:42
                      Happy new year to you too my friend 🌲 🙏
                      NN
                      652
                      NN 2022.08.25 14:37 
                       

                      Useless! It is lagging and does not help!

                      Jedidiah Benedict
                      90
                      Jedidiah Benedict 2022.08.05 18:31 
                       

                      I really like this indicator.

                      Walid Nazmi
                      106
                      Walid Nazmi 2022.06.22 15:20 
                       

                      Trust me (TDO) is all what you need! Key Advantages : 1) Indicator doesn't flash false signals during a spike or sudden price move. 2) 100% you can rely on the indicator 3) Result from the back test and in real-time is a perfect match. I'm certainly glad i came across the author Mr. Muhammad Elbermawi

                      Muhammad Elbermawi
                      52233
                      開発者からの返信 Muhammad Elbermawi 2022.06.22 15:25
                      Thanks a lot for the great review, Walid 🙏
                      Hamid Niazmand
                      45
                      Hamid Niazmand 2022.06.14 05:37 
                       

                      useless! I don't understand why all the reviews are 5 star while the indicator is just regular ok indicator. 15 min ago in 4 hours chart usd/jpy showing sell signal and I went according to that and 5 min later after I went short the sell signal disappeared I understand trade is based on probabilities but when signal disappeared that is questionable. so do not get fooled by pervious signal it can change easily. if you don't believe it then rent it for month !!!

                      Muhammad Elbermawi
                      52233
                      開発者からの返信 Muhammad Elbermawi 2022.06.14 07:51
                      I can see that you didn't read the manual and so, you don't understand the idea of the indicator.
                      My indicators don't repaint themself as you claim. Thousands of customers tried them without any problems.
                      As I mentioned in the description the "TDO arrows do not repaint or recalculate their results."
                      atarek1978
                      64
                      atarek1978 2022.06.11 22:55 
                       

                      these fake reviews encourage us to buy such a bad indicator If it is a winning tool than the author will not sell it with 60 dollars

                      Muhammad Elbermawi
                      52233
                      開発者からの返信 Muhammad Elbermawi 2022.06.12 12:29
                      I can't figure out what bothers you so much about the True Direction Oscillator reviews.
                      All people here have the freedom to change their reviews whenever they want.
                      I do my best to serve my customers and give them the best value for each dollar they pay.
                      rodbizness
                      84
                      rodbizness 2022.06.11 01:16 
                       

                      Sincerely, Very Awsome indicator. Thank you so much Muhammad.

                      Fann29
                      304
                      Fann29 2022.05.19 08:29 
                       

                      This TDO is not only one indicator, there is plus 4!! very worth it for the price! Thank you!

                      Childerich
                      1274
                      Childerich 2022.04.29 13:42 
                       

                      just bought the indicator, looks good and promising. thank you.

                      tMolokeng
                      79
                      tMolokeng 2022.04.25 16:23 
                       

                      Hi Mr. Muhammad. I read many positive reviews about your TDO product from other traders. Therefore, I decided to rent your TDO for one year. May I please get a copy so that, I can start trading profitably. Thank you.

                      kotero1990
                      430
                      kotero1990 2022.04.23 21:30 
                       

                      Excellent overall Indicator. Any chance of this indicator becoming a EA ? That would be amazing!

                      レビューに返信
                      バージョン 9.2 2020.05.22
                      In TDO version 9.2 I have enhanced the alert and notifications to work better with the MT4 system tester
                      .
                      Note:
                      I didn't make any changes to TDO's basic formula. It is still the same.
                      I didn't make any changes in indicator parameters or buffers.
                      バージョン 9.1 2020.02.23
                      Fixed a small bug in the de-initialization function, that used to cause the symbols switch tool not to work properly.
                      .
                      Note:
                      I didn't make any changes on TDO basic formula. It is still the same.
                      I didn't make any changes in indicator parameters or buffers.
                      バージョン 9.0 2019.12.28
                      1. Enhanced TDO code to be much more faster.
                      2. Decreased indicator buffers from ten to six.
                      3. Deleted Max Candles to Draw parameter, so , the indicator appear on all the chart.
                      4. Added a background to the Martingale Panel.
                      5. Added the option to show channels as shaded area or as lines.
                      6. Enhanced the messages code.
                      7. Enhanced the colors list.

                      Note:
                      I didn't make any changes on TDO basic formula. It is still the same. Changes are for objects and indicator functions like (loops, ifs, for...etc).
                      バージョン 8.0 2019.10.16
                      What is new in TDO user to version 8.0:

                      1- You can show or hide TDO Panel and Buttons by clicking on Shift + A / D.
                      2- You can switch between four beautiful and well-designed Color Lists. Or you can use your own color list by choosing the (Do Nothing) choice.
                      3- You can send Mobile Notification or emails and if anything gets wrong you will receive a note in the terminal's journal.
                      4- Indicator objects now change their size automatically by depending on screen resolution.
                      5- Made inputs much more user friendly.
                      6- Made a revision to the code to make sure that there are no bugs.
                      バージョン 7.1 2019.07.18
                      You can now increase/decrease all buttons font size. This new feature is good for:

                      1. Those who use brokers with nonstandard symbols list. (ex: EURUSDecn, GBPUSDecn,...etc).

                      2. Those who want to enlarge their screen resolution through the windows (Customize Sizing Options).

                      I am now releasing version 7.1 and this project have been around MQL5 since 2015. I hope you can find it profitable for you as it was for me.
                      バージョン 7.0 2019.06.16
                      1. Enhanced TDO calculation method for a better use with iCustom() to build EAs and indicators depending on TDO.
                      2. Organized TDO parameters in a better style.
                      3. Opened the limits for (First TDO Period [Min =1]) parameters. This reduced the number of warning messages for wrong inputs in the previous version.
                      4. Changed the Channels period to 1000. This make TDO channels a very good trend filter.
                      バージョン 5.0 2018.10.09
                      1. Enhanced TDO calculation method.
                      2. Organized TDO parameters in a better style.
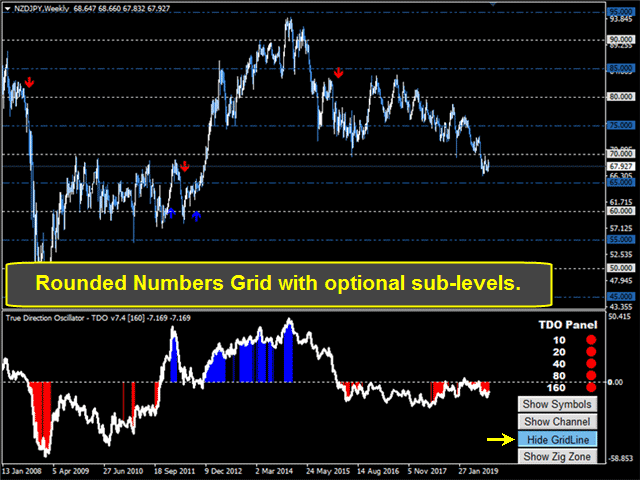
                      3. Enhanced the Round Number Grid calculation method.
                      4. Added sub levels to the Round Number Grid.
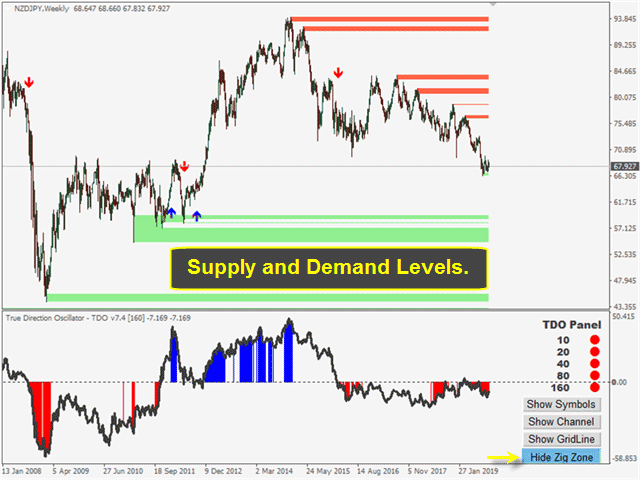
                      5. Added what I call Zig Zone Levels to easily capture support & resistance.
                      バージョン 4.0 2018.07.23
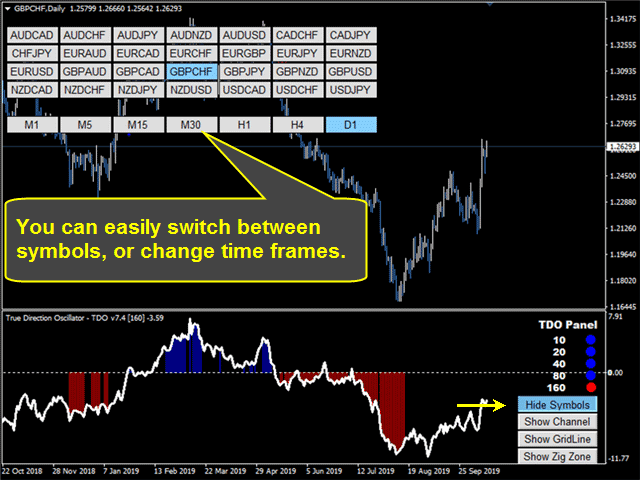
                      1.1。 ユーザーが異なるチャート間を簡単に切り替えるための「シンボルスイッチパネル」を追加しました。
                      1.2。 「シンボルスイッチパネル」はユーザー入力またはマーケットウォッチウィンドウからの入力が可能です。
                      1.3。 "シンボルスイッチパネル"は、現在のウィンドウのチャートを変更したり、新しいウィンドウでそれを開くことができます。
                      1.4。 ユーザーは "シンボルスイッチパネル"を使用して現在のチャートの時間枠を変更できます。
                      1.5。 ユーザーは "シンボルスイッチパネル"上のボタンの数を制御します。 メインチャートまたはTDOウィンドウに表示させることができます。
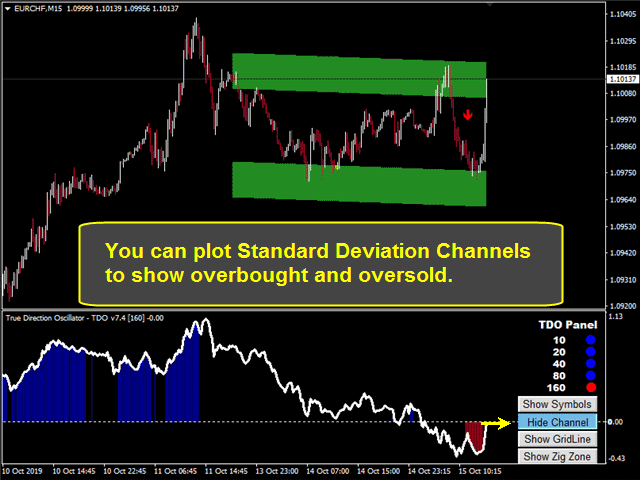
                      -------------------------------------------------- -------
                      2.1「価格チャネル」を追加しました。
                      2.2ユーザーは「標準偏差」または「線形回帰」のいずれかを選択できます。
                      2.3ユーザーはチャンネルをレイとして描画したり、バックグラウンドにすることができます。
                      -------------------------------------------------- -------
                      3.1「価格グリッド」を追加しました。
                      3.2ユーザは「自動グリッド」と「カスタマグリッド」のどちらかを選択できます。
                      3.3ユーザーはグリッドレベル間の距離を増やすことができます。
                      バージョン 3.1 2018.04.27
                      1. Made a revision to the code to make sure that there are no bugs.
                      2. Made inputs much more user friendly.
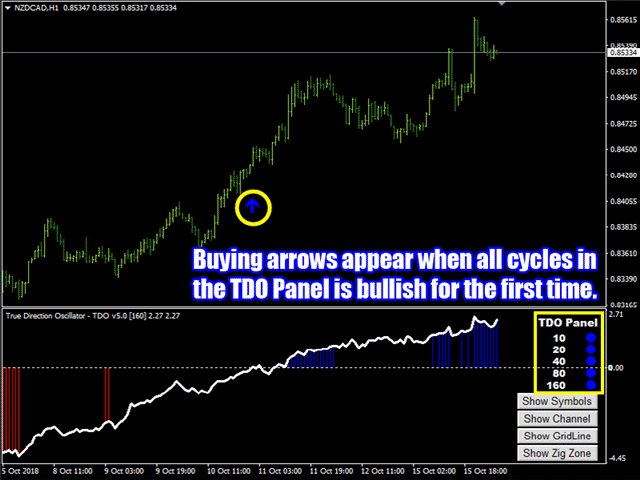
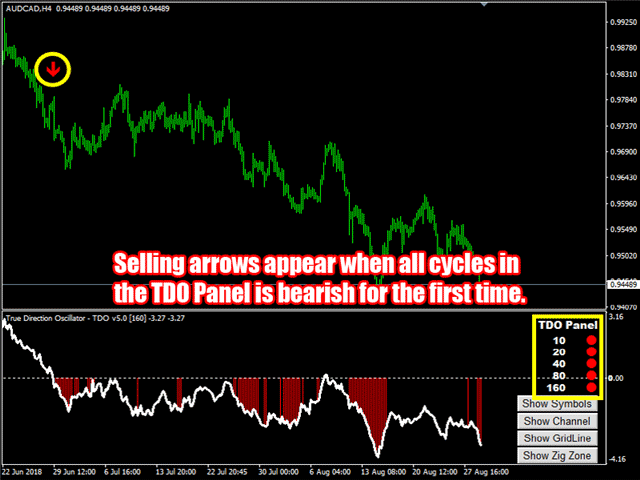
                      3. Added arrow signals to follow the trend.
                      4. Added a multi time period panel.
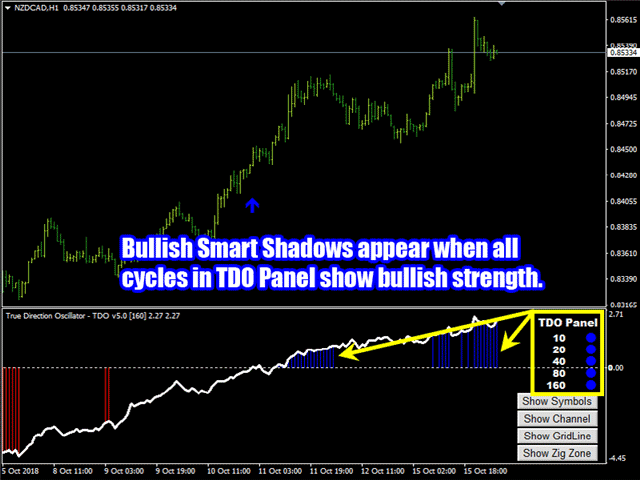
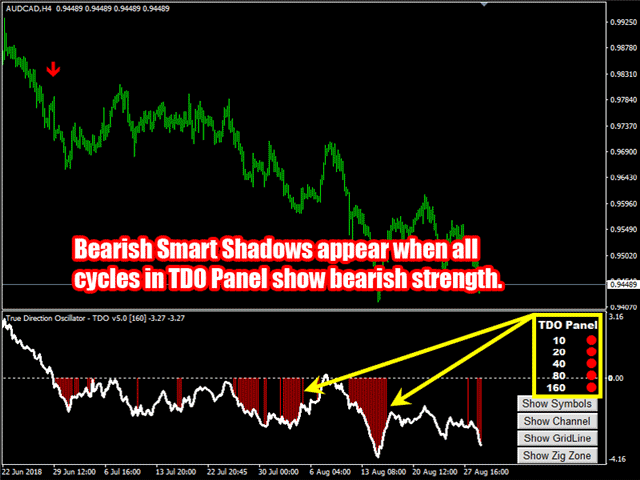
                      5. Made shadow with color when trend is strong.
                      6. Added alerts when a new arrow appear.
                      7. Added alerts when multi time period panel is in-line.
                      バージョン 1.4 2016.01.04
                      In this version I tested the code and fixed all possible logical errors. The code now is more clear than before.