Times and Sales Pro

Times and Sales Pro: 取引フローの不均衡であなたの取引を強化 📊🚀

🔎 小さな価格変動のチャンス
Times and Sales Pro は、Times and Trades に基づいて注文フローを操作するアナリストにとって欠かせないツールです。スキャルパーに最適で、高精度で小さな価格変動を活用したい方のために設計されています。高度な計算を使用して、このインジケーターは取引の不均衡を特定し、迅速なエントリーとエグジットのための貴重なシグナルを提供します。

💡 重要: MT5でのTimes and Tradesの可用性
Times and Sales Proを使用する前に、ブローカーがMT5でTimes and Tradesへのアクセスを提供していることを確認してください。このインジケーターは、正確なリアルタイム計算を生成するためにこのデータに依存しており、MT5は取引履歴を保存しません。したがって、このインジケーターはリアルタイムでのみ機能し、市場で実行された取引の即時の洞察を提供します。

🚀 Times and Sales Proの利点
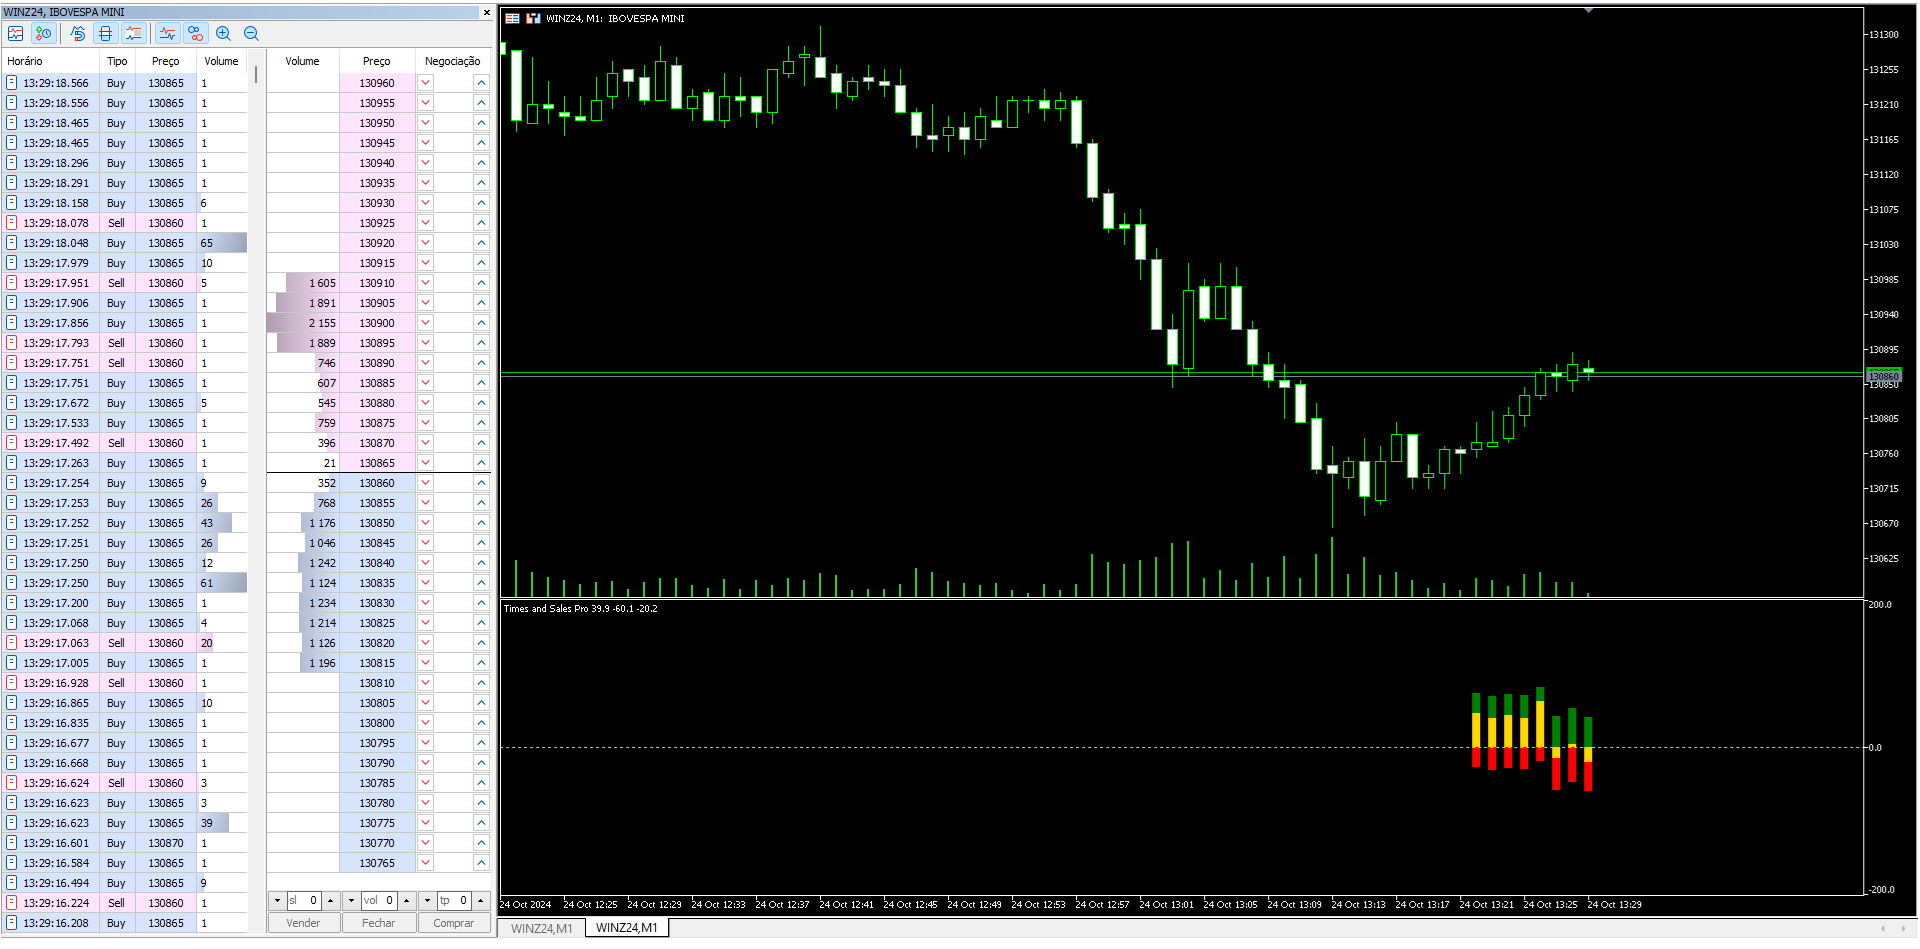
  1. 明確な色での高度な取引フロー分析
    Times and Sales Pro は、特定のカラーコードを使用して取引の不均衡を視覚化するのを簡素化します:

    • 緑: 購入注文を示します。
    • 赤: 売却注文を示します。
    • 金色: 購入注文と売却注文の不均衡を示します。

これらの色により、取引フローを迅速かつ明確に読み取ることができ、特に短期の取引(スキャルピング)に最適です。

  1. リアルタイムの売買シグナル
    チャート上で明確で迅速なシグナルを取得でき、取引フローの変化に迅速に反応できます。

  2. 取引フローのトレーダーに最適
    実行された注文のフローに基づいて取引を行う場合、これは効率を最大化するための完璧なインジケーターです。購入注文と売却注文の不均衡について明確な視点を提供し、精度の高い意思決定をサポートします。

  3. 強力なエキスパートアドバイザー(EA)の作成に対応
    Times and Sales Pro は、EA(エキスパートアドバイザー)との統合のためにバッファを提供します。バッファを設定して、強力なエキスパートを構築できます:

    • バッファ 0: 購入シグナル
    • バッファ 1: 売却シグナル
    • バッファ 2: 不均衡(金色)

これらの機能により、取引フローの不均衡に基づく戦略を自動化し、取引を最適化できます。

  1. 使いやすさと設定の容易さ
    直感的なインターフェースと正確な取引フロー分析を備えたTimes and Sales Pro は、複雑さなしにリアルタイムの詳細な分析を提供し、取引を簡素化します。

おすすめのプロダクト
The indicator highlights the points that a professional trader sees in ordinary indicators. VisualVol visually displays different volatility indicators on a single scale and a common align. Highlights the excess of volume indicators in color. At the same time, Tick and Real Volume, Actual range, ATR, candle size and return (open-close difference) can be displayed. Thanks to VisualVol, you will see the market periods and the right time for different trading operations. This version is intended f
FREE
Value Chart Candlesticks
Flavio Javier Jarabeck
4.69 (13)
The idea of a Value Chart indicator was presented in the very good book I read back in 2020 , " Dynamic Trading Indicators: Winning with Value Charts and Price Action Profile ", from the authors Mark Helweg and David Stendahl. The idea is simple and the result is pure genius: Present candlestick Price analysis in a detrended way! HOW TO READ THIS INDICATOR Look for Overbought and Oversold levels. Of course, you will need to test the settings a lot to find the "correct" one for your approach. It
FREE
Weis Waves
Flavio Javier Jarabeck
2.83 (18)
The original author is David Weis, an expert in the Wyckoff Method. The Weis Wave is a modern adaptation of the 1930's Wyckoff Method, another expert in Tape Reading techniques and Chart Analysis. Weis Waves takes market volume and stacks it into waves according to price conditions giving the trader valuable insights about the market conditions. If you want to learn more about this subject you can find tons of videos in YouTube. Just look for "The Wickoff Method", "Weis Wave" and "Volume Spread
FREE
White Weis Volume This indicator shows the sum of the volume in each wave, bulish or bearish, as idealized by David Weis , but it brings an important addition , which is the marking of the bar with the highest volume of the wave (White Bar)! In coding the indicator, it was sought to optimize the code to require minimal processing during use and not to overload mt5. The indicator can be used for pre-trading analysis and study, where the trader analyzes possible points of support and resistance
Simple QM Pattern   is a powerful and intuitive trading indicator designed to simplify the identification of the Quasimodo (QM) trading pattern. The QM pattern is widely recognized among traders for effectively signaling potential   reversals   by highlighting key market structures and price action formations. This indicator helps traders easily visualize the QM pattern directly on their charts, making it straightforward even for those who are new to pattern trading. Simple QM Pattern includes d
FREE
Hunt markets with Hunttern ZigZag . Easy to use with one parameter    You can use it for the following:       -Classic patterns       -Heads and shoulders       -Harmonic patterns       -Elliott Wave       -Support and resistance       -Supply and Demand Single parameter:      -Period (1-120) Features:        -Candle time        -Single parameter        -Light mode template This is version 1 of Hunttern ZigZag. We are very happy to receive feedback from you.
FREE
概要 このインジケーターは、クラシックな ドンチャンチャネル を強化したバージョンで、実践的なトレード機能を追加しています。 標準の3本線(上限、下限、中央線)に加え、 ブレイクアウト を検出し、チャート上に矢印で視覚的に表示します。また、チャートを見やすくするために、 現在のトレンド方向と逆側のラインのみを表示 します。 インジケーターの機能: 視覚的シグナル :ブレイクアウト時にカラフルな矢印を表示 自動通知 :ポップアップ、プッシュ通知、Eメール RSIフィルター :市場の相対的な強弱に基づいてシグナルを検証 カスタマイズ可能 :色、ラインの太さ、矢印コード、RSI閾値など 動作原理 ドンチャンチャネルは次のように計算します: 上限線 :直近N本のクローズ済みローソク足の最高値 下限線 :直近N本のクローズ済みローソク足の最安値 中央線 :最高値と最安値の平均値 上方ブレイクアウト は終値が上限線を超えたときに発生し、 下方ブレイクアウト は終値が下限線を下回ったときに発生します。 インジケーターは以下を行います: 3本のドンチャンラインを描画 方向転換後の最初のブレイクアウト
FREE
High Low Open Close
Alexandre Borela
4.98 (42)
このプロジェクトが好きなら、5つ星レビューを残してください。 このインジケータは、指定されたためのオープン、ハイ、ロー、クローズ価格を描画します 特定のタイムゾーンの期間と調整が可能です。 これらは、多くの機関や専門家によって見られた重要なレベルです トレーダーは、彼らがより多くのかもしれない場所を知るために有用であり、 アクティブ。 利用可能な期間は次のとおりです。 前の日。 前週。 前の月。 前の四半期。 前年。 または: 現在の日。 現在の週。 現在の月。 現在の四半期。 現年。
FREE
Girassol Sunflower MT5 Indicator
Saullo De Oliveira Pacheco
4.33 (6)
This is the famous Sunflower indicator for Metatrader5. This indicator marks possible tops and bottoms on price charts. The indicator identifies tops and bottoms in the asset's price history, keep in mind that the current sunflower of the last candle repaints, as it is not possible to identify a top until the market reverses and it is also not possible to identify a bottom without the market stop falling and start rising. If you are looking for a professional programmer for Metatrader5, please
FREE
The Penta-O is a 6-point retracement harmonacci pattern which usually precedes big market movements. Penta-O patterns can expand and repaint quite a bit. To make things easier this indicator implements a twist: it waits for a donchian breakout in the right direction before signaling the trade. The end result is an otherwise repainting indicator with a very reliable trading signal. The donchian breakout period is entered as an input. [ Installation Guide | Update Guide | Troubleshooting | FAQ | A
FREE
OmniSignal Navigator – Smart Entries at Key Levels Trade Like a Professional  with this daily/weekly High-Low-Close indicator, designed for   scalping or intraday short term trading   and precision breakout trading. Suggested Timeframes to trade with: M5 |  DONT USE THE INDICATOR ON THE M1 TIMEFRAME!!! Why It Works   Perfect for Scalping/Intraday:   Targets key zones ( PDH/PDL/PDC & PWH/PWL/PWC ) on   M2, M3, M5, M15   timeframes. (Lower Timeframes = More Signals, Higher Timeframes = Le
FREE
Donchian Channel is an indicator created by Richard Donchian. It is formed by taking the highest high and the lowest low of the last specified period in candles. The area between high and low is the channel for the chosen period. Its configuration is simple. It is possible to have the average between the upper and lower lines, plus you have alerts when price hits one side. If you have any questions or find any bugs, please contact me. Enjoy!
FREE
Follow The Line MT5
Oliver Gideon Amofa Appiah
4.55 (31)
This indicator obeys the popular maxim that: "THE TREND IS YOUR FRIEND" It paints a GREEN line for BUY and also paints a RED line for SELL. (you can change the colors). It gives alarms and alerts of all kinds. IT DOES NOT REPAINT and can be used for all currency pairs and timeframes. Yes, as easy and simple as that. Even a newbie can use it to make great and reliable trades. NB: For best results, get my other premium indicators for more powerful and reliable signals. Get them here: https://www.m
FREE
Note from Developer: This is the lite version of the Double TMA with Bands Indicator. You can find the paid version that comes with alerts and on screen signal arrows built in here . I will also be selling an EA based on this trading system soon once all backtesting and optimization have been completed. Unlock your trading potential with the Double TMA Indicator with Reversal Detection! Designed for swing and reversal trading, this versatile tool integrates two Triangular Moving Averages (
FREE
Free automatic Fibonacci is an indicator that automatically plots a Fibonacci retracement based on the number of bars you select on the BarsToScan setting in the indicator. The Fibonacci is automatically updated in real time as new highest and lowest values appears amongst the selected bars. You can select which level values to be displayed in the indicator settings. You can also select the color of the levels thus enabling the trader to be able to attach the indicator several times with differe
FREE
Gap Detector Pro
Andres Felipe Carvajal Rodriguez
GapDetector Pro は、 価格の窓(ギャップ) の3つのレベルをリアルタイムで識別します。 青い点 (Punto azul): 早期警戒 、ギャップ形成の可能性を予測します。 黄色い点 (Punto amarillo): 低ボリューム と 広いスプレッド の状況で、ギャップの可能性が高いことを示します。 白い点 (Punto blanco): ローソク足間に既に形成された 実際のギャップ を確認します。 パラメータの調整 ユーザーは必要に応じてパラメータを調整できます。 VolumeDropRatio(出来高減少率): 低い値 は 感度 を高め、より多くのシグナルを生成します。 高い値 は、より強い出来高の減少を要求し、シグナルを減らします。 MaxSpread(最大スプレッド): 低い値 はより 厳格 で、スプレッドの小さいギャップのみを受け入れます。 高い値 は、スプレッドが広くてもギャップを認識することを可能にします。 GapThresholdPips(ギャップのピップスしきい値): 低い値 は小さなギャップを検出します。 高い値 は大きなブレイクのみを確認します。
FREE
MIDAS Super VWAP
Flavio Javier Jarabeck
4.4 (10)
Imagine VWAP, MVWAP and MIDAS in one place... Well, you found it! Now you can track the movement of Big Players in various ways, as they in general pursue the benchmarks related to this measuring, gauging if they had good execution or poor execution on their orders. Traders and analysts use the VWAP to eliminate the noise that occurs throughout the day, so they can measure what prices buyers and sellers are really trading. VWAP gives traders insight into how a stock trades for that day and deter
FREE
Donchian Pro
Paulo Henrique Faquineli Garcia
5 (3)
The Donchian Channel Channels are among the most popular tools of technical analysis, as they visually convey to the analyst the limits within which most price movement tends to occur. Channel users know that valuable information can be obtained at any time, whether prices are in the central region of a band or close to one of the border lines. One of the best known techniques to explore these concepts is Bollinger Bands. However, John Bollinger was not the only one to research the application
FREE
MACD Enhanced
Nikita Berdnikov
5 (1)
Introducing the MACD  Enhanced – an advanced MACD (Moving Average Convergence Divergence) indicator that provides traders with extended capabilities for trend and momentum analysis in financial markets. The indicator uses the difference between the fast and slow exponential moving averages to determine momentum, direction, and strength of the trend, creating clear visual signals for potential entry and exit points. Attention! To achieve the best results, it is recommended to adapt the indicator
FREE
This is a buyer and seller aggression indicator that analyzes the shape of each candle and project this data in a histogram form. There are 4 histograms in one. On the front we have two: Upper - Buyer force. Lower - Seller force. At the background we also have two histogram, both with same color. They measure the combined strenght of buyers and sellers. This histograms can be turned off in Input Parameters. It is also possible to have the real or tick volume to help on this force measurement. IN
FREE
Combining the best of Price Action , Directional Movement , and Divergence/Convergence analysis, Candle Color Trend is a easy and reliable way to identify trend direction. The indicator automatically paints the candles according to the assumption that an uptrend is defined by prices that form a series of higher highs and higher lows. In contrast, a downtrend is defined by prices that form a series of lower highs and lower lows. Additionally, ADX Wilder indicator is used to measure trend weakness
FREE
FlatBreakout MT5 (Free Version) Flat Range Detector and Breakout Panel for MT5 — GBPUSD Only FlatBreakout MT5   is the free version of the professional FlatBreakoutPro MT5 indicator, specially designed for flat (range) detection and breakout signals on the   GBPUSD   pair only. Perfect for traders who want to experience the unique fractal logic of FlatBreakout MT5 and test breakout signals on a live market without limitations. Who Is This Product For? For traders who prefer to trade breakout of
FREE
Waves Sizer
Flavio Javier Jarabeck
3.86 (7)
Wyckoff fans, enjoy! Ideally to be used with the Weis Waves indicator, but it can be easily used alone, the Waves Sizer puts the range (in resulting Price movement) done by the Price on its market swings. You can control how accurate or loose will be the swings. This tool is very helpful for visually know how much the Price has traveled in your Timeframe. This way you can confront this level of effort with the resulting Volume, etc... Weis Waves indicator: https://www.mql5.com/en/market/produc
FREE
Are you tired of drawing trendlines every time you're analyzing charts? Or perhaps you would like more consistency in your technical analysis. Then this is for you. This indicator will draw trend lines automatically when dropped on a chart. How it works Works similar to standard deviation channel found on mt4 and mt5. It has 2 parameters: 1. Starting Bar 2. Number of bars for calculation The   starting bar   is the bar which drawing of the trend lines will begin, while the   number of bars for c
FREE
Simple Vwap with the daily, weekly and monthly VWAP is the abbreviation for   volume-weighted average price , which is a technical analysis tool that shows the ratio of an asset's price to its total trade volume. It provides traders and investors with a measure of the average price at which a stock is traded over a given period of time. How it's used Identify entry and exit points:   Traders can use VWAP to determine when to buy or sell an asset.   Understand price trends :  Traders can use V
FREE
ピボットポイントフィボRSJは、フィボナッチレートを使用してその日のサポートラインとレジスタンスラインを追跡するインジケーターです。 この壮大な指標は、フィボナッチレートを使用してピボットポイントを通じて最大7レベルのサポートとレジスタンスを作成します。 価格がこのサポートとレジスタンスの各レベルを尊重する方法は素晴らしいです。そこでは、オペレーションの可能な入口/出口ポイントを認識することができます。 特徴 最大7レベルのサポートと7レベルの抵抗 レベルの色を個別に設定します 入力 ピボットタイプ ピボットフィボRSJ1 =フィボ比1の計算 ピボットフィボRSJ2 =フィボ比2の計算 ピボットフィボRSJ3 =フィボ比3の計算 ピボットフィボクラシック=クラシックピボット計算 最小ピボットレベル ピボット3レベル ピボット4レベル ピボット5レベル ピボット6レベル ピボット7レベル それでも質問がある場合は、ダイレクトメッセージで私に連絡してください: https://www.mql5.com/ja/users/robsjunqueira/
FREE
Aggression Volume
Flavio Javier Jarabeck
4.29 (17)
Aggression Volume Indicator is the kind of indicator that is rarely found in the MQL5 community because it is not based on the standard Volume data provided by the Metatrader 5 platform. It requires the scrutiny of all traffic Ticks requested on the platform... That said, Aggression Volume indicator requests all Tick Data from your Broker and processes it to build a very special version of a Volume Indicator, where Buyers and Sellers aggressions are plotted in a form of Histogram. Additionally,
FREE
Weis Wave Double Side
Eduardo Da Costa Custodio Santos
The Weis Wave Bouble Side Indicator for MT5 is part of the toolkit (Wyckoff Academy Wave Market) The Weis Wave Bouble side Indicator for MT5 was created based on the already established Weis Wave created by David Weis. The Weis Wave Double Side indicator reads the market in waves as it was done by R. Wyckoff in 1900. It helps in the identification of effort x result, cause and effect, and Supply and demand Its differential is that it can be used below the zero axis, further improving plus operat
インディケータはチャート上にラウンドレベルを示します。 それらは、心理的、銀行的、または主要なプレーヤーレベルとも呼ばれます。 これらのレベルでは、強気と弱気の間に真の戦いがあり、多くの注文が蓄積され、ボラティリティの増加につながります。 インジケーターは、任意の楽器と時間枠に自動的に調整されます。 レベル80を突破してテストすると、購入します。レベル20を突破してテストすると、販売されます。ターゲットは00です。 注意。強力なサポートとレジスタンスレベルのため、価格は00レベルをわずかに下回る可能性があります。 入力パラメータ 。 Bars Count - 線の長さ 。 Show 00 Levels - 00レベルを表示するかしないか 。 Show 10, 90 Levels 。 Show 20, 80 Levels 。 Show 30, 70 Levels 。 Show 40, 60 Levels 。 Show 50 Levels 。 N Lines - チャートのレベル数を制限するパラメーター 。 Distance 00 Levels - レベル間の距離(自動または手動)
FREE
Bollinger Bands B
Flavio Javier Jarabeck
4.25 (4)
John Bollinger created this indicator in 2010 as a way to read the original indicator (Bollinger Bands) in a more "technical" way, shown as an oscillator. The typical range of the Bollinger Bands %B is 0 - 0.5 - 1.0, where "0" represents the lower band, the "0.5" the middle band, and "1" the upper band. The line on the indicator represents the Closing prices. As simple as that. SETTINGS Bollinger Bands period of analysis Standard Deviation multiplier Shift Price type to be analyzed If you like
FREE
このプロダクトを購入した人は以下も購入しています
まず第一に、この取引ツールはノンリペイント、ノンリドロー、ノンラグの指標であり、プロの取引に理想的ですことを強調する価値があります。 オンラインコース、ユーザーマニュアル、デモ。 スマートプライスアクションコンセプトインジケーターは、新米から経験豊富なトレーダーまで、非常 に強力なツールです。Inner Circle Trader AnalysisやSmart Money Concepts Trading Strategiesなど、20以上の有用な指標を1つに組み合わせています。このインジケーターはスマートマネーコンセプトに焦点を当て、大手機関の取引方法を提供し、彼らの動きを予測するのに役立ちます。 特に、流動性分析に優れており、機関がどのように取引しているかを理解しやすくしています。市場のトレンドを予測し、価格の動きを慎重に分析するのに優れています。機関の戦略とトレードを合わせることで、市場の動向についてより正確な予測ができます。このインジケーターは多目的であり、市場構造を分析し、重要な注文ブロックを特定し、さまざまなパターンを認識するのに優れています。 このインジケーター
AriX
Temirlan Kdyrkhan
1 (4)
AriX Indicator for MT5 A powerful trend-following and signal-evaluation tool AriX is a custom MT5 indicator that combines Moving Averages and ATR-based risk/reward logic to generate clear buy/sell signals. It visualizes dynamic SL/TP levels, evaluates past trade outcomes, and displays win/loss statistics in a clean on-chart panel. Key features include: Buy/Sell signals based on MA crossovers ATR-based SL/TP1/TP2/TP3 levels with visual lines and labels Signal outcome tracking with real-time stat
ARICoin is a powerful trading companion designed to generate high-probability entry signals with dynamic TP/SL/DP levels based on volatility. Built-in performance tracking shows win/loss stats, PP1/PP2 hits, and success rates all updated live. Key Features: Buy/Sell signals with adaptive volatility bands Real-time TP/SL/DP levels based on ATR Built-in MA Filter with optional ATR/StdDev volatility Performance stats panel (Success, Profit/Loss, PP1/PP2) Alerts via popup, sound, push, or email Cust
ARIScalp is a powerful trading companion designed to generate high-probability entry signals with dynamic TP/SL/DP levels based on volatility. Built-in performance tracking shows win/loss stats, PP1/PP2 hits, and success rates all updated live. Key Features: Buy/Sell signals with adaptive volatility bands Real-time TP/SL/DP levels based on ATR Built-in MA Filter with optional ATR/StdDev volatility Performance stats panel (Success, Profit/Loss, PP1/PP2) Alerts via popup, sound, push, or email Cus
これまでに、 素晴らしいバックテスト結果、 驚くべき数値を持つ ライブ口座のパフォーマンス証明 、そして あらゆる場所での統計情報 がある取引インジケーターを購入し、しかし使用後に 口座を破綻させてしまった ことは何度ありますか? シグナル単独を信用すべきではありません。そもそもなぜそれが表示されたのかを知る必要があります。そして、それこそがRelicusRoad Proの得意とすることです! ユーザーマニュアル + 戦略 + トレーニングビデオ + VIPアクセス付きプライベートグループ + モバイル版利用可能 市場の見方を変える新しい方法 RelicusRoadは、FX、先物、仮想通貨、株式、指数に対応する、 世界で最も強力で最高の取引インジケーター であり、トレーダーが口座を 成長させる ために必要なすべての情報とツールを提供します。 初心者 から 上級者 まで、 すべてのトレーダー が成功できるよう、 テクニカル分析 と 取引計画 を提供します。 これは、将来の市場を 予測する のに十分な情報を提供する 主要な取引インジケーター です。私たちは、チャート上で意味をなさない複
Step into the world of Forex trading with confidence, clarity, and precision using Gold Indicator a next-generation tool engineered to take your trading performance to the next level. Whether you’re a seasoned professional or just beginning your journey in the currency markets, Gold Indicator equips you with powerful insights and help you trade smarter, not harder. Built on the proven synergy of three advanced indicators, Gold Indicator focuses exclusively on medium and long-term trends elimina
説明 ICSM(Impulse-Correction SCOB Mapper)は、価格の動きを分析し、有効なインパルス、修正、およびSCOB(Single Candle Order Block)を識別するインジケーターです。柔軟性があり、情報量が多く、使いやすく、最も流動性の高い関心領域に対するトレーダーの認識を大幅に向上させるため、あらゆるタイプのテクニカル分析で使用できる強力なツールです。 設定 一般 | ビジュアル カラーテーマ — ICSMのカラーテーマを定義します。 SCOB | ビジュアル SCOBを表示 — SCOBを有効/無効にします; SCOBをマークする — SCOB表現のスタイルオプションのリストを表します; SCOB色 — SCOBの色を定義します; ICM | ビジュアル ICMラインを表示 — ICM(Impulse-Correction Mapper)ラインを有効/無効にします; ICトレンドを表示 — チャートの下部にある色付きの仕切りを通じてインパルス-修正トレンドの視覚化を有効/無効にします; ライン色 — ICMラインの色
無料のAUXインジケーター、EAサポート、完全ガイドをご利用ください – https://www.mql5.com/en/blogs/post/763955 トレンドを見極める。パターンを読む。エントリーのタイミングを掴む。 30秒以内の3ステップ!分析不要で簡単トレード — あなたのスマートアシスタントがワークフローを簡素化します チャートの過剰な情報にもう悩まされない。 スマートバイアス検出で自信を持ってトレード。 すべての通貨、暗号資産、株式、金属、指数、あらゆる時間足に対応。 クリックして実行するだけ — それだけで十分。 スピードと明快さを求める忙しいトレーダーに最適。 TPTSyncXは、 トレンド、パターン、 ローソク足のトリガー 分析を、洗練されたインテリジェントなビジュアルシステムとしてシームレスに統合する、強力なオールインワンMetaTrader 5インジケーターです。明確さ、正確さ、スピードを求めるトレーダー向けに設計されており、プライスアクション、構造的パターン、市場タイミングツールを組み合わせて、高確率のトレードセットアップを特定するのに役立ちます。 主な
+++++++++++++++++++++++++++++++++++++++++++++++++++++++++++++++++++++++++++++++++++++++++++++++++ +++ Link to EURUSD Only Free Version -->  https://www.mql5.com/en/market/product/156904?source=Unknown +++++++++++++++++++++++++++++++++++++++++++++++++++++++++++++++++++++++++++++++++++++++++++++++++ Hallo Trader, This is a traditional GANN & FIBONACCI strategy based on detection of an impulsive move in the opposite direction. This is called a Breakout. At the moment of Breakout, the indicator draw
FRONTIER PIVOTS - Geometric Levels Indicator This indicator plots support and resistance levels/ranges on the chart using mathematical calculations. It helps traders identify potential price reaction zones based on geometric patterns. Main Features: Automatically calculates and displays key price levels Plots both support and resistance lines Uses daily price data for level calculation Clean visual presentation with different colors for different level types No repainting - levels remain static
This indicator uses support and resistance, volume and some special formula to calculate the volume to filter the candles. If the volume reaches a specific value, And at the same time, Candle breaks the support/resistance line, There would be a signal and we can enter the market. Signals appear when the current candle closes. then you can enter the trade when a new candle appears. Please don't forget to follow your money management plan. MT4 Version Support/Resistance Breakout MT4 :   https:/
The iChannels
BeeXXI Corporation
5 (2)
Ultra-fast recognition of parabolic channels (as well as linear, horizontal and wavy channels) throughout the depth of history, creating a hierarchy of channels. Required setting: Max bars in chart: Unlimited This indicator is designed primarily for algorithmic trading, but can also be used for manual trading.  This indicator will have a very active evolution in the near future and detailed descriptions on how to apply to create robots
[ MT4 Version ]  [ Kill Zones ]  [ SMT Divergences ] How to trade using Order Blocks:  Click here User Interface Performance:  During testing in the strategy tester, the UI may experience lag. Rest assured, this issue is specific to the testing environment and does not affect the indicator's performance in live trading. Elevate your trading strategy with the  Order Blocks ICT Multi TF  indicator, a cutting-edge tool designed to enhance your trading decisions through advanced order block analysis
MetaForecast M5
Vahidreza Heidar Gholami
5 (3)
MetaForecastは、価格データのハーモニクスに基づいて、どんな市場の未来を予測し視覚化します。市場が常に予測可能ではありませんが、価格にパターンがある場合、MetaForecastは可能な限り正確な未来を予測できます。他の類似製品と比較して、MetaForecastは市場のトレンドを分析することでより正確な結果を生成することができます。 入力パラメータ Past size (過去のサイズ) MetaForecastが将来の予測を生成するために使用するバーの数を指定します。モデルは選択したバー上に描かれた黄色の線で表されます。 Future size (将来のサイズ) 予測すべき将来のバーの数を指定します。予測された将来は、ピンクの線で表示され、その上に青い回帰線が描かれます。 Degree (程度) この入力は、MetaForecastが市場で行う分析のレベルを決定します。 Degree 説明  0 Degree 0の場合、価格の全てのピークや谷、そして詳細をカバーするために、「Past size」の入力に大きな値を使用することが推奨されています。  1 (推奨) Degre
100PIPSsignals — 金(M1)向け高速EMAクロスオーバーシステム 1分足チャート上の金CFD向けに設計された軽量EMAクロスオーバーインジケーターです。低リスクのエントリーポイントを明確な矢印と金色の円でマークし、設定可能な最小pipターゲットで動きを検証し、アラート/通知を送信できます。 仕組み(シンプル) このインジケーターは、2つの指数移動平均線(高速EMAと中期EMA)を使用します。 高速EMAが中期EMAを上抜けると買いシグナルの矢印が表示され、下抜けると売りシグナルの矢印が表示されます。 次のバーの始値に金色の円が表示され、実際の推奨エントリー価格を示します。 このインジケーターは、エントリー後の価格変動をチェックすることで各シグナルを検証します。有効期間中に設定可能な最小pipターゲットに到達しないシグナルは削除されます。検証された取引は、チャート上にpipゲインとともに注釈が付けられます。 XAU(金)CFDの1分足で使用し、取引を行う前により長い時間足でシグナルを確認してシグナルを確認してください。 主な機能 金(CFD/金属)向けに設計さ
Presenting one-of-a-kind Gann Indicator for XAUUSD IQ Gold Gann Levels is a non-repainting, precision tool designed exclusively for XAUUSD/Gold intraday trading. It uses W.D. Gann’s square root method to plot real-time support and resistance levels, helping traders spot high-probability entries with confidence and clarity. William Delbert Gann (W.D. Gann) was an exceptional market analyst whose trading technique was based on a complex blend of mathematics, geometry, astrology, and ancient calcul
IQ FX Gann Levels a precision trading indicator based on W.D. Gann’s square root methods. It plots real-time, non-repainting support and resistance levels to help traders confidently spot intraday and scalping opportunities with high accuracy. William Delbert Gann (W.D. Gann) was an exceptional market analyst, whose trading technique was based on a complex blend of mathematics, geometry, astrology, and ancient mathematics which proved to be extremely accurate. Download the   Metatrader 4 Version
note: this indicator is for METATRADER4, if you want the version for METATRADER5 this is the link:  https://www.mql5.com/it/market/product/108106 TRENDMAESTRO ver 2.5 TRENDMAESTRO recognizes a new TREND from the start, he never makes mistakes. The certainty of identifying a new TREND is priceless. DESCRIPTION TRENDMAESTRO identifies a new TREND in the bud, this indicator examines the volatility, volumes and momentum to identify the moment in which there is an explosion of one or more of these da
収益性の高い取引機会を簡単に特定するのに役立つ強力な外国為替取引インジケーターをお探しですか?ビースト スーパー シグナル以外に探す必要はありません。 この使いやすいトレンドベースのインジケーターは、市場の状況を継続的に監視し、新しいトレンドを検索したり、既存のトレンドに飛びついたりします。ビースト スーパー シグナルは、すべての内部戦略が一致し、互いに 100% 合流したときに売買シグナルを発するため、追加の確認は不要です。シグナル矢印アラートを受け取ったら、単に売買します。 購入後、プライベート VIP グループに追加されるようにメッセージを送ってください! (完全な製品購入のみ)。 購入後、最新の最適化されたセット ファイルについてメッセージを送ってください。 MT4版は こちらから。 Beast Super Signal EA は こちらから 入手できます。 コメント セクションをチェックして、最新の結果を確認してください。 ビースト スーパー シグナルは、1:1、1:2、または 1:3 のリスクと報酬の比率に基づいて、エントリー価格、ストップ ロス、テイク プ
Introduction Excessive Momentum Indicator is the momentum indicator to measure the excessive momentum directly from raw price series. Hence, this is an extended price action and pattern trading. Excessive Momentum Indicator was originally developed by Young Ho Seo. This indicator demonstrates the concept of Equilibrium Fractal Wave and Practical Application at the same time. Excessive Momentum detects the market anomaly. Excessive momentum will give us a lot of clue about potential reversal and
First time on MetaTrader, introducing IQ Star Lines - an original Vedic Astrology based indicator. IQ Star Lines, an unique astrological indicator purely based on Vedic astrology calculations, published for the first time on Metatrader. This unique tool plots dynamic planetary grid lines based on real-time stars, constellations, and celestial movements, which allows you to plot the power of the cosmos directly onto your trading charts. This indicator is specifically designed for scalpers and int
「 Dynamic Scalper System MT5 」インジケーターは、トレンド波の中でスキャルピング取引を行う手法のために設計されています。 主要通貨ペアと金でテスト済みで、他の取引商品との互換性があります。 トレンドに沿った短期的なポジションオープンのシグナルを提供し、追加の価格変動サポートも提供します。 インジケーターの原理 大きな矢印はトレンドの方向を決定します。 トレンド波の中では、小さな矢印の形でスキャルピングシグナルを生成するアルゴリズムが機能します。 赤い矢印は強気方向、青い矢印は弱気方向です。 トレンドの方向には敏感な価格変動ラインが描かれ、小さな矢印のシグナルと連動します。 シグナルは次のように機能します。適切なタイミングでラインが現れるとエントリーシグナルが形成され、ラインが開いている間はポジションが保持され、完了すると取引が終了します。 推奨される動作時間枠はM1~H4です。 矢印は現在のローソク足に形成され、次のローソク足が開いている場合は、前のローソク足の矢印は再描画されません。 入力パラメータ Trend Wave Period - トレ
##   ONLY GOLD ##   Тiльки Золото ## **Mercaria Professional Trading Zones - Complete Guide** ## **Mercaria Professional Trading Zones - Повний посібник** ### **How Mercaria Zones Work / Як працюють зони Mercaria** **English:** Mercaria Zones is an advanced trading indicator that identifies high-probability support and resistance areas using ZigZag extremes combined with mathematical zone calculations. The indicator works on multiple timeframes simultaneously, providing a comprehensive view
無料の AUX インジケーターと EA サポ   直接ダウンロード — ここをクリック [ D.I.C.E ] The DICE Indicator Divergence in Chaos Environment は、エリオット波動理論とトレーディングカオス手法を組み合わせて使用するトレーダーのために設計された MT5 専用ツールです。価格変動の中の隠れたおよび通常のダイバージェンスを検出し、ビル・ウィリアムズが説明したカオス市場環境と同期します。 主な特徴 エリオット波動に対応したダイバージェンス検出:波動構造と調和した強気・弱気ダイバージェンスを識別。 カオス手法の統合:AO(オーサムオシレーター)と市場構造に整合。 マルチタイムフレームスキャン:異なる時間枠でダイバージェンスを分析し、トレンドの転換を確認。 視覚的アラートとオブジェクト:チャート上の矢印、ライン、マーカーで即座に識別。 市場適応読解:カオス的状況に自動適応し、ノイズを除去して有効なセットアップを維持。 ブレイクプルバックエントリー手法:シンプルなフィボナッチリトレースメントとピボットポイントを使用。 利点 ダイ
Introduction to X3 Chart Pattern Scanner X3 Cherart Pattern Scanner is the non-repainting and non-lagging indicator detecting X3 chart patterns including Harmonic pattern, Elliott Wave pattern, X3 patterns, and Japanese Candlestick patterns. Historical patterns match with signal patterns. Hence, you can readily develop the solid trading strategy in your chart. More importantly, this superb pattern scanner can detect the optimal pattern of its kind. In addition, you can switch on and off individu
This indicator identifies and displays zones, as it were areas of strength, where the price will unfold. The indicator can work on any chart, any instrument, at any timeframe. The indicator has two modes. The indicator is equipped with a control panel with buttons for convenience and split into two modes. Manual mode: To work with manual mode, you need to press the NEW button, a segment will appear. This segment is stretched over the movement and the LVL button is pressed. The level is displayed
Super Signal – Skyblade Edition プロ仕様のノンリペイント / ノーラグ・トレンドシグナルシステム。卓越した勝率を実現 | MT4 / MT5 対応 主な特徴: Super Signal – Skyblade Edition は、トレンド取引に特化したスマートなシグナルシステムです。マルチレイヤーのフィルターロジックを用いて、明確な方向性と実際のモメンタムに支えられた強力なトレンドのみを検出します。 このシステムは 天井や底を予測するものではありません 。次の3つの条件がすべて満たされた場合にのみシグナルを発生させます: 明確なトレンド方向 モメンタムの増加 健全なボラティリティ構造 市場セッションに基づく流動性分析と組み合わせることで、シグナルの精度とタイミングがさらに向上します。 シグナルの特性: すべての矢印シグナルは 100% 非リペイント / 遅延なし 一度出現したシグナルは固定され、点滅・消失しません チャート上の矢印、情報パネル、ポップアップ通知、音声アラート、プッシュ通知に対応 EAとの統合が可能(バッファ出力対応)、自動売買やシグナル
A tool for on-chart strategy backtesting and performance analysis. A utility for developing, debugging, and testing custom trading ideas and indicator functions. An indicator designed to quickly test trading concepts and visualize the effectiveness of different input parameters. An all-in-one sandbox for testing everything from simple crossovers to complex, multi-condition trading systems.
Big bull scalper Short Description Master market structure with the precision of the popular Big bull scalper  This tool automatically identifies key pivot highs and lows, plotting unique "angling" trend lines that dynamically define market context. It visually confirms Breaks of Structure (BOS) and Changes of Character (CHoCH), removing all guesswork from your analysis. Key Features:    Automatic Pivot Detection Instantly spots significant swing highs and lows.    Dynamic Angling Lines Visual
Elliot Waves Analyzer Pro calculates Elliot Waves to Help Identify Trend direction and Entry Levels. Mainly for Swing Trading Strategies. Usually one would open a Position in trend direction for Wave 3 or a Correction for Wave C . This Indicator draws Target Levels for the current and next wave. Most important Rules for Elliot Wave Analysis are verified by the Indicator.  The Pro version analyzes Multiple Timeframes and shows the Subwaves and Target-Levels.   For an Overview  " Elliot Waves Anal
作者のその他のプロダクト
Big Player Range
Thalles Nascimento De Carvalho
5 (3)
BigPlayerRange — MT5向け最強インジケーター BigPlayerRange は、MetaTrader 5 で日経ミニやドル先物などの取引において、 最も効果的なインジケーター と評価されています。大口投資家(機関投資家)の行動を可視化し、高精度なテクニカル分析を可能にします。 どのように機能するのか? BigPlayerRangeは、買い圧力ゾーン(緑ライン)と売り圧力ゾーン(赤ライン)を描画し、価格がその範囲を超えるとトレンド方向への動きを示唆します。 緑のライン上で終値: 買いの勢いが強く、上昇トレンドの可能性。 赤のライン下で終値: 売り圧力が優勢で、下落が予想される。 範囲内での価格: レンジ相場でブレイクを待つ段階。 主なメリット: 機関投資家ゾーンの検出: 大口のエントリーポイントを視覚化。 自動ターゲット計算: 利確ポイントを戦略的に設定。 プルバックの可能性分析: リスク管理に役立つ情報提供。 推奨の使い方: Imbalance DOM Pro と併用してゾーンブレイクを確認。 SwingVolum
Box Weis Wave
Thalles Nascimento De Carvalho
5 (1)
Weis Wave Box で分析力を高めましょう! 取引における正確さと明確さ を求めるなら、 Weis Wave Box が理想的なツールです。この 高度なボリューム波動インジケーター は、市場における努力と結果のダイナミクスを明確に可視化し、フロー読みやボリューム取引を行うトレーダーに不可欠です。 主な特徴: カスタマイズ可能なボリューム波 – ティック単位で調整し、戦略に合わせられます。 調整可能な履歴 – 特定期間の分析をより精密に行えます。 実際のボリューム vs ティック数 – 市場への実際の影響を理解します。 エナジーボックスの視覚化 – 市場が大きな努力を示し、価格変動が小さい箇所を確認できます。 ️ 5種類のスイング形態 – totalVol、length、width、barDVol、lengthDVolに基づきカスタマイズ可能。 実際のメリット: ボリューム論理の視覚的明確化 買い手・売り手の力関係の把握 反転や継続の可能性を示す視覚的シグナル 関連インジケーター Big Player Range – 機関投資家の活動ゾーン
Tape Hunter
Thalles Nascimento De Carvalho
Tape Hunter – MT5で努力と結果を見極めるレーダー Tape Hunterは、MetaTrader 5で価格の裏にある真実の動きを見たいトレーダーのための究極のインジケーターです。POC(ポイント・オブ・コントロール)に基づく買いと売りのアグレッシブな出来高を明確かつ直感的に表示し、各ローソク足の市場の努力と実際の結果を視覚化します。 ️ なぜ重要なのか? すべての出来高が価格を動かすわけではありません!Tape Hunterは、努力(アグレッシブな出来高)が価格を本当に動かしているかを示し、以下を見極めるのに役立ちます: 本当のアグレッションとトラップの位置 市場が吸収されているのか押し込まれているのか 支配的な出来高と価格の方向性の一致 Tape Hunterを使えば、プロのテープリーディング視点を得て、より精度の高いエントリーとエグジットの判断が可能になります。 関連インジケーター – フロー分析を強化 より効率的なトレードのために、Tape Hunterと以下の強力なインジケーターを組み合わせて使いましょう: Big Player
Footprint Hunter
Thalles Nascimento De Carvalho
Footprint Hunter – MT4で努力と結果を見極めるレーダー Tape Hunterは、MetaTrader 4で価格の裏にある真実の動きを見たいトレーダーのための究極のインジケーターです。POC(ポイント・オブ・コントロール)に基づく買いと売りのアグレッシブな出来高を明確かつ直感的に表示し、各ローソク足の市場の努力と実際の結果を視覚化します。 ️ なぜ重要なのか? すべての出来高が価格を動かすわけではありません!Footprint Hunterは、努力(アグレッシブな出来高)が価格を本当に動かしているかを示し、以下を見極めるのに役立ちます: 本当のアグレッションとトラップの位置 市場が吸収されているのか押し込まれているのか 支配的な出来高と価格の方向性の一致 Tape Hunterを使えば、プロのテープリーディング視点を得て、より精度の高いエントリーとエグジットの判断が可能になります。 関連インジケーター – フロー分析を強化 より効率的なトレードのために、Tape Hunterと以下の強力なインジケーターを組み合わせて使いましょう:
VWAP FanMaster
Thalles Nascimento De Carvalho
4 (1)
VWAP FanMaster: 正確なプルバック戦略をマスターしよう! VWAP FanMaster は、 正確なエントリーポイント と 効率的なプルバック を求めるトレーダーのための究極のインジケーターです。 VWAP(出来高加重平均価格) と フィボナッチファンライン を組み合わせ、市場での重要な価格ゾーンを明確にマッピングします。 主な機能 シンプルかつ強力 : 垂直線を動かすだけで、自動的に VWAP と フィボナッチファンライン を描画します。 賢いトレーディング戦略 : 描かれたゾーンに価格が戻るのを待ち、 完璧なプルバック をサポートとレジスタンスのレベルで捉えます。 高度なビジュアルツール : 価格のコンフルエンスエリア を即座に見つけて、迅速な意思決定をサポートします。 VWAP FanMasterを選ぶ理由 初心者にも使いやすい 。 2つの強力な分析ツール を組み合わせることで、取引精度を向上させます。 リスク管理を改善 し、明確で一貫した価格予測を提供します。 VWAP FanMasterでトレード戦略を最適化
FREE
Book Data Binance
Thalles Nascimento De Carvalho
Book Data Binance! お気に入りの暗号通貨のオーダーブックにアクセスし、価格、ボリューム、バランスの分析を詳しく知ることができるとしたら、あなたの取引所がDOMへのアクセスを提供していなくてもどうでしょうか? Book Data Binanceを使えば、それが現実になります!このMQL5スクリプトは、市場のダイナミクスを深く理解したい暗号通貨トレーダーのために特別に開発されました。 主な機能: スクリプトメニューで利用可能な任意の暗号通貨のオーダーブックへの直接アクセス。 世界の主要な取引所の1つであるBinanceからのリアルタイムデータの更新。 オーダーブックのバランスを正確に分析し、価格の動きを特定して予測することが可能です。 Imbalance DOM Crypto インジケーター との統合により、市場分析を次のレベルに引き上げます。 なぜBook Data Binanceを選ぶべきなのか? これは、各価格レベルにおける買い手と売り手の行動を理解したい人にとって完璧な補完です!このスクリプトを使用することで、深い洞察を得る
FREE
Volume Flow Binance
Thalles Nascimento De Carvalho
Volume Flow Binance! お気に入りの暗号通貨の times and trades データにアクセスし、取引量の流れや価格の動きを分析する詳細を得られるとしたら、あなたのブローカーが取引履歴の完全なアクセスを提供していなくても、それが現実になると思いませんか? Volume Flow Binance を使えば、それが実現します!この MQL5 スクリプトは、リアルタイムの市場のダイナミクスを詳しく理解したい暗号通貨トレーダーのために設計されています。 主な特徴: スクリプトのメニューにある任意の暗号通貨の times and trades データに直接アクセス。 世界的に有名な取引所 Binance からのリアルタイムデータ更新。 価格の動きを予測し、取引量の流れを正確に分析。 Times and Sales Crypto インジケーター と統合し、市場分析を次のレベルに引き上げます。 なぜ Volume Flow Binance を選ぶべきなのか? これは、リアルタイムで売買行動を理解し、行われた取引を観察するための完璧なツールで
FREE
Cumulative Volume Bands
Thalles Nascimento De Carvalho
CVB Cumulative Volume Bands: 累積ボリュームでトレードを強化! CVB Cumulative Volume Bands は、累積ボリュームに基づく正確なシグナルを求めるトレーダー向けに設計された高度なインジケーターです。 このインジケーターは、累積ボリュームバンドを使用して、買いと売りの圧力を明確に読み取り、反転や強い価格変動を特定するのに役立ちます。 Cumulative Volume Bands for MT5 ! 主な特徴: 累積ボリューム分析 : ボリュームに基づいて重要な圧力点を検出します。 明確なエントリー/エグジットシグナル : リアルタイムでチャンスを捉えます。 簡単な解釈 : ユーザーフレンドリーなインターフェースとシンプルなビジュアル。 全ての資産とタイムフレームに対応 : どの市場でも、いつでも使用可能。 CVB Cumulative Volume Bands で一歩先を行き、自信を持ってトレードの判断を改善しましょう! フィードバックをお寄せいただき、改善にご協力ください!
Swing Point Volume
Thalles Nascimento De Carvalho
Swing Point Volume, the indicator that signals weakness and strength at the tops and bottoms. This indicador can be for used the Wyckoff Method. Information provided; - Swing on customized ticks. - Volume and points in each balance sheet. - Percentage of Displacement. - Sound alert option on top and bottom breaks. - Volume in ticks and Real Volume. - Volume HL (extreme) or (opening and closing) - Customized volume shapes.
Atr Projection
Thalles Nascimento De Carvalho
ATRプロジェクション指標は、金融市場における価格の潜在的な動きの限界について正確な洞察を提供するために設計され、テクニカル分析において堅牢なツールとして際立っています。その柔軟なアプローチにより、ユーザーは各取引資産の特定のニーズに適応する形で直感的に分析メトリクスをカスタマイズすることが可能です。 カスタマイズ可能な動作: ATRプロジェクションは、デフォルトでは過去100本のローソク足の平均の30%を考慮して動作します。この柔軟性により、ユーザーは好みや各資産の固有の特性に合わせてメトリクスを調整でき、よりパーソナライズされた分析が可能です。 30%および100本のローソク足の選択の裏にある論理: 慎重な割合とローソク足の数の選択は、過去の動きを正確に捉え、より精密なプロジェクションを提供することを目的としています。この戦略的なアプローチは、価格が有意な動きの可能性が高い領域を強調し、トレーダーにより情報を提供します。 ATRプロジェクションの利点: 1. カスタマイズ可能なテクニカル精度: ユーザーは各取引資産の特定の条件に合わせてメトリクスをカスタマイズできます。
Long Short Pro
Thalles Nascimento De Carvalho
Long & Short インジケーター - Pro バージョン: 市場分析の無限の可能性を解き放とう! すべての資産に制限なし Long & Short インジケーターの Pro バージョンは、すべての金融資産に対して完全な自由を提供します。制限なしで、同じインジケーターをお気に入りのすべての資産に適用できます! 制限なし インジケーターのすべての機能を制限なしでお楽しみください。Pro バージョンは、完全かつ無制限の体験を提供し、市場のあらゆる機会を最大限に活用できるようにします。 Pro バージョンの特徴 無制限のアクセス : インジケーターをすべての金融資産で使用し、その完全な可能性を探ります。 高度な精度 : 詳細な分析と明確なシグナルを活用して、情報に基づいた安全な決定を下すことができます。 完全な柔軟性 : 資産や戦略に関係なく、取引のニーズに合わせてインジケーターを調整します。 重要な機会のアラートを受け取る アラートを有効にして、重要なレベルを注意深く監視し、市場機会の最前線に立ち続けましょう。 EA 作成のためのバッファパラメ
AI Channel
Thalles Nascimento De Carvalho
AI Channel | MT5向け人工知能搭載の価格チャネル分析インジケーター AI Channel:人工知能でテクニカル分析を次のレベルへ AI Channel は、金融市場の価格チャネルを分析するために 人工知能 を活用した強力なツールです。このセクションでは、この革命的なインジケーターが投資家やトレーダーにどのように役立つかを詳しく解説します。 AI Channelとは? AI Channel は、高度な人工知能アルゴリズムで開発されたインジケーターです。過去の価格データを使用して取引チャネルを識別し、グラフ上の重要なサポートとレジスタンスレベルを強調表示します。 この分析に基づき、市場のエントリーやエグジットの可能性があるポイントに関する貴重なインサイトを提供します。 ️ AI Channelの仕組み AI Channelは価格チャネルに人工知能を適用し、資産のトレンド、パターン、過去の動きを分析します。市場の変化に動的に対応し、異なる時間軸や資産に適応します。 チャネルの上限と下限を特定し、トレーダーに反転やトレンド継続の可能性を明確に示しま
Didi Index Volume
Thalles Nascimento De Carvalho
Didiインデックスボリュームをご紹介します。これは、ブラジルのトレーダーであるオディール・アギアールによって開発されたテクニカル分析の指標であり、金融市場での機会を特定するための先進的かつ強力なアプローチで注目されています。さまざまなプラットフォームで利用可能なDidiインデックスボリュームは、正確な洞察と貴重な情報を求めるトレーダーにとって不可欠なツールとなっています。 この指標は、オディール・アギアールによって作成された名高いDidiインデックスと、取引量の知恵を駆使した組み合わせです。この組み合わせにより、価格の動向と取引量の相互作用をより深く分析し、資産の動きに対するユニークな視点を提供します。 洗練されたアルゴリズムと加重平均の計算を用いて、Didiインデックスボリュームは取引量に基づいた価格変動を予測することができます。この特徴は、新興トレンドの特定、市場の反転、そして適切なエントリーポイントや出口ポイントのタイミングを把握する上で非常に重要です。 Didiインデックスボリュームを使用することで、正確な市場の解釈が可能な客観的かつ信頼性の高い情報にアクセスできます。
TimeChannel
Thalles Nascimento De Carvalho
The "Timechannel" is a powerful technical analysis tool designed specifically for traders who want to gain deeper and more accurate insights into price movements across multiple timeframes (multi-timeframe). This indicator is an essential addition to the toolbox of any serious trader seeking to make informed and data-driven trading decisions. Key Features: Advanced Multi-Timeframe Analysis : Timechannel allows traders to analyze price movements on different timeframes simultaneously. This is cr
Master OBV
Thalles Nascimento De Carvalho
MasterOBV:市場のトレンドを正確に把握しよう! MasterOBV は、 ボリューム 、 ポジティブコレレーション 、および 移動平均線(MA) を組み合わせた テクニカル分析指標 で、金融市場でのトレンドの識別を向上させます。 主な機能: スマートボリューム: 取引量を分析し、トレンドの強さにおける重要な変化を特定します。 ポジティブコレレーション: 相関のある資産を組み合わせ、ペアのボリュームに基づいて価格の移動の可能性を強化する、より広範で正確な視点を提供します。 ビジュアルチャンネル: ビジュアルチャンネルを利用して、トレンドの継続と反転の可能性を明確かつ正確に評価し、直感的な視覚分析を提供します。 スムーズな移動平均線: MA が価格の変動を平滑化し、基礎的なトレンドの方向を特定しやすくします。 なぜ MasterOBV を選ぶべきか? 決定の自信: 複数の要素を統合し、自信を持ってエントリーとイグジットの決定ができるようにします。 包括的な分析: 価格だけでなく、ボリューム、資産の相関関係、およびビジュアルチャンネ
VolaMetrics VSA
Thalles Nascimento De Carvalho
VolaMetrics VSA | 技術分析の強力な味方 VolaMetrics VSA は、 Volume Spread Analysis (VSA) メソッドと詳細な 取引量分析 を組み合わせた技術分析指標です。 価格の重要な動き を 特定 し、 追跡 するために設計されたこのツールは、 取引量 と 価格スプレッド の相互作用を利用して、トレーディング決定をサポートする貴重な洞察を提供します。 Volume Spread Analysis (VSA) の基礎 Volume Spread Analysis (VSA) は、技術分析で尊敬されているメソッドで、 取引量 、 価格スプレッド 、および 価格の終値 の関係を特定の期間内で理解することに焦点を当てています。最も情報を持つオペレーター( スマートマネー )が価格の動きに影響を与えるという考えに基づき、VSA は 積み上げまたは分配のシグナル を特定し、価格の重要な変化を予測します。 VolaMetrics VSA の機能 ️ VolaMetrics VSA は、従来の VSA 分析を自動化し、 逆転の可能性があるシ
SwingVolumePro
Thalles Nascimento De Carvalho
概要 SwingVolumePro は、幅広い金融資産に適用できる高度で多用途なインジケーターであり、さまざまな取引スタイルをサポートします。厳密なボリュームと価格の分析に基づいて開発されており、すべてのレベルのトレーダーが高品質のデータに基づいて情報に基づいた意思決定を行うための明確で正確なシグナルを提供します。 SwingVolumePro.PDF 主な特徴 多用途性: SwingVolumePro は、株式、外為(フォレックス)、暗号通貨など、さまざまな資産に適用できます。スキャルピングから長期ポジションまで、さまざまな取引戦略に対応しています。 正確で信頼できるシグナル: 高精度なシグナルを提供することに重点を置いているSwingVolumeProは、価格吸収パターンや市場のアグレッションを特定するために高度な技術を使用しています。これらのシグナルは明確に表示され、迅速かつ効果的な意思決定が容易になります。 高度なボリュームと価格の分析: インジケーターは、ボリュームと価格の相互作用の詳細な分析を使用して、努力と結果の間にズレがある状況を検出
CVD SmoothFlow Pro
Thalles Nascimento De Carvalho
CVD SmoothFlow Pro - すべての資産に対応した無制限のボリューム分析! CVD SmoothFlow Pro は、精密で無制限のボリューム分析を求めるトレーダーに最適なソリューションです。Cumulative Volume Delta(CVD)の計算と高度なノイズフィルタリングを使用することで、プロ版はあらゆる金融資産の取引に必要な柔軟性と精度を提供します。 CVD SmoothFlow Pro が提供するもの: クリアな分析 :ノイズをフィルタリングし、すべての金融資産における重要なボリュームの動きを際立たせます。 ️ 正確な計算 :買いと売りの差を監視し、外為、インデックス、暗号通貨などの資産におけるボリュームの詳細な動きを提供します。 直感的なインターフェース :データの表示が明確で、分析がわかりやすく効率的です。 トレンドの特定 :市場のトレンドを自信を持って特定し、情報に基づいた意思決定をサポートします。 実用的な用途: リアルタイムで任意の資産における買い手と売り手のバランスを監視します。 ボリュームに基づいてトレンドの反転
Imbalance DOM Pro
Thalles Nascimento De Carvalho
5 (1)
Imbalance DOM Pro:注文帳の不均衡でトレードを強化 MT5で注文帳にアクセスできますか?トレードを新たなレベルに引き上げたいですか? 注文フローを基に意思決定を行っているトレーダーであれば、Imbalance DOM Proはあなたの分析を変革します。スキャルパーや短期トレーダー向けに設計されたこのツールは、注文帳の不均衡を特定し、迅速かつ正確な取引のための貴重な機会を提供します。 小さな価格変動でのチャンスを捉える Imbalance DOM Proは、価格の小さな動きをキャッチしたいトレーダーに最適なツールです。高度な計算により、このインジケーターは注文帳の不均衡を解釈し、素早いエントリーとエグジットのための重要なインサイトを提供します。 重要:MT5で注文帳が利用できることを確認してください Imbalance DOM Proを使用する前に、あなたのブローカーがMT5で注文帳にアクセスできることを確認してください。このインジケーターはリアルタイムデータに依存しているため、MT5は注文帳の履歴を保存しません。そのため、Imbalance D
Cumulative Vol Bands
Thalles Nascimento De Carvalho
CVB Cumulative Volume Bands: 累積ボリュームでトレードを強化! CVB Cumulative Volume Bands は、累積ボリュームに基づく正確なシグナルを求めるトレーダー向けに設計された高度なインジケーターです。 このインジケーターは、累積ボリュームバンドを使用して、買いと売りの圧力を明確に読み取り、反転や強い価格変動を特定するのに役立ちます。 主な特徴: 累積ボリューム分析 : ボリュームに基づいて重要な圧力点を検出します。 明確なエントリー/エグジットシグナル : リアルタイムでチャンスを捉えます。 簡単な解釈 : ユーザーフレンドリーなインターフェースとシンプルなビジュアル。 全ての資産とタイムフレームに対応 : どの市場でも、いつでも使用可能。 CVB Cumulative Volume Bands で一歩先を行き、自信を持ってトレードの判断を改善しましょう! フィードバックをお寄せいただき、改善にご協力ください!
ZigWave Oscillator
Thalles Nascimento De Carvalho
ZigWave Oscillator: オシレーターとZigZagで取引を強化! ZigWave Oscillatorは、金融市場分析において精度と明瞭さを求めるトレーダーに最適なツールです。このインジケーターは、オシレーターの強みとZigZagの視覚的なシンプルさを組み合わせ、迅速かつ効率的に最適な売買機会を見つけるのに役立ちます。 ZigWave Oscillatorを選ぶ理由 精密なオシレーター分析 : RSI、Williams %R、またはCCIを統合し、市場の主要な動きをキャッチします。 動的なZigZagと精密調整 : ZigZagのスイングは、オシレーターの買われすぎや売られすぎの領域で微調整され、反転ポイントを明確に示します。 完全なカスタマイズ ️: オシレーターとZigZagの設定を調整し、自分の戦略に合わせて最適化できます。 直感的で使いやすいデザイン エレガントでカスタマイズ可能なビジュアルレイアウトにより、ZigWave Oscillatorは市場のシグナルを簡単に読み取ることができ、取引に集中できます。 全てのアセット
Mini Indice Composition
Thalles Nascimento De Carvalho
Mini Índice Composition: A Revolução na Análise do Mini Índice! O Mini Índice Composition é um indicador inovador que monitora em tempo real as principais ações que compõem o mini índice, trazendo uma visão quantitativa poderosa sobre o fluxo de ordens do mercado! Como Funciona? Diferente de outros indicadores que utilizam apenas dados históricos, o Mini Índice Composition faz uma leitura ao vivo das ordens que entram e saem das ações, pesando o impacto direto no mini índice. Com
Radar DI
Thalles Nascimento De Carvalho
Radar DI – Indicador de Taxa de Juros para Mini Índice e Mini Dólar com Exportação CSV e Integração IA Radar DI é um indicador especializado que transforma as variações da taxa de juros DI (Depósitos Interfinanceiros) em sinais operacionais estratégicos para os ativos mini índice (WIN) e mini dólar (WDO) . NOVA FUNCIONALIDADE: Exportação CSV + Integração com IA Agora o Radar DI permite exportar todos os dados em formato CSV , incluindo: Variações dos DIs Variação do Mini Índice (WIN)
LSTM Library
Thalles Nascimento De Carvalho
LSTM Library - MetaTrader 5用高度神経ネットワーク アルゴリズム取引のためのプロフェッショナル神経ネットワークライブラリ LSTM Libraryは、MQL5の取引戦略にリカレントニューラルネットワークのパワーをもたらします。このプロフェッショナルレベルの実装には、通常は専門的な機械学習フレームワークでしか見られない高度な機能を備えたLSTM、BiLSTM、GRUネットワークが含まれています。 "トレーディングにおける機械学習の成功の秘訣は、適切なデータ処理にあります。 Garbage In, Garbage Out –予測の品質はトレーニングデータの品質を超えることはありません。" — マルコス・ロペス・デ・プラド博士, Advances in Financial Machine Learning 主な機能 LSTM、BiLSTM、GRUの完全実装 より良い一般化のためのリカレントドロップアウト 複数の最適化アルゴリズム(Adam、AdamW、RAdam) 高度な正規化テクニック 包括的な評価指標システム トレーニング進捗の可視化 クラス重みによる不均衡デー
フィルタ:
epadilha
729
epadilha 2024.10.31 14:46 
 

ユーザーは評価に対して何もコメントを残しませんでした

Thalles Nascimento De Carvalho
8311
開発者からの返信 Thalles Nascimento De Carvalho 2024.10.31 15:01
Obrigado!🙏
レビューに返信