
"Renko ZFS"は利用できません
他のVasiliy Smirnovのプロダクトをチェック
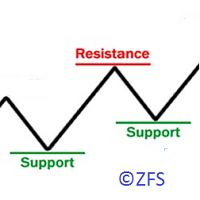
The indicator displays the resistance/support levels based on the history data of price action. It requires a depth of history to calculate the levels. The tool has been developed using an original proprietary technique. The resistance and support levels indicate the accumulations of orders.
Indicator Parameters Start Data/Time - initial date/time of the history data for calculation of levels Width of Lines Resistance/Support in Points - thickness (density) of lines in points, it is recommende
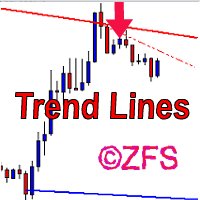
The indicator draws channels. The estimated movement of the price within the channel is shown with a dotted line. The lines of the channel are the support and resistance lines. This allows using them in both rebound and breakout trading. The inclination of the channel allows determining the direction of the current trend, the channel width and angle allow estimating the current volatility. The channels are based on fractal bars, determined using the author's original method, 4 dimensions from th

The main function of the indicator is to draw the target lines (support and resistance lines). The lines are plotted according to a special fractal algorithm. The lines are calculated with consideration of the zero bar. A different, more complicated calculation algorithm is used on the zero bar, in contrast to the other bars. This allows reacting to the market situation in real time, but on the other hand, redrawing is possible on the zero bar. If necessary, the zero bar can be omitted from calc

Пинбар — это лишь 1 свечка или бар, представляющая собой цену, что отскочила от максимального или минимального ценового уровня. Свечка открылась, цена пошла в одном направлении и затем резко развернулась за период свечи — так формируется пинбар. Пинбар легко заметить — длинная тень (хвост), маленькое тело. Запомните: не все свечи с длинным хвостом являются пинбарами. Только когда хвост намного больше тела свечи, формируется пинбар. Как правило, рынок при этом закрывается там, где открылся или по

粗化されたフラクタルに基づく回帰チャネル。
パラメータ:
期間の再計算-インジケータ計算期間
スイッチゼロ(最後の)バー-最後に開いているバーを数えますか?
チャネルに対する丸め価格の位置を変更するときにプッシュ通知を切り替えます
ラインリスク-リスクラインの表示
Coeff Risk,%-トランザクションの最大割合をパーセンテージとして表します
このチャネルでは、市場における傾向とその強さを評価し、必要なリスクを伴う取引の要求を正しく行うことができます。
基本的な分析を考慮して、より高い時間枠のチャートで取引することをお勧めします。
取引のための可能な信号:1. チャンネル境界吹き出物
2. チャネル境界からのリバウンド
3. チャネルトレンド別
取引の結果、矢印指標、顧問の仕事、取引戦略の開発を分析するためのグラフィカルな指標。
主なパラメータの1つは、利益の最小割合です。
この指標は、閉じたバーとフラクタルを考慮して、任意のチャート上のすべての傾向を示し、各傾向の利益の最大割合を計算します。
さらに、商品の平均利益率を計算します。 楽器の中でより大きな割合は、投機のためのこの楽器の歴史的魅力を示しています。
インジケータを高速化するには、より小さな計算間隔を使用します。
取引の結果、矢印指標、顧問の仕事、取引戦略の開発を分析するためのグラフィカルな指標。
主なパラメータの1つは、利益の最小割合です。
この指標は、閉じたバーとフラクタルを考慮して、任意のチャート上のすべての傾向を示し、各傾向の利益の最大割合を計算します。
さらに、商品の平均利益率を計算します。 楽器の中でより大きな割合は、投機のためのこの楽器の歴史的魅力を示しています。
インジケータを高速化するには、より小さな計算間隔を使用します。