Color Candles Identify the Major Trend
- インディケータ
- Ziheng Zhuang
- バージョン: 4.20
- アップデート済み: 23 3月 2020
- アクティベーション: 10
インジケーターには 2 つの部分が含まれています。
パート I: カラーキャンドルが主要なトレンドを示す
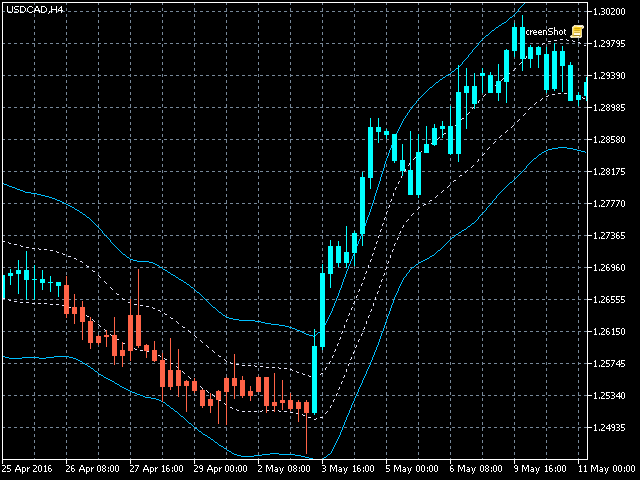
カラーローソク足とは、ローソク足の色で相場の状態を識別することです。
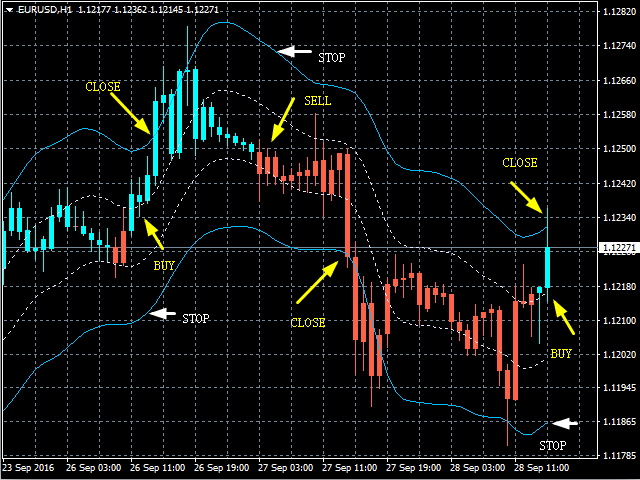
スクリーンショットに示されているように、色がアクアの場合、市場はロング注文を発注するか、ショート注文を終了する必要がある状態です。色がトマトの場合は、ショート注文を行うか、ロング注文を終了する時期です。
色が変化している場合は、その完了を (現在のバーが閉じるまで) 待つことをお勧めします。
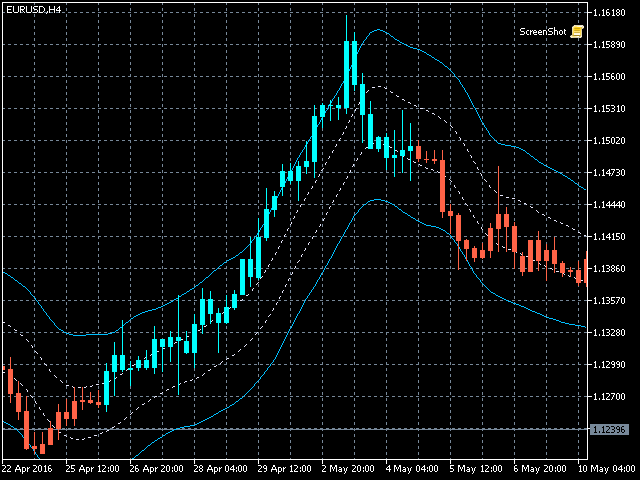
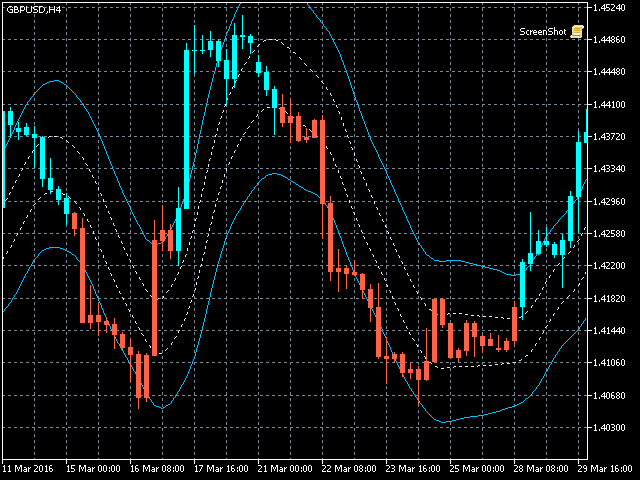
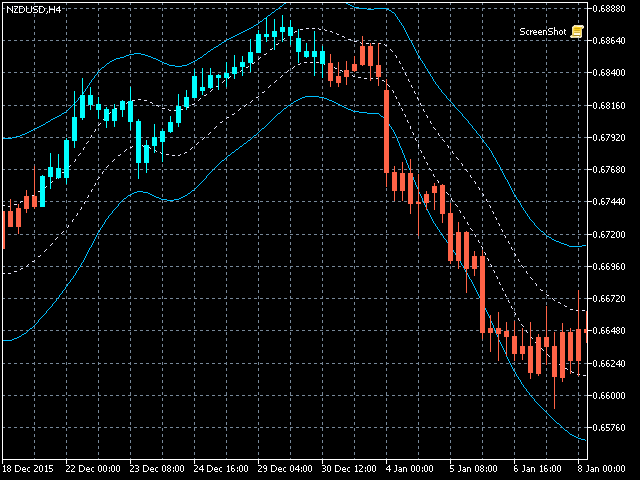
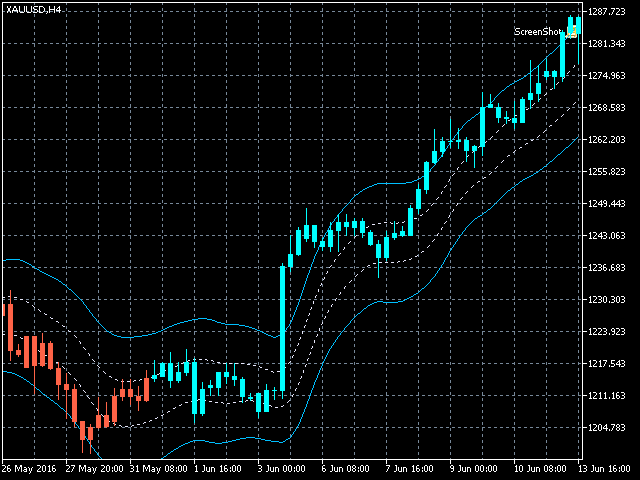
パート II: バンドを描く
内側のバンドは安全領域として定義され、外側のバンドはクローズオーダー用です。
以下のような取引戦略:
色がアクアで、価格が内側のバンド内にある場合は、ロング注文を出します。価格が外側のバンドを超えたら、注文を閉じる時期です。
色がトマトで、価格が内側のバンドにある場合は、ショート注文を出します。価格が外側のバンドを越えたら、注文を閉じる時期です。
注:価格が内側のバンドの場合のみエントリーマーケットです。これは非常に重要です。
入力パラメータ
ShowColorCandle - true は、インジケーターがカラーキャンドルを描画することを意味します。
AlertaColorChange - true は、色の変更が完了したときに警告が表示されることを意味します。
EmailColorChange - true は、色の変更が完了したときに電子メールが送信されることを意味します。
ShowBands - true は、インジケーターがバンドを描画することを意味します
AlertCrossOuterBands - 真の男性は、価格が外側のバンドを横切るときに警告します
AlertCrossOuttrBands - true は、価格が外側のバンドを横切るときに電子メールが送信されることを意味します。

For my strategy a great EA-indicator !!!!