YouTubeにあるマーケットチュートリアルビデオをご覧ください
ロボットや指標を購入する
仮想ホスティングで
EAを実行
EAを実行
ロボットや指標を購入前にテストする
マーケットで収入を得る
販売のためにプロダクトをプレゼンテーションする方法
MetaTrader 4のための有料のエキスパートアドバイザーとインディケータ - 77
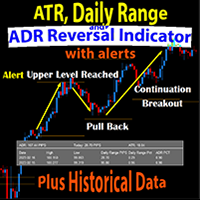
The Daily Range and ADR Reversal Indicator shows you where price is currently trading in relation to its normal average daily range. You will received alerts via pop-ups when price exceeds its average daily range. This alert is a signal for a potential pullback or reversal. This gives you an edge on identifying and trading pullbacks and reversals quickly.
The Indicator also shows you the Daily Range of Price for the current market session as well as previous market sessions. It shows you the A

10 COPIES AT $139,99 ! After that, the price will be raised to $ 179,99 .
DARK KNIGHT is not your standard mean reversal night scalper. After much study and real trading for years, we had an insight that led to the development of a unique proprietary algorithm for assertive stagnation zone indication like no other algorithm has and we applied it in a mean reversal strategy, achieving results that we had never seen before and in a vast number of pairs.
The Dark Knight strategy operates based
A trading system based on divergences is one that uses divergences between technical indicators and market prices to identify potential trading opportunities. Here's how this type of trading system operates: Divergence identification: The divergence-based trading system seeks to identify divergences between technical indicators and market prices. A divergence occurs when the market price and a technical indicator move in different directions, which can indicate a possible trend reversal. Signal
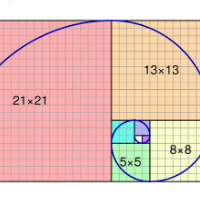
MT5の場合: https://www.mql5.com/en/market/product/94573
最先端の「Fibo SnR」エキスパートアドバイザーをご紹介 – あなたの究極の取引仲間です!
最新かつ最も洗練されたエキスパートアドバイザー (EA)、「Fibo SnR」エキスパートアドバイザーで取引体験に革命を起こしましょう。 この画期的なツールは、高度なアルゴリズムの力とフィボナッチレベルの時代を超越した原理を利用して、取引努力において比類のない精度と精度を提供します。
主な特徴: 1. 適応型フィボナッチ分析: 「Fibo SnR」エキスパートアドバイザーは、市場のボラティリティと価格変動に基づいてフィボナッチリトレースメントとエクステンションのレベルを動的に調整する適応型アルゴリズムを採用しています。 これにより、EA はさまざまな市場状況に確実に適応し、エントリーポイントとエグジットポイントを驚くべき精度で最適化します。
2. 複数のタイムフレームの統合: この EA は、複数のタイムフレームをシームレスに統合することで、単一のタイムフレーム分析を超

この EA では、固定ロットまたは動的ロットを選択できます。 固定を選択した場合は、目的のロットを設定します。一方、動的を選択した場合は、リスクを % で設定します。 ストップロスとテイクプロフィットを設定できます。デフォルトでは、1.5% に設定されています。 EA がサポートとレジスタンスを計算する時間を設定できます。すべてをそのままにしておくことをお勧めします。 幸せな取引
Kono EAde wa, kotei rotto matawa dōteki rotto o sentaku dekimasu. Kotei o sentaku shita baai wa, mokuteki no rotto o settei shimasu. Ippō, dōteki o sentaku shita baai wa, risuku o-pāsento de settei shimasu. Sutoppurosu to teikupurofitto o settei dekimasu. Deforutode wa, 1. 5-Pāsento ni settei sa rete ima

The EA is used as an assistant for traders in the Trading Masters group. The EA assists with identifying setups when taking trades using the strategies outline in the Trading Masters Group. The EA has been developed and is intended for use by community members who understand the concepts and would like assistance navigating trade setups. It is recommended to first understand the concepts presented in the Trading Masters group before purchasing this EA so the user can understand and benefit fr

A percent graphic is a type of graph or chart used to represent data as a percentage of a whole. Percent graphics are often used to illustrate how a given set of data is distributed between different categories or how certain trends have changed over time. Percent graphics can be used to show the composition of a dow jones , or the performance of a company over a given period of time d1 percet w1 perncet m1 percent y1 percenty
Unlike many other indicators including the moving average indicator, Pivot Point can be a leading indicator. In these systems, the price levels of the previous period are used to determine the critical points instead of relying on the current price performance. Such an approach provides a clear framework for traders to plan their trades in the best possible way.
You can use this method and its combination with the methods you want to build and use a powerful trading setup. MT5 version
Let us k
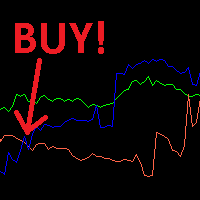
スキャルピングの準備が整った取引戦略。 青い線が赤い線を下から上に横切るとき、買い注文を開きます。 赤い線が青い線を下から上に横切るとき、売り注文を開きます。 指標期間 14. 通貨ペア: GBPUSD、EURUSD、XAUUSD、AUDUSD、USDJPY。 USDCHF、USDCAD。 ストップロスは、通貨ペアに応じて 45 ~ 75 ポイントに設定されます (実験が必要です)。 TakeProfit は、通貨ペアに応じて 20 ~ 40 ポイントに設定されます。 取引に最適な時間帯は、午前 9 時から午後 20 時までです。
取引するロットサイズ: 残高が $100 から $500 の場合 - ロットサイズは 0.01 残高が $500 から $1000 の場合 - ロットサイズは 0.03 残高が $1000 から $2500 の場合 - ロットサイズは 0.04 残高が $2500 から $4500 の場合 - ロットサイズは 0.05 残高が $4500 から $7000 の場合 - ロットサイズは 0.07
インジケーターの説明: このインジケーターは、3 つの

DigitalTrend is an indicator of bands and fractals at certain points that marks multiple entries buy and sell! somewhat similar to bolinger bands, but more advanced where when the candles go out of the band, and mark the points blue or red, the red dot marks buy, when it leaves the band, the blue dot marks sale when it leaves the band, perfect for scalping and lengths! works for all forex pairs and synthetic indices! from now to enjoy! good profit World Investor.

Buy Sell Signal It is an indicator specialized in capturing inputs in various temporalities, where in the square of the indicator it marks you with red or green (IN THE POINTS) giving you the entry trends be red Sell , be green BUY , It works very well in all pairs. It is a pearl of indicator since it marks entries at all points either scalping or long! in any temporality. from now to enjoy! good profit World Investor.
A robot that trades on the signals of this indicator https://www.mql5.com/en/market/product/46338
This indicator is a high-frequency tool designed for technical analysis of price dynamics in the Forex market in the short-term period. The scalping approach, where this indicator is used, is aimed at quickly executing trades and achieving small profits within short timeframes. The indicator is based on price chart analysis and employs highly sensitive mathematical algorithms to determine changes

Trading strategy: Scalping. Trading on impulses in automatic trading has been used for a long time and the scheme is not new to traders. It is difficult to catch such moments manually, but the adviser copes instantly. Automated trading uses 2 approaches to trade in such cases: look for pullbacks after impulses. trade in the direction of momentum. The search for entry points is done like this: the adviser measures the rate of price change for which this change should occur, if the conditions for

こんにちは、スワップトレンドをご覧ください。スワップ トレンドは、シンプルだが効果的な EA です。すべての交換で使用できます。 EA は取引のスワップを読み取り、上昇トレンドか下降トレンドかを判断します。
テストの結果は驚くべきものです。デモ版で試してみてください。 少なくとも 1 つの肯定的なスワップの売買があることを確認してから、テストします。
スワップは常に変化していますが、テストでは現在のものを使用します。このため、長期間にわたってテストしないでください。
Kon'nichiwa, suwapputorendo o goran kudasai. Suwappu torendo wa, shinpurudaga kōkatekina EAdesu. Subete no kōkan de shiyō dekimasu. EA wa torihiki no suwappu o yomitori, jōshō torendo ka kakō torendo ka o handan shimasu. Tesuto no kekka wa odorokubeki monod

The "Strategic scalping" indicator displays possible trend reversal points on the chart. The indicator highlights two different pivot points: high points (pivot points from above) and low points (pivot points from below). Upper pivot points are indicated by down arrows and appear on the chart when the price reaches a high and starts to fall. Pivot lows are indicated by arrows pointing up and appear on the chart when the price bottoms out and starts to rise. The indicator can be useful for trade

The best way to identify the target price is to identify the support and resistance points. The support and resistance (S&R) are specific price points on a chart expected to attract the maximum amount of either buying or selling. The support price is a price at which one can expect more buyers than sellers. Likewise, the resistance price is a price at which one can expect more sellers than buyers.

A Market Profile is an intra-day charting technique (price vertical, time/activity horizontal) devised by J. Peter Steidlmayer, a trader at the Chicago Board of Trade (CBOT), ca 1959-1985. Steidlmayer was seeking a way to determine and to evaluate market value as it developed in the day time frame. The concept was to display price on a vertical axis against time on the horizontal, and the ensuing graphic generally is a bell shape--fatter at the middle prices, with activity trailing o

Pivots Points are price levels chartists can use to determine intraday support and resistance levels. Pivot Points use the previous days Open, High, and Low to calculate a Pivot Point for the current day. Using this Pivot Point as the base, three resistance and support levels are calculated and displayed above and below the Pivot Point. and below the Pivot Point.

A cycle is a recognizable price pattern or movement that occurs with some degree of regularity in a specific time period. The analysis of cycles shows us support and resistance that represent smart places to anticipate a reaction in the price of an asset, and therefore represent a basic tool in technical analysis. Cycle lengths are measured from trough to trough, the most stable portion of a cycle. The information you find on this page is useful to combine with Elliott wave analysis .

King Grow is a fully automated hedging robot that uses a very efficient breakout strategy, advanced money management and probabilistic analysis. Most effective in the price consolidation stages that occupy the bulk of the market time. Proven itself on real accounts with an excellent risk-to-reward ratio. Does not need forced optimization, which is the main factor of its reliability and guarantee of stable profit in the future. S uitable for both beginners and experienced traders. Entry and exi
This is a tool for back testing your strategy manually on the chart , it's very easy to use, it may be useful for both professional and beginner traders. Features : • Simple buttons. • Export : P/L Points , Lots , Order P/L Result , Balance , to CSV file. • Ability to choose Auto or Manual StopLoss & TakeProfit. • Manual lot , or lot by risk can be used.
• Ability to change the chart time frame for live charts without losing the backtest result , you can even cl
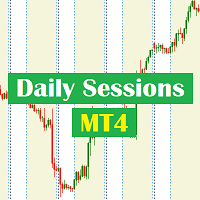
Daily Sessions utility is the best tool to highlight trading sessions , the trader can set any starting hour and ending hour to mark his trading session. Main features :
Three Custom sessions. Customizable Colors. Customizable vertical lines for the start and end of sessions
Ability to activate or deactivate sessions.
Ability to use any session time and cross days sessions (example : start hour 20 & end hour 4 in the next day).

TELEGRAM ID > armanshayaan i did not upload main file here for security reason Life chaNge forever with forex
This Indicator is a Full Forex System with 96 to 98% accurate. It is the BEST and EASIEST, most PROFITABLE thing that you have ever seen. With this Indicator you have the Ability to look behind the Candles.
The System detect how much Volume is in the Market. It detects if big Players are in the market.Than you will get a Signal. So you have a MASSIVE ADVANTAGE ove

Scalping Boss It is an oscillator with a programming where the golden line marks you buy or sell, is %100 for scalping , clearly it is accompanied by an rsi that also helps you capture the trend and rebounds, It works for all forex pairs, it works very well in the EUR/USD, USD/JPY pair works for any season It also works for the synthetic indices market. works very well in all pairs of VOLATILITY / JUMPS good profit, World Investor.

Rsi Versace It is an indicator programmed only for sales and purchases, It is very clear when the bearish wedge forms, it marks the entry with the change of color in red for the drop Also when it marks the bullish wedge it changes color to green when it is bought! used on all forex pairs also in synthetic indices! It works very well for volatility and forex pairs as well as gold! used at any time to scalp and long! To enjoy , good profit, World Investor

Zone Buy Sell It is an indicator that is about input marks in different areas of the graph when it starts the brands in green, it marks the purchase area, When you mark the lines in red, you mark the sales area, It is used to scalp and long in h1 or h4 It is used in any temporality! works for forex markets! All pairs, It also works for synthetic index markets! no more to enjoy Good profit. World Investor

WARNING!! We do not promise huge profits!! Because the amount of profit depends on the capital you use.
What you need to know This is made with a very mature calculation, embedded with a very good strategy. No matter how much capital you use, it will generate a consistent profit of 10% every month.
EA Preman Pasar will help you generate 10% profit every month calculated from the capital you use.
EA Preman Pasar will only open order according to market price calculation, open order will be

K-Bot is a fully automatic Expert Advisor for Scalping Trading. This Expert Advisor needs attention, in fact presents highly customizable. K-bot is based on KiniTrade MT4 indicator, these Trades can be manage with some strategies. The basic strategy starts with Market order in trend following, but you can change it, in others strategies counter trend. Parameters : K-Bot adv Settings Magic Number: ID number of the orders. Max Spread: maximum spread to trade. Money Management Settings Lots: num

Индикатор виртуального эквити, представляемый здесь, может работать по нескольким
символам одновременно. Для каждого символа задается направление ( Buy/Sell ) и размер позиции.
В настройках также указывается размер предполагаемого депозита, дата открытия и закрытия
позиции.
На графике при этом устанавливаются вертикальные линии, обозначающие указываемые в настройках даты.
После установки индикатора на график, можно изменять время открытия и закрытия позиции,
передвигая эти линии.
Да
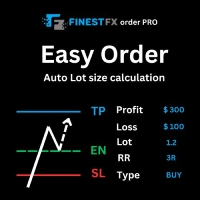
FinestFx order PRO is easy order execution and auto risk management tool developed by FinestFx official Programmer : Mohammed Rafi Just move SL,TP , Entry lines or Type SL,TP on entry columns . Lot are calculated automatically by fill out the loss cut amount. Work with all base currencies Fixed loss amount can be selected. Calculate risk rewards. Market order, limit order, and stop order are selected using buttons Supports FX, CFD, and crypto currency on MT4 Visit the owner website to see its

利益のロックをサポートする外国為替取引のインテリジェントアルゴリズム。
EAはTFM30、H1、H4で動作し、市場が方向を逆転したときに長時間変動するのを防ぐために、利益時にポジションをロックするロック利益/トロールストップを装備しています。
取引の推奨事項: 推奨TF(時間枠):M30/H1。 推奨ペア:EURUSD、USDCHF、EURGBP、AUDUSD すべてのシンボルペアをサポート 最低入金額:$ 200(0.01ロットの1ペア)。 Laverage最小:1:500
推奨取引口座: Standart Akunは、最低ロット0.01-1通貨ペア(例:EURUSD)で$400の低リスクを預金します。 Standart Akunは、最小ロット0.01-1通貨ペア(例:EURUSD)で$200の中リスクを預金します。 StandartAkunは、最小ロット0.01-1通貨ペア(例:EURUSD)で$100のハイリスクをデポジットします。 200ドル未満の預金の場合に安全にするにはセントアカウントを使用してください。

Trend Oracle trend indicator, shows entry signals. Displays both entry points and the trend itself. Shows statistically calculated moments for entering the market with arrows. When using the indicator, it is possible to optimally distribute the risk coefficient. The indicator can be used for both short-term pipsing and long-term trading. Uses all one parameter for settings. Length - the number of bars to calculate the indicator. When choosing a parameter, it is necessary to visually similarize s

Tired of choosing indicator settings, losing precious time? Tired of uncertainty in their optimality? Scared by the unknown in their profitability? Then the Trend IM indicator is just for you. The indicator will save you a lot of time that can be spent on more useful activities, such as relaxing, but at the same time, the efficiency will increase many times over. It uses only one parameter for setting, which sets the number of bars for calculation.
Trend IM is a reversal indicator and is part

MAMMA インジケーターは、ストップ、ボリューム、またはリスクのレベルを計算する上級トレーダーだけでなく、初心者にも理想的です。 パラメータを制御し、ツールを取引に適応させるためのコックピットがあります。 このコックピットは、必要に応じて移動したり、単純に縮小して拡大したりできます。 3 つの計算方法があります。 * ロットサイズとストップサイズで何をする予定かを基にリスクを自動計算できます * 予想されるリスクとストップサイズに基づいてロットサイズを設定できます ※想定されるリスクとロットサイズから最適なストップサイズを設定できます。 各計算により、リスクの正確な量を知ることができ、計画されたストップの位置をチャートで直接確認することもできます。 計画を見失わないようにするために、その日の目標と最大損失を設定できます。 最後に、現在の市場または単に現在の日、週、月の進行状況を総合的に確認できます。 ボーナスとして、理想的なストップが提案された新しいオープンポジションごとにアラートを受け取ります。 最後に、コックピットはフランス語と英語の間でプログラミングできます。 ブローカーのサー

Robi Auto Expert Advisor works using sharp tick movements. It goes through the entire history and all currency pairs with one single setting. The more latency your broker has in the amount of the Internet channel, the higher you need to set stop loss, take profit and trailing stop so that the server can process them at the desired price and the lower the trading frequency will be. The uniqueness of the Expert Advisor is that it can be run on any hourly period, on any currency pair and on the se

The Hybrid Trend indicator is used to determine the strength and direction of a trend and to find price reversal points. The Hybrid Trend indicator is used in the forex markets. The indicator was created in order to display the trend in a visual form. One of the main definitions for monitoring the currency market is a trend.
The trend can be up (bullish) or down (bearish). In most cases, the trend rises for a long time and falls sharply, but there are exceptions in everything. The price movem

(Google 翻訳) この指標は、 MetaTrader インストールのソース コード例として提供されている元の ZigZag に基づいています。 「深さ」チャネルとそれぞれのブレークアウトを表示するための追加機能を追加して書き直しました。 また、以前のジグザグ ポイントを観察することもできます。 オプションで、ブレークアウトが発生したときにユーザーに警告することができます。 アラートは端末上に表示することも、モバイル デバイスのプッシュ通知を介して独自のカスタム テキストで表示することもできます。 (Original text) This indicator is based on the original ZigZag provided as a source code example with MetaTrader installations. I rewrote it with some extra features for displaying the “depth” channel and the respective break-outs. It also allows

The AG algorithm is an element of a complex trading system for trading a basket of currencies for 8 major currencies for all 28 currency pairs. The algorithm is used to process data from the cluster indicator CCFp, determining the width of the trading range relative to the previous ones, and to calculate the trend and signal to enter and exit a position. The algorithm receives data from the indicator CCfp through 8 buffers Signals to open and close orders are transmitted for automatic tradin

Kangooroo is the advanced grid system which already works on real accounts for years. Instead of fitting the system to reflect historical data (like most people do) it was designed to exploit existing market inefficiencies. Therefore it is not a simple "hit and miss" system which only survives by using grid. Instead it uses real market mechanics to its advantage to make profit Only 5 download of the EA left at $555! Next price --> $1111 Symbol AUDCAD, AUDNZD, NZDCAD,GBPUSD,EURUSD Timef
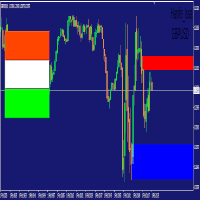
This indicator will draw you strong supply-demand level that we may see some reactions in the market. You can use it from H1 TO M5. Everything is set, you don't need to configure something, all you need is to wait for confirmation entry in lower timeframe like rejection at the zone, engulfing, break of structure... depends on your trading criteria. If the zone failed to hold and the zone is still on the chart, use again confirmation entry once the price came back. enjoys!!!
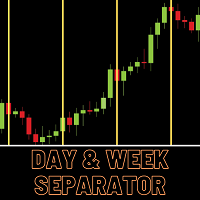
Day and Week separator is a very simple tool to show day and week separator lines from a specific time mentioned in the input. This is specially helpful for the trades who has time zone differences in their broker terminal. Let us take an example If user know that at 7:00 in the chart his local time 00:00 then he will simply put 7:00 in the input . Separator lines will starts drawing from current day's 7:00 There is also a bold line for weekly separator

After purchasing, you can request and receive any two of my products for free!
После покупки вы можете запросить и получить два любых моих продукта бесплатно! Fully automated trading algorithm Golden Scanner. The advisor is easy to use! Install it on the timeframe chart (M1) with the attached settings in the discussion . Working symbol XAUUSD (GOLD), Timeframe - (M1), Minimum deposit - $100. The EA does not have: Recommended settings martingale grid averaging methods Always protected by fixed

Candlestick patterns have little value without the right price action context. If you’ve been studying candlestick formations, you must have heard this principle many times over. You cannot trade patterns in a vacuum. But what do we mean by context ? It is an overall technical assessment that encompasses: The market’s trend Support and resistance structure Recent price formations Volatility It seems intimidating at first, but a simple trading indicator can help us out here - the moving a

One of the most popular methods in technical analysis used by both institutional and retail traders is determining the resistance and support levels using the so-called Pivot Point, which in turn is the starting point when defining market sentiment as bullish or bearish. Resistance and support levels are distinguished for their ability to limit the appreciation/depreciation of a certain asset. The most-commonly used technical tools for determining resistance/support levels include: prior tops/bo

You have made a great decision to try this powerful indicator. The FX Turbo is a supreme forex trading indicator that will help you achieve your financial goals on currency market. In this post you will learn how to use and trade with FX Turbo Marksman indicator. Recommended Timeframe
This indicator was optimized for 1-hour timeframe but you can successfully use it on any timeframe as well. Generally speaking higher timeframes are for swing trading and and lower timeframes are for scalping.

System 17 with ATR Strategy is a trend-Momentum system filtered by volatility. Averange true range is the indicator of volatility that I use as filter. Best time frame for this trading system is 30 min. Currency pairs: EUR/USD, USD/CAD, USD/JPY, AUD/USD, GBP/USD, GBP/JPY, NZD/USD, EUR/JPY. Metarader Indicators: System 17 (trend following indicator with arrow buy and sell), this indicator is formed by moving average 12 period, close, Bollinger Bands period 8, deviation 0.75, Moving average 21

Rioは、市場の動きを予測するために、伝統的なテクニカル分析と組み合わせて人工知能を使用する複雑で斬新なアルゴリズムです。このExpert Advisorは、テクニカル分析指標からのデータを使用して訓練されたリカレント・ニューラル・ネットワーク、特にLong-Short-Term-Memoryセルを利用しています。さらに、LSTM ネットワークは、短期および長期のヒストリカルデータを考慮することができるため、時系列分析に特に適しています。 注:これは 限定販売 です:このEAは現在の価格で 10本中2本 のみ販売されます。次回の価格: $399 このEAの価格は、このシステムで取引するユーザー数を制限するために、着実に値上げされます。 ライブ信号 :https://www.mql5.com/en/signals/2086250 MT5バージョン : https://www.mql5.com/en/market/product/93332 重要: 追加情報や特典をご希望の方は、商品ご購入後、PMを通して直接弊社までご連絡ください。 メカニクス このExpert Advisorでは、マーチ

F ully automated Expert Advisor using the advanced algorithm for trading the EURUSD Designed for profit in a short period of time and big profit in a long run.
Prefers EURUSD 1H. Principle of operation The SELL and BUY orders are opened (depending on the parameters set), guided by signals and the market situation. Recommended parameter: Use an ECN broker account. minimum deposit of 100$ USD. use it in H1 time frame recommended symbol is EURUSD
input parameter: TrendType
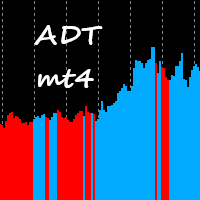
This indicator takes input from Accumulation/Distribution and a trend filter, and presents the output in a separate indicator window as a histogram. Great for scalping. Settings: TrendPeriod Features Alerts. How to use: Simply attach to any chart with default setting, or set the TrendPeriod to your preference. Zoom chart in to get a better view of the histo color. Buy: Blue histo color on multiple timeframes. (e.g., M30-H1-H4-D) Sell: Red histo color on multiple timeframes.
Or backtest and u

IMPORTANT! Contact me immediately after the purchase to get instructions and Manual Guide to set up EA. This EA is designed to pass the challenges of the following prop firms (This list will be updated every week): -Next Step Funded
-Funding Pips(MT5)
-Nova Funding
Features: -No license required. -Unlimited uses. -Working symbol: US30(Dow Jones). -Timeframe: any (not sensitive, but M1 recommended). -It is mandatory that the server does not have slippage.
Parameters: Mode: (true) If you w

Volume predictor is an essential indicator if you trade with volumes, this indicator predicts the final volume of the current candle and increases it's precision as the time goes by. In order to predict the final volume the current volume and market conditions are used, the predicted volume adjust in real time. You can change every individual color of the indicator to your liking, the default colors were assigned to be easy on your eyes while using a dark theme. Don't forget to leave your revie

Support and resistance are the basic and widely used trading strategies in the financial trading world. The Support and Resistance indicator for MetaTrader is the best technical tool for identifying potential areas of a support or resistance zone. The indicator is a multi-timeframe indicator that automatically scans through different timeframes for support&resistance zones. It displays lines of the support&resistance zones of a specified period in all the time frames. This implies that the indi
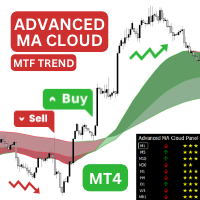
Introducing the Advanced MA Cloud indicator for MetaTrader 4 - a powerful indicator system that will help you identify potential buy and sell opportunities, as well as potential trend reversals. Advanced MA Cloud indicator is a great trend following indicator based on three fully customisable Moving Averages. In addition, t he indicator can also act as a support and resistance using the two clouds formed by the moving averages. Each moving average and each cloud changes its color according to
You can identify the strength of the main forex currencies with this tool. You can combine it with different styles and get the best strategy out of it. It has very high power. It can be customized.
MT5 version
This indicator will have many updates and special settings will be added to it.
You can contact us via Instagram, Telegram, WhatsApp, email or here. We are ready to answer you.

The TrendChangeZone indicator displays global and local price highs and lows on the chart. The indicator also shows the global trend on the chart and corrective waves. This indicator is designed to determine the direction and change the trend. Most importantly, the indicator shows trend continuation or reversal zones. An indispensable assistant in trading. The indicator does not redraw. The indicator can work on all trading instruments.
Important !!! Top trend if 2 (two) or more blue segments

This EA is designed to simplify your trading activities and automatically close all open order when the trendline or horizontalline you draw touched by the running price, You can also choose to close only all buy order or close only all sell order or both close all buy and sell order at the same time. This EA include : 1. Close Mode, BUY or SELL mode 2. Time Filter (Broker Time) 3. Advanced Breakeven and Trailing Stops 4. Partial Close 5. Magic Number You can save it as template (for BUY or SELL
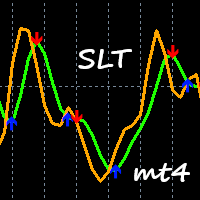
This indicator takes input from a trend filter and 2 oscillators, and presents the output in a separate indicator window as 2 lines and arrows. Great for scalping. Settings: No need to set up the indicator. Features Alerts. How to use: Simply attach to any chart Zoom chart in to get a better view of the lines. Buy: Blue arrow. Best results when entering buys above the 0.00 level, and confirming on higher timeframes too. Sell: Red arrow. Best results when entering sells below the 0.00 level, a
One of the basic needs of every trader is to have a checklist to enter every position. Of course, using pen and paper may not be convenient forever. With this indicator, you can have a small checklist next to the screen for each of your charts and use it for better use in your trades. MT5 Version This indicator will have many updates and special settings will be added to it.
You can contact us via Instagram, Telegram, WhatsApp, email or here. We are ready to answer you.

Thank you for your interest in the Boss EA, This is the MetaTrader 4 version of this popular expert advisor
EXPLANATION:
The Boss EA is a 100% Fully Automated Breakout Scalping Expert Advisor. It locates the most optimal positions by detecting the relative highs and lows of the market. With a very low average holding time of trades the Boss EA makes the most of its time by squeezing as much profit it can get while protection your account from drawdown. The system is good for prop fir

電話と電子メールに通知機能を追加した、標準の相対強度指数 (RSI) インジケーター。 インジケーターの設定では、インジケーターの上限と下限を指定できます。到達すると、インジケーターが電話とメールに通知を送信します。 通知は次の形式で送信されます: 通貨ペア + 時間枠 + 通知時間。 この無料の標準インジケーターを取引戦略で使用する場合、このインジケーターの改良版が役立つ場合があります。 また、インジケーター設定には、無料版にあるすべての標準パラメーターがあります。
インジケーターの設定: period - 指数計算の平均期間。 applied_price - 適用価格。 ENUM_APPLIED_PRICE 列挙値のいずれかになります。 最大 - インジケーターがこの値に達すると、トレーダーは電話と電子メールで通知を受け取ります。 最小 - インジケーターがこの値に達すると、トレーダーは電話と電子メールで通知を受け取ります。

10 COPIES AT $ 99 ! After that, the price will be raised to $ 150 .
After analyzing the EURUSD pair for a few years we noticed some interesting alpha opportunities, and developed this nice E.A. for ourselves. Now we are offering the opportunity for you to have this great tool in your automated trading portfolio.
Since 2016, the EURUSD pair has shown a very interesting feature that has allowed this exclusive strategy to be developed from that date. It's a strong algorithm that can be used ag

This indicator offers a unique perspective; it looks a lot like Envelopes but is totally different.
The default parameters are the same as I use in my strategies, every day and with all pairs, although each pair has its own characteristic.
By changing the parameters you can enter Fibonacci levels that you prefer, I use 0.5/1.0/1.5 which equals 50/100/150 .
NO-REPAINT unlike other similar indicators Hot Range does not redraw level lines, I use a simple strategy, when the 1.5 level is reach

This market worker robot, made by experts who are experts in the field of forex trading. Experienced in trading, and made thousands of percent profit during his career.
market worker robots are created for you, as assistants who will work to generate profits in the forex market. 24 hours non-stop.
The strategy embedded in it is based on the MA indicator to open buy or sell positions. Equipped with TP, SL, Trailing Stop settings, multiplier, working hours, and complete MA indicator settings

This indicator takes input from the RSI and a trend filter, and presents the output in a separate indicator window as a histogram. Great for scalping. Settings: TrendPeriod RSIPeriod Features Alerts. How to use: Simply attach to any chart Zoom chart in to get a better view of the histo color. Buy: Blue histo color on multiple timeframes. (e.g,. M30-H1-H4) Sell: Red histo color across on multiple timeframes.
Or backtest and use as you see fit for your strategy. Best results on Major Pairs, bu
Big movement indicator is a very simple indicator which draws a pattern of boxes where price has moved significantly on a particular timeframe. It also displays the number of candles the strong movement is continuing till now. This indicator work based on zig zag indicator when there is a minimum gap between the last 2 zigzag values we draw a box around this. We can also capture the point where it meet the criteria as buffer values

With the help of the Impulses Enter forex indicator algorithm, you can quickly understand what kind of trend is currently developing in the market. The Elephant indicator accompanies long trends, can be used without restrictions on instruments or timeframes. With this indicator, you can try to predict future values. But the main use of the indicator is to generate buy and sell signals. The indicator tracks the market trend, ignoring sharp market fluctuations and noises around the average price.

The Trend PT indicator tracks market trends, ignoring sharp fluctuations and market noise. The indicator can work both for entry points and as a filter.
The Trend PT indicator displays information in a visual way. It will help in finding entry points in the analysis. Suitable for trading on low timeframes because it ignores sudden price spikes or corrections in price action by reducing market noise around the average price.

Only 7 copies of the EA left at $599! Next price --> $699 Live signal: https://www.mql5.com/en/signals/1866411 [Version MT5: https://www.mql5.com/en/market/product/94028 ] MSC ProMax EA it is a fully automated “pullback” trading system, which is especially effective in trading on popular “pullback” currency pairs: AUDCAD, AUDNZD, NZDCAD. The system uses the main patterns of the Forex market in trading – the return of the price after a sharp movement in any direction. Recommend currency pa

We publish the indicator as a useful tool in trading and call this indicator the "Swiss Army Knife" because it provides many possibilities and combinations to help understand the material on the "Masters of Risk" trading system. The indicator itself is not part of the tools used in the "Masters of Risk" trading system.
The indicator consists of 3 separate multi-timeframe indicators, which in combination with each other help to reduce the "noise" of false signals. The first of the indicators ar

This indicator takes input from the RSI and a trend filter, and presents the output in a separate indicator window as a histogram. Great for scalping. Settings: No need to set up the indicator. Features Alerts. How to use: Simply attach to any chart Zoom chart in to get a better view of the histo color. Buy: Blue histo color on multiple timeframes. (e.g,. M30-H1-H4) Sell: Red histo color across on multiple timeframes.
Or backtest and use as you see fit for your strategy. Best results on Majo
MetaTraderマーケットは、他に類のない自動売買ロボットやテクニカル指標の販売場所です。
MQL5.community ユーザーメモを読んで、取引シグナルのコピー、フリーランサーによるカスタムアプリの開発、支払いシステムを経由した自動支払い、MQL5Cloud Networkなど、当社がトレーダーに対して提供するユニークなサービスについて詳しくご覧ください。
取引の機会を逃しています。
- 無料取引アプリ
- 8千を超えるシグナルをコピー
- 金融ニュースで金融マーケットを探索
新規登録
ログイン