YouTubeにあるマーケットチュートリアルビデオをご覧ください
ロボットや指標を購入する
仮想ホスティングで
EAを実行
EAを実行
ロボットや指標を購入前にテストする
マーケットで収入を得る
販売のためにプロダクトをプレゼンテーションする方法
MetaTrader 4のための有料のエキスパートアドバイザーとインディケータ - 134

SETTINGS ORDERS COMMENT SHOW PANEL
FIXED LOT MONEY MANAGEMENT MAS SPREAD
TAKE PROFIT STOP LOSS
CLOSE MIDLE LINE INVERT ORDERS TIME FRAME( CURRENT) PERIOD
APPLIED PRICE ( CLOSE PRICE ) ATR PERIOD
ATR MULTIPLIER MAX HISTORY BARS ACTIVE TRAILING
TRAILING INIT
TRAILING START
TRAILING STEP
USE MART ( TRU FALSE) ORDERS DISTANCE
TAKE PROFIT
LOT MULTIPLIER
LOT INCREASE MAX ORDERS NUMBER LOT INCREMENT TYPE
LOT REPETITION START HOUR
END HOUR


This is a trading robot to work mainly on the EURUSD pair, with H1 timeframe . It uses a robust strategy that combines the strength of the Bears Power, Force Index and Envelopes indicators through a scalping system that will give you excellent results. Backtest now! Special OFFER for this week Discount price - $ 49. Next price $ 149. BUY NOW!!! Are you tired of trading systems that work only in backtesting? Would you like an EA that works well on live accounts? Collect fortunes with t
THE SCALPER SIGNALS BUY AND SELL ENTRIES / REENTRIES , BASED ON THE PRICE ACTION OF BARS
IT HAS MULTIPLE MODES AS SELECTED , Which will provide different price action signals . The Signals are further filtered using Higher Time Frame Trend Analysis. For Example - (1) The Signals Of reversal points entries of the Higher Time frame can are plotted over any lower time frame , Giving robust signals (2) The Signal Of Lower time Frame - plotted only when the higher time frame is also in th

! register Interactive Broker https://ibkr.com/referral/zhenwei375
こんいちは、Youtubeチャンネル登録してなら、嬉しいです!
# youtube https://www.youtube.com/channel/UC4fZRTNdAcHJMDm71MyMkew?sub_confirmation=1
! First Backtest By Your Self
Broker: ICMarkets Raw Spread Account
Works On D1 TimeFrame
# Pairs ------------
EURUSD
US500
JP225
USTEC
US2000
SE30
STOXX50 CA60
HK50
# Current Working On - Signal Services - 日本 株/ 米国株スキャンナー If you want signal serices email me aizwellenstan@gmail.com a

The indicator of tick volumes Better Volume MT4 allows you to assess the general mood of the market and quite accurately catch the moments of the formation of large movements. The indicator is a color arrows on chart window. In the calculation of Better Volume MT4 the Price Action combinations are taken into account, the values of the volumes with the height of columns and color marking are displayed. Input parameters: MAPeriod - period for calculating the moving average for volume; Right_Valu

Balanced Costing - shows signals - can be used with an optimal risk factor. The indicator can be used both for pipsing on small periods and for long-term trading. The Balanced Costing trend indicator uses reliable algorithms in its calculations. Shows favorable moments for entering the market with arrows, that is, using the indicator is quite simple.
Works on all currency pairs and on all timeframes. Of course, the approach to trading should be complex and in order to make a decision, you sho

Индикатор Adapter определяет господствующую тенденцию, помогает анализировать рынок на выбранном временном интервале. Прост в настройке и работает на всех парах и всех временных интервалах.
Индикаторы тренда дают возможность классифицировать направление ценового движения, определив его силу. Решение этой проблемы помогает инвесторам вовремя войти в рынок и получить хорошую отдачу. Для любого трейдера крайне важно правильно определить направление и силу трендового движения. К сожалению, единст

The Direction Arrows indicator tracks the market trend while ignoring the sharp market fluctuations and noise around the average price. The indicator implements a kind of technical analysis based on the idea that the market is cyclical in nature. It catches the trend and shows favorable moments of entering the market with arrows. The indicator can be used both for pipsing on small periods and for long-term trading.

The key difference between the Real Channel indicator and other channel indicators (for example, from the same Bollinger) is that the Real Channel takes into account not simple moving averages, but twice smoothed ones, which, on the one hand, makes it possible to more clearly determine the market movement, and on the other hand makes the indicator less sensitive. Real Channel is a non-redrawing channel indicator based on moving averages.

You can download Dynamic Pulse for free and test the bot in this way by yourself convincing of its capabilities. The bot can be tested on different currency pairs and different periods. The main thing is to set the tester settings as shown in the screenshot for correct testing. You need to trade on timeframes M1-M15. The Expert Advisor is designed for trading on any instrument. It is preferable to test the EA with a broker with five-digit quotes, or even better on the MetaQuotes-Demo server. It

The Search for Reversal trend indicator can be used both for pipsing on small periods and for long-term trading. Indicator showing signals for entry. Displays both entry points and the trend itself. Shows statistically calculated times to enter the market with arrows. Using the indicator, you can optimally distribute the risk coefficient.
Uses all one parameter for settings. When choosing a parameter, it is necessary to visually resemble so that the corresponding graph has an excellent projec

Andromeda 2021 is a high profit algorithm with more than 160% profitable trades in 9 months historical backtest (initial deposit 1000 USD). It usually opens multiple trades per week and closes them mostly within 1-3 days. Andromeda 2021 is combination of EMA, Grid and Martingale algorithm. If you do not like Martingale algorithm, you can change the value of Martingale to 1. Recommended Broker : www.icmarkets.com
Trades The Group of Trade has a fixed Take Profit about 10 pips or 100 dollars a

Arrow indicator without redrawing and delay The indicator shows the best trend entry points on the chart. It is better to use it in conjunction with other trend indicators as a filter. The indicator shows good results on lower timeframes. The signal is generated inside the candle and appears as blue and red arrows. Displays signals at the zero bar
Settings
Step : Calculation of bars in history
Bar : Shows bars in history
Delta : Offset of the signal from the candle

Trade Zone SupDem - индикатор служит для определения зон спроса/предложения. В возможности входят такие функции, как отображение зон уже пробитых, зон к которым цена еще не доходила с момента определения, и подтвержденным, к которым цена уже доходила, но не пересекала полностью. Сами зоны можно определять, как с текущего таймфрейма, так и со старшего. Важно помнить, что если необходимо отображения зон с нескольких таймфреймов, то придется прикреплять к графику несколько копий индикатора, и при э

エキスパートは2つの移動平均に基づいており、1つはオープニングオーダーに使用され、もう1つはクロージングに使用されます。それぞれに個別の設定があります。
「ツイスト」は、注文をクローズするために従来の条件が使用されていないという事実に由来します。クローズ信号が表示された場合、EAは最初またはいくつかのクローズ条件をスキップする機能を備えているため、利益が増加する可能性が高くなります。エキスパートには、最大10ステップの組み込みリカバリモードもあります。このモードでは、潜在的な損失が発生するたびにロットサイズを増減でき、すべてを構成および最適化できます。リカバリは、ユーザーが有効または無効にすることもできます。
デフォルト設定はEur / Usd H1時間枠用に作成されています。追加の設定は、「コメント」セクションの最初のコメントにあります。
Auto_Lot機能の使用-アカウントの残高が最初のアカウントの残高(エキスパートが最初に開始したときに使用)よりも小さい場合、ロットサイズは縮小されません。ロットサイズ計算(自動ロットモード)をリセットし、新しい、より小さなバランス

is a manual tradepanel for the forex market combined with a traderobot which can be switched on and off to open trades based on tradesignals of integrated indicators.
The Signalarea consists of 3 EMA´s, PSAR, Bollinger Bands, MACD, Stochastic, RSI and Gann Hi Lo Indicator.
All indicators can be freely combined on the current chart and two additional adjustable timeframes
to generate the tradingsignals.
All indicators are integrated except the Gann Hi Lo which represents the signalline.
Th
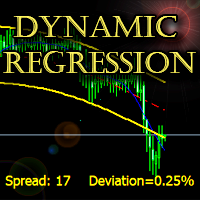
The indicator builds a dynamic regression channel with high accuracy without lagging.
Channel deviation is calculated using a unique formula and displayed on the graph.
Support: https://www.mql5.com/en/channels/TrendHunter
Can be used on any timeframe and any instrument. MT5-version: https://www.mql5.com/en/market/product/64257 Can be used as a ready-made trading system, as well as an addition to the existing one.
Settings: Fast Period - Fast smoothing period; Slow Period - Slow smoo

The Gladiator is my another fully automatic Expert Advisor for the trading on GBPJPY . The Gladiator has been tested from year 2003 to March 2021 on GBPJPY H1. You can download the demo and test it yourself. My test used the real tick data with 99,90% accuracy. Monte Carlo test with 200 simulations used too. All trades are covers by TakeProfit and StopLoss ! Doesn't use Martingale or other dangerous startegies.
This Expert Advisor using fixed lot size, which you can set in settings.
Result

GT_Volume - это универсальный индикатор подходящий для всех валютных пар. Показывает текущий объем на горизонтальных уровнях. Объемы рисуются по мере движения цены. Все просто и нет ни чего лишнего. Индикатор очень помогает быстро определить сильные уровни сопротивления и поддержки, работает шустро! Есть возможность поменять цвет и выбрать день на котором отображать объемы.

Automatic trading system. It includes three very strict algorithms for finding a reversal on large timeframes. It is installed on any timeframe, but for the quality indicators of the visual panel, it is better to set it to H4, you can set it to H1. Optimized for the USDZAR currency pair.
In addition to the usual settings, it is possible to limit trading by day. If the days 1-31 are set, the EA will trade every day.
The Expert Advisor trades by itself, but it is more profitable to use it as
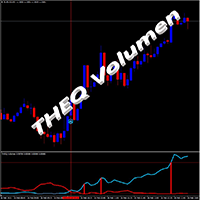
THEQ Volumeは、正確なボリュームオシレーターを表示します。次のトレンドまたは起こりうるトレンド変化を取引するために使用できます。 THEQ Volumeには、THEQ Volume Arrows、シグナルとアラートを備えたインジケーター、および実際の/デモ、バックテストと最適化、または独自の戦略を作成するためのTHEQ VolumeEAも含まれています。 追加のインジケーターとロボットEAは、支払い後に別々に出荷されます。 THEQボリュームは再描画せず、ラグがなく、キャンドルが閉じても信号が消えることはありません。 また、準備が整い、市場に迅速に参入するための事前シグナルもあります。 マニュアルと最適な設定インジケーターとEAを使用して、必要なときにいつでもサポートとヘルプを利用できます。新しいバージョンは常に最初の支払いに含まれています。 チップ: -EURUSDペアとM5TFの過去5年間を最も正確な方法(ティック)でバックテストして、購入したものがスクリーンショットやビデオと同じであることを確認します。 -EAが履歴データを読み取らないことを確認します。 -デモアカウン

Oakbot Grid Trading Series14 is a safe and high profit algorithm with more than 100% profitable trades in 5 months historical backtest. It usually opens multiple trades per week and closes them mostly within 1-3 days. NO m artingale in this algorithm Recommended Broker : www.icmarkets.com
Trades The Group of Trade has a fixed Take Profit about 10 pips or 5 0 dollars and Stop Loss set from the beginning. Although the values can be changed, it is recommended to keep the default values to get t

VR Pivot - これは、主要なピボットポイント(pivot)の指標です。 ピボットポイントは、最強の価格帯を識別するために使用される特別なタイプのサポートレベル(support)と抵抗(resistance)です。プロのトレーダーは、価格の反転の高い確率がある価格を決定するために逆転のポイントを使用します.レベルは、特別な数式に従って計算され、終了、開口部、最大、前の期間の最小値の価格が考慮されます。最も効果的なのは、毎日の期間です。一見すると、これらのレベルに特別なものは何もないと思われるかもしれませんが、ピボットポイントのレベルの助けを借りて価格の動きを分析すると、ほとんどの場合、これらのレベルが良好で正確な結果を示していることがわかります。 テクニカルサポート、設定およびソフトウェアの体験版は、作者のプロファイルによりリクエスト できます。 逆転ポイントは、ピボットポイントとしてだけでなく、最大利益のために可能な限り効率的に使用できるレベルとして使用することができます, 損失を最小限に抑えるために損失を停止, リスクを軽減するために、損失ゾーンにポジションを転送. インジケ

このEAは、完全にカスタマイズ可能なバーの範囲を取り、その後、範囲外で売買します。ダックスは、その高いボラティリティとメガブレイクアウトで知られています。ユーザーは、取引を保護するために、プラットフォームが損益分岐点にロックするポイントを設定できます。定義されたストップロスとテイクプロフィットで、このEAは実際にそれらの動きをキャプチャします。他のインデックスや外国為替で使用できますが、私はそれらをテストしていません。Daxは私がこのEAを使用するメインのインデックスです。 パラメータの機能を理解しやすくするために簡略化されています。 含まれるパラメーターは次のとおりです。 --SR_Shift =範囲を作成するには、現在のバーを使用できないため、左にxバーの量だけシフトして、範囲のカウントを開始できます。 --SR_BAR RANGE =範囲内の合計バーを指定します。たとえば、SRシフトが1に設定され、SRバー範囲が5に設定されている場合、形成中の現在のバーから合計5バー離れてカウントされ、青いサポートと抵抗が作成されます。その特定の範囲のバー。 -SLポイント=ストップロス -T
Fundamental Signals Indicator is a Non-Repaint Indicator with a powerful calculation engine that can predict market movement over 3000 pips (30000 points). The indicator does not analyze the market fundamentally, it is named fundamental because it can predict trends with large movements, no complicated inputs and low risk. Also Indicator can alert on market trend changes.
Using Indicator :
The Indicator is very simple and without complicated input parameters. (No need to optimize anythin

Indicator for working with a Trend. Trend is your friend! The digital indicator helps to find the optimal points of entry into the market, to stay in the trend as much as possible. If the trend and direction change, exit the position in time. The indicator is recommended for use on timeframes H4 and higher. Works on any trading instrument. The indicator menu contains options for fine tuning the signals and color gamut. Happy trading!
A dealer with simple logic of opening orders and reliable closing control for advanced.
The input signal is determined by only one indicator.
Closing occurs on target profit.
When drawdring first orders, the following appears.
Maximum number of orders - no more than three in each direction.
Settings for configuration:
----------- Trade Settings ----------- Quantity Lot 1 - the size of the first transaction Quantity Lot 2 - the size of the second transaction in the series Quantit

VICTORY-FX 5 copy of 20 left at this price Next 10 copies $499, then $1299. THE VICTORY-FX is a fully automatic Scalping Expert Advisor based on the banks servers data and the market price action manipulation.
95% of investors often blame market manipulation as the primary reason for their lack of success, which is RIGHT. The main market players are the largest banks in the world, and they form the exclusive club in which most trading activities take place. This club is known as the inter

The Secret Channel is an extended version of the Bolinger Bands. For those who use konals when trading. For this indicator to work, a moving average with a MAPeriod period is taken - the number of bars for analysis. As a result, two channels will be built, one shows the limit of the price in 70% of the time for the selected number of bars, the other shows the limits of the price 90% of the time for the selected number of bars. The channel calculates the limits within which any indicator or price
The indicator works on the principle of drawing buy and sell arrows, based on the signals of the built-in algorithm. The indicator definitely needs a flat filter. This indicator will take trading to a new level. Works on all timeframes and currency pairs. It is advisable to use the indicator in conjunction with other tools for more reliable signals and making a more balanced decision.

This FX indicator shows exactly when you need to buy or sell a position and is based on moving average indicator (golden cross and dead cross). If a golden cross or dead cross is detected, arrows will appear and an alert will sound. If you see the up arrow , the price will go up . When there appear down arrow , the price will go down . So you can decide easily buy or sell based on the information which you can gain from moving average! You can adjust the period in parameter settings. Default nu

The indicator works on the principle of the difference between two oscillators. You can set the periods for the fast and slow oscillator, as well as the position relative to the given level. This indicator will take your trading to a whole new level.
Settings: FastPeriod - fast oscillator period. SlowPeriod - the period of the slow oscillator. LevelSignal - signal level. Index - the bar from which to take data, 0 - the current bar, 1 - the previous one.
The indicator works on all timeframes

Traders Toolbox Premium はオールインワンツールです
それらの戦略と計算を自動化するために、一般的な取引戦略に関する広範なトレーニングに基づいて作成されました。 (Jason Kisoglooによって設計およびプログラムされました) 特徴: 19個々の信号 -これらの信号の それぞれ は、ニューラルネットワークスタイルの構成でバイアスされ、最終的な/全体的な結果を構成します。 各信号には独自の設定が あり 、必要に応じてカスタマイズまたは最適化できます。 包括的なオン - 画面 - ディスプレイ -包括的な情報とツールチップを備えた6つのスナップアウェイパネル。 (パネルの境界線をクリックして、折りたたんだり、離したりします...設定は機器ごとに自動的に保存されます): 信号パネル -バイアス情報と信号の詳細を含む信号分析を表示します。 ニュースパネル -アップ、さらにはニュース来 トン の に基づいて 予測 の イベントへのカウントダウンと現在の機器に影響を。 (内部M T5 エコノミ

Automatically closes orders when profit per lot or total profit reaches your specified level Per a lot : The amount of wins per lot in the selected symbol. Each orders is calculated as 1 lot. Example: If EURUSD total lot is 2.05 and earnings per lot is $ 100, then 100 * 2.05 = 205 $.
Orders will be closed when EURUSD has a total profit of $ 205. When the total of all orders on the selected symbol reaches the specified amount, it closes all orders belonging to the symbol.
For example: There are

The EA's strategy is based on the price movement from the support line to the resistance line, as implemented in the indicator: https://www.mql5.com/en/market/product/27135 Each position has a stop loss and take profit. BONUS: I will provide all buyers with an absolutely free trading expert for working with gold: https://www.mql5.com/ru/market/product/61919 To get it, after the purchase, write me a Private message, please. The EA does not use a grid and martingale system. Support: https://www

>>>>>>>>>>>>>>>>>>>> 60 % discount ( 150 USD >>> 89 USD) , special for10 buyers ( 2 left) <<<<<<<<<<<<<<<<<<< EA GOD is an expert advisor specializing on EUR/USD to maximize profit by 10-20% per month. Martingale is a strategy of EA GOD which NEVER Margin Call for 5 years backtest 99.9% accuracy with tick data suite. Minimum Deposit: $180 Profit: 10-20% per month Strategy: Martingale Time frame : M1 Backtest: 99.9% accuracy with tick data suite Setting Start Lots: Start lot Step: Dist

️️️️️ Mr Fibonacci Robot Mix Ichimoku And ADX ️️️️️ Best time frame M5 .
Change Lot Size to 0.01 for Martingale Mode.
Manual PDF of Robot
Buy "Mr Fibonacci Robot " at 325$ and receive 1 indicator for free (* for ONE trade accounts)
THIS IS GIFT : https://www.mql5.com/en/market/product/71392
This Is a a full feature pro version - You can enjoy free version HERE ️️️️️ Dear friends who bought our robot, please update to the new version. ️️️️️

スパイダーインベスト
EAスキャルパーとヘッジ
このEAデータベースには、次のカテゴリの予測が含まれています。
世界の金融機関、銀行、ウェブサイト、格付け機関。
このEaは通貨とXAUUSDの取引のために開発されました
*推奨時間枠:5M。
*推奨:RSIMAXFXCORE90、RSIMINFXCORE20。
*スキャルピングとヘッジを使用します。
*デフォルト設定は、ブローカーが0.01ロットをインデックスと通貨と交換するのに適した設定です。
*最低入金額は200米ドルです。
*最小推奨残高1000米ドル。
*注:この製品で得られる結果は、以下に関連して異なる場合があります。
1.ユーザーが操作するブローカー
2.レバレッジレベル
3.各ユーザーのリスクレベル
4.構成は、ブローカーごと、ユーザーごとに調整する必要があります。
実際のアカウントを使用する前に、まずデモアカウントでテストすることをお勧めします。

Most often, a good trend is visible on a price chart visually. But an experienced trader should clearly understand the current balance of power in the market before entering. The Trend Regulator indicator will help the trader to make decisions by helping him with the appropriate signals. The intelligent algorithm of the Trend Regulator indicator shows the points of potential market reversal. A strategy for trading with the trend, filtering market noise and all the necessary features built into o

Schrodinger Channel is a non-redrawing channel indicator based on moving averages, it takes into account not simple moving averages, but twice smoothed ones, which, on the one hand, makes it possible to more clearly determine the market movement, and on the other hand, makes the indicator less sensitive. Signals are not redrawn and can be used immediately after they appear. This means that there is no need to wait for a new confirming bar. The lower and upper bands are used as support / resista

The Trend Goblin indicator identifies the mainstream trend. They help to analyze the market on a selected time frame. Easy to set up and works on all pairs and all time frames. Trend indicators provide an opportunity to classify the direction of price movement by determining its strength. Solving this problem helps investors enter the market on time and get good returns.
It is extremely important for any trader to correctly determine the direction and strength of the trend movement. Unfortuna

The Arrows Forecasters indicator is simple, visual and effective trend detection. The intelligent algorithm of the indicator determines the trend with a good probability. Uses just one parameter for settings. The indicator shows the points of potential market reversal. Ready-made trading system.
The indicator does not redraw and does not lag. Works on all currency pairs and on all timeframes. You should remember that using a combination of forecasting tools, it is advisable to choose 2-3 indi

Active Channel is a non-redrawing channel indicator based on moving averages. The key difference between the Active Channel indicator and other channel indicators (for example, from the same Bollinger) is that the Active Channel takes into account not simple moving averages, but twice smoothed ones, which, on the one hand, makes it possible to more clearly determine the market movement, and on the other hand makes the indicator less sensitive.
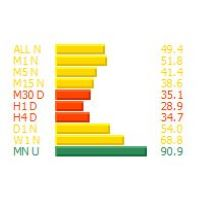
This MT4 indicator, Rsi Visual MTF, summarize the oscillator values in color graphic in current market emotion stage which will show you in multi timeframes (9) and sum of the total Rsi oscillator values which is an important information for traders especially you can see all oscillator values in visualized graphic easily, Hope it will be helpful tool for you for making a good decision in trading.

The Point Transition trend indicator is based on price divergence. If you do not have your own trading strategy yet, you can use our ready-made trading strategy. The indicator will help in finding entry points when analyzing the price chart. The indicator displays information in a visual form. Has one Length parameter. It can be used as a filter in trading. The indicator can work both for entry points and as a filter. Do not forget that the approach to trading must be complex, additional informa

My Expert Advisor trade Bitcoin on M30 time frame, Base on Bollinger Bands indicator, stop loss 25 usd/0.01 bitcoin take profit 17 usd/0.01 bitcoin (0.01 lot) Totally, my EA win 89% and loss 11%. Min deposit: from 200 usd Recommended deposit: 400 usd Broker 5 digit, stop loss = 250000, take profit: 170000; Profit: 25%-35%/month. Draw Down: < 35% Input Setting to test my EA: - Lots: 0.01 - Stoploss: 25 usd/0.01 bitcoin or 2500 usd/bitcoin depend on your broker and your account ( adjust to

This MT4 indicator, Stochastic Visual MTF, summarize the oscillator values in color graphic for both Main and Signal in current market emotion stage which will show you in multi timeframes (9) and sum of the total Main and Signal oscillator values which is an important information for traders especially you can see all oscillator values in visualized graphic easily, You can add more by Shift, Hope it will be helpful tool for you for making a good decision in trading.
Reborn master
The MT4 indicator finds turning points for entering trades. Works without redrawing and delays!
The indicator ideally determines the points of the beginning of a trend or correction for entering trades for currencies, crypts, metals, stocks, indices.
The first 10 sales will be with a 40% discount, then the price will be without a discount
Benefits: Signals are not redrawn! and are shown at the moment of appearance, and since the signal can appear at any time, the indica

TRENDIEST TREND LINE ️️️️️ Do you want to become a constantly profitable 5-star forex trader? ️️️️️
Trendiest Trend Line is a one of a kind trend line indicator, Trend lines work until the market reverses or consolidates. Easily stay out of the chop and stay in the long trends!
Key Features of Trendiest Trend Line Stay in strong trends longer with confidence Clearly shows you when the market is ranging to save you money Entry signals help you get in at a good price 100% reliable

The Trend Display is a nice additional Tool to identify the current trend of the pair you want to trade.
It shows you the direction of the trend in the separate charts.
That way you have a nice overview of the direction in one chart.
You do not need to swap between each time frame to identify the trend.
I wish everyone the most possible success when trading FX. Thank you for using that Indicator.

This is a trading robot to work on USDCHF - Timeframe H1 . It exploits a statistical advantage produced in the Swiss franc. All trades with SL and TP. Backtest now! Special OFFER for this week Discount price - $ 49. Next price $ 149. BUY NOW!!! Would you like to see how 100 dollars turn into more than 3 million dollars? Do you already have a robust strategy that works on USDCHF ? TC Poseidon EA is the god of the seas, water, storms, hurricanes, earthquakes, and horses. Use its power to

"Support or Resistance Alert Broken" is a simple and very intuitive tool that allows you to create or eliminate horizontal and trend supports and / or resistances with a simple click.
When the support or resistance line is broken by the closing price at the end of the current candle, the "Support or Resistance Alert Broken" tool will send an alert with sound, as well as a notification to the MT4 or MT5 mobile application. This tool can send alerts from multiple pairs at the same time. Utility

This EA implements a fully functional trading strategy designed to trade Gold (XAUUSD). The EA takes advantage of the COMEX price manipulation during the New York session, by buying dips on the Asian session and closing all exposure before the New York session begins. [ Installation Guide | Update Guide | Troubleshooting | FAQ | All Products ]
Easy to set up and supervise No indicators or hard analysis needed The strategy is timeframe-independent It blends a fundamental approach with a technic

MuskBTCUSD Work mainly on BTCUSD , in Timeframe M5 . The EA used Moving Averages Indicators. Moving Average with input parameters: : MaximumRisk = 0.02; // Maximum Risk in percentage DecreaseFactor = 3; // Descrease factor MovingPeriod = 12; // Moving Average period MovingShift = 6; // Moving Average shift
if you can not run a backtest, Please see the historical back test screenshot.
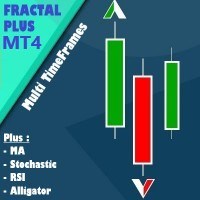
Fractal Plus is a trading tool in the form of an expert advisor. I n it there are 1 indicators that are position execution and 4 indicators that function as filters. You can choose whether each indicator is active or not, it can even be combined according to your trading needs. All filter indicators have multi timeframes options.
Indicators as execution position: 1. Fractal
4 Indicators as Filter: 1. Moving Averages 2. Stochastic Oscillator 3. RSI 4. Alligator
Parameter Information: - Lot

All In Max Volume. Buy or Sell as much as you can. This expert opens positions until you run out of free margin. Positions are opened in the order of max possible lot size down to the min possible lot size (e.g 1 lot size positions, then 0.1 lot positions, finally 0.01 lot positions). 1. Drag and drop Expert to desired chart 2. Select buy or sell in the input parameter. 3. Expert will execute and exit automatically when done.

VR Assistant Charts ートは、MetaTraderターミナルのウィンドウでグラフィックオブジェクトを扱う場合、トレーダーに軽量アシスタントです。このユーティリティを使用すると、トレンドライン、フィボナッチレベル、ガンナー、およびMetaTraderターミナルの他のグラフィックスオブジェクトの色、スタイル、厚さ、その他のプロパティを1回クリックで変更できます。 テクニカルサポート、設定およびソフトウェアの体験版は、作者のプロファイルによりリクエスト できます。 すべてのコントロールはマウスで行われます。 トレンドラインをクリックするとプロパティが開き、グラフをクリックするとグラフィックオブジェクトのプロパティが非表示になります。オブジェクトのプロパティを通じて、トレーダーは、左または右にビームを設定し、色、スタイル、幅を変更し、フィボナッチ、ガンなどのマルチレベルオブジェクトのレベルを追加および削除することができます。 グラフィックオブジェクトをクリックすると、スタイル、厚さ、色の基本プロパティがコピーされます。別のグラフィック オブジェクトを作成すると、すべてのプロパ
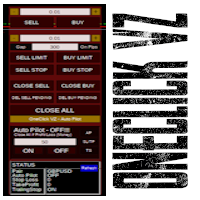
Simple button panel of trade on your chart with OneClick VZ . This trade panel will make it easier for you.
Equipped with several functions that make it very easy for you. You can try Trial Version OneClick V1 in here .
This version includes: Open Order Buy Open Order Sell Open Pending Order [Buy Limit - Buy Stop - Sell Limit-Sell Stop] Close ALL orders
Close Order Buy Close Order Sell Delete Pending Order [Buy Limit - Buy Stop - Sell Limit-Sell Stop] Order Management: Stop Loss Take Profit

「一目均衡表」の専門的な使い方は、一目均衡表を正しく解釈してグラフを分析することです! はトレーダーが価格グラフ上の指定された点間の比率を素早く簡 単に測定できるようにするグラフィックプログラムです。この時間と価格の指標は、MT4 プラットフォームの一目の戦略に従って図表を分析するための基本的なツールです。この ツールを使用すると、 非常に短期間での価格波だけでなく、時間波の洞察に満ちた完全な 分析も可能になります。分析の実行に費やされる労力は、エクセルを使用して実行される 同様の測定および計算と比較して、何度も最小限に抑えられます。指標は、一目均衡表戦 略を使用するトレーダーの知識と経験、およびそれらの期待を考慮して設計されています。 提示されたツールは私たちの仕事の結果です。 指標のモジュール構造により、論理的な順序で分析を実行できます。このプロセスは過去 の波に関するデータを収集することから始まり、それが将来の市場の動きを計算するため の基礎となります。 計算で考慮されるデータは、予測の正確さにとって非常に重要です。 この操作は最小限に抑えられ、即座に測定値が得られます。 この測
「一目均衡表」の専門的な使い方は、一目均衡表を正しく解釈してグラフを分析することです! はトレーダーが価格グラフ上の指定された点間の比率を素早く簡 単に測定できるようにするグラフィックプログラムです。この時間と価格の指標は、MT4 プラットフォームの一目の戦略に従って図表を分析するための基本的なツールです。この ツールを使用すると、 非常に短期間での価格波だけでなく、時間波の洞察に満ちた完全な 分析も可能になります。分析の実行に費やされる労力は、エクセルを使用して実行される 同様の測定および計算と比較して、何度も最小限に抑えられます。指標は、一目均衡表戦 略を使用するトレーダーの知識と経験、およびそれらの期待を考慮して設計されています。 提示されたツールは私たちの仕事の結果です。 指標のモジュール構造により、論理的な順序で分析を実行できます。このプロセスは過去 の波に関するデータを収集することから始まり、それが将来の市場の動きを計算するため の基礎となります。 計算で考慮されるデータは、予測の正確さにとって非常に重要です。 この操作は最小限に抑えられ、即座に測定値が得られます。 この測

「一目均衡表」の専門的な使い方は、一目均衡表を正しく解釈してグラフを分析することです! はトレーダーが価格グラフ上の指定された点間の比率を素早く簡 単に測定できるようにするグラフィックプログラムです。この時間と価格の指標は、MT4 プラットフォームの一目の戦略に従って図表を分析するための基本的なツールです。この ツールを使用すると、 非常に短期間での価格波だけでなく、時間波の洞察に満ちた完全な 分析も可能になります。分析の実行に費やされる労力は、エクセルを使用して実行される 同様の測定および計算と比較して、何度も最小限に抑えられます。指標は、一目均衡表戦 略を使用するトレーダーの知識と経験、およびそれらの期待を考慮して設計されています。 提示されたツールは私たちの仕事の結果です。 指標のモジュール構造により、論理的な順序で分析を実行できます。このプロセスは過去 の波に関するデータを収集することから始まり、それが将来の市場の動きを計算するため の基礎となります。 計算で考慮されるデータは、予測の正確さにとって非常に重要です。 この操作は最小限に抑えられ、即座に測定値が得られます。 この測

Draco is an automated Expert Advisor that uses the Ichimoku Kinko Hyo indicator for gauging future price momentum and determines areas of support and resistance. It also looks at two additional TF’s (M5 and M15) to triple check signals for trade management. After complex automatic analysis, it will then open and close trades based on candlestick bar ranges and top and bottom prices. The EA was created using advanced Artificial Intelligence combined with simulated walk forward designs. It c

Octans is an automated Expert Advisor that uses the combination of the Ichimoku Kinko Hyo and Commodity Channel Index indicators for opening trades and the Heiken Ashi indicator and Bollinger Bands Range to close. This is a market entry trading system with fixed Stop Loss, target Take Profit while attempting to close trades on signals. The EA was created using advanced Artificial Intelligence combined with simulated walk forward designs. Recommended pairs are in the Comment section.

「一目均衡表」の専門的な使い方は、一目均衡表を正しく解釈してグラフを分析することです! はトレーダーが価格グラフ上の指定された点間の比率を素早く簡 単に測定できるようにするグラフィックプログラムです。この時間と価格の指標は、MT4 プラットフォームの一目の戦略に従って図表を分析するための基本的なツールです。この ツールを使用すると、 非常に短期間での価格波だけでなく、時間波の洞察に満ちた完全な 分析も可能になります。分析の実行に費やされる労力は、エクセルを使用して実行される 同様の測定および計算と比較して、何度も最小限に抑えられます。指標は、一目均衡表戦 略を使用するトレーダーの知識と経験、およびそれらの期待を考慮して設計されています。 提示されたツールは私たちの仕事の結果です。 指標のモジュール構造により、論理的な順序で分析を実行できます。このプロセスは過去 の波に関するデータを収集することから始まり、それが将来の市場の動きを計算するため の基礎となります。 計算で考慮されるデータは、予測の正確さにとって非常に重要です。 この操作は最小限に抑えられ、即座に測定値が得られます。 この測
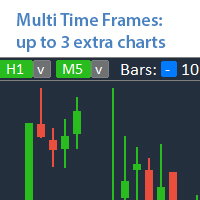
Analyze up to 3 additional charts of other timeframes , without switching the main chart. My #1 Utility : includes 65+ functions | Contact me if you have any questions The indicator opens in a separate window: The window can be moved to any place on the chart (using the [<M>] button). The window can also be minimized to save space ( [ <^>] button) In the window that appears, you can configure: The period of the 1st chart (left);
The period of the 2nd chart (center); The peri

「一目均衡表」の専門的な使い方は、一目均衡表を正しく解釈してグラフを分析することです! はトレーダーが価格グラフ上の指定された点間の比率を素早く簡 単に測定できるようにするグラフィックプログラムです。この時間と価格の指標は、MT4 プラットフォームの一目の戦略に従って図表を分析するための基本的なツールです。この ツールを使用すると、 非常に短期間での価格波だけでなく、時間波の洞察に満ちた完全な 分析も可能になります。分析の実行に費やされる労力は、エクセルを使用して実行される 同様の測定および計算と比較して、何度も最小限に抑えられます。指標は、一目均衡表戦 略を使用するトレーダーの知識と経験、およびそれらの期待を考慮して設計されています。 提示されたツールは私たちの仕事の結果です。 指標のモジュール構造により、論理的な順序で分析を実行できます。このプロセスは過去 の波に関するデータを収集することから始まり、それが将来の市場の動きを計算するため の基礎となります。 計算で考慮されるデータは、予測の正確さにとって非常に重要です。 この操作は最小限に抑えられ、即座に測定値が得られます。 この測

The indicator builds "psychological levels": levels of round numbers and intermediate levels of round numbers.
Round numbers play an important role in forming support and resistance levels. There is a pattern in which the decline or growth of the price can stop at round numbers.
The level whose price ends at 0 is the level of a round number of the first order. Intermediate level, this is the level between two round levels, for example, between 10 and 20 this is level 15.
In the " Num_Zero

A "Volume Profile" is an advanced charting indicator that displays total volume traded at every price level over a user specified time period. The main components of the volume profile are POC ( Point Of Control - the price level, at which the maximum number of contracts were executed during a selected period), VAH ( Value Area High - the highest price in the Value Area) and VAL ( Value Area Low - the lowest price in the Value Area).
When we settled on the original indicator, we spent a lot o

The script writes to a text file all-important trading information about the chart symbol including symbol leverage, point value, required margin, swaps, trade and quote sessions and so on.
Most traders need this information for their trading decisions. For example for stop loss placement, for volume calculating, for trades closing before session end... You can see a text file example on the screenshot.
MetaTraderマーケットは自動売買ロボットとテクニカル指標を販売するための最もいい場所です。
魅力的なデザインと説明を備えたMetaTraderプラットフォーム用アプリを開発するだけでいいのです。マーケットでプロダクトをパブリッシュして何百万ものMetaTraderユーザーに提供する方法をご覧ください。
取引の機会を逃しています。
- 無料取引アプリ
- 8千を超えるシグナルをコピー
- 金融ニュースで金融マーケットを探索
新規登録
ログイン