YouTubeにあるマーケットチュートリアルビデオをご覧ください
ロボットや指標を購入する
仮想ホスティングで
EAを実行
EAを実行
ロボットや指標を購入前にテストする
マーケットで収入を得る
販売のためにプロダクトをプレゼンテーションする方法
MetaTrader 4のための有料のテクニカル指標 - 34

このインジケーターは、単純な線形平滑化プロセスを実装します。
指数平滑化の欠点の 1 つは、信号が急速に減衰することです。これにより、価格帯の長期トレンドを完全に追跡することは不可能になります。線形平滑化により、信号のフィルタリングをより正確かつ細かく調整できます。
インジケーターは、パラメーターを選択して構成されます。
LP - このパラメーターを使用すると、平滑化期間を選択できます。値が大きいほど、インジケーターが表示する長期的なトレンドが多くなります。有効な値は 0 ~ 255 です。 SP - このパラメーターはインジケーターの感度に影響します。このパラメータが大きいほど、価格系列の最後の値の影響が大きくなります.このパラメータの値がゼロの場合、インジケータは LP+1 に等しい期間の単純移動平均を表示します。有効な値は 0 ~ 255 です。
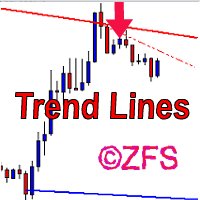
The indicator draws channels. The estimated movement of the price within the channel is shown with a dotted line. The lines of the channel are the support and resistance lines. This allows using them in both rebound and breakout trading. The inclination of the channel allows determining the direction of the current trend, the channel width and angle allow estimating the current volatility. The channels are based on fractal bars, determined using the author's original method, 4 dimensions from th
High Volatility is an utility indicator that has the task of locating volatile candles. The recognition and counting function of bullish and bearish candles make it an excellent ally to understand the market volatility. This point often defines possible reversals and moments of continuity. A rectangle is drawn on the chart to identify the candle with greater volatility in long and in short. This indicator is very effective for short, medium, and long-term trading. An alert will notify you when a

Ema Dashboard is an innovative dashboard that allows you to monitor Moving Average on multiples symbols and different timeframes. This dashboard allows you to analyze information on 28 pairs on an unique chart. Its functionality includes analysis of All Time Frames. This configuration allows you to identify the Long Term Trend with extreme ease. This panel allows you to take very important directional movements. A click on button opens a new chart (symbol and timeframe).
Graphic Object Symbol

Correct market entries and exits are essential for any Forex trader. MasterArrow indicator addresses this issue. It has no redundant elements and draws only buy/sell arrows. The up arrow is a BUY signal, while the down arrow is a SELL one. The indicator is simple to configure. Change the Strength parameter to configure the signals frequency. The product is based on standard indicators (MA, RSI, ATR, etc.). But it also features the custom algorithm allowing to combine them into a single tool and
Channel hybrid of the Moving Average, Bollinger Bands, RSI and CCI indicators. Unique filtering of signals without redrawing the indicator allows making various trades - both medium-term and short-term. The indicator operation principle lies in searching for the market reversal patterns. The trend reversal detection method uses the channel Triangular Moving Average, which plots equidistant non-redrawing channels with a Deviation period specified in the settings. Comparison of TMA and Bollinger B

Project Future is a professional arrow indicator with notification functions (alert, email, mobile). Advantages of the indicator Suitable for scalping and intraday trading. Simple and easy indicator configuration. Works on all timeframes. Does not redraw. It can be used in any financial markets: FOREX, CFD, binary options, stocks. It can be used as a stand-alone tool or in conjunction with other indicators. Sending signals to email and mobile devices.
Recommended symbols USDCAD, USDJPY, GBPUSD

Unity Basket WPR (William's Percent Range) indicator combines serveral pairs' WPR to a combined basket of your defined base currency. This gives you clear trading signals along with potential TP and SL. Use the indicator along with other indicators, like ATR, to avoid flat market situations and an indicator showing you the overall trend like an MA (50). Trade with the trend.
Settings Basket pairs - comma separated list of pairs (default: EURUSD,EURJPY,EURCHF,EURGBP,EURNZD,EURCAD,EURAUD) Period

The main purpose of the QQ-Deep Binary indicator is to determine the direction of the sail marked for Binary Options. It works for any currency pair, presenting better result in volatile instruments. The indicator is designed to simplify market analysis, and is based on price pattern detection strategies combined with multi-currency econometric velocity. The development team is constantly improving the functionality of the indicator.
Indicator Advantages No repaint. Works on all currencies. Mu

The trend scalper candles are used to identify short-term trends based on the readings of the MACD, RSI and ATR indicators. All indicator calculations are visualized by candle colors which are overlapped on the chart. The indicator uses gray , green and red colors to paint individual candles, which gives you a lot of useful and easy to read information.
Gray candles Gray candles indicate a range bound period and the information can be used to trade breakouts. Simply mark the high and low of th

TCD (Trend Convergence Divergence) is based on the standard MACD indicator with modified calculations. It displays the trend strength, its impulses and rollbacks. TCD consists of two histograms, the first one shows the main trend, while the second done displays the impulses and rollbacks. The advantages of the indicator include: trading along the trend, entering the market when impulses occur, trading based on divergence of the main trend and divergence of the rollbacks.
Input parameters Show_
The Currency Strength Index Oscillator multicurrency trend oscillator shows the interaction of the indices of the current symbol's currencies calculated on the basis of the cross-rates of Majors.
Features Calculations are based on complete bars, therefore, it does not redraw. It works on any symbols that include the Majors (AUDJPY, AUDUSD, CHFJPY, EURAUD, EURCAD, EURCHF, EURGBP, EURJPY, EURUSD, GBPAUD, GBPCAD, GBPJPY, GBPCHF, GBPUSD, NZDJPY, NZDUSD, NZDCAD, USDCAD, USDCHF, USDJPY). It works on

The indicator shows and highlights the chart candles, which are formed as a result of large players entering the market in large volumes. Such candles can also be formed after achieving a certainty on the market, when most of the participants hold positions in the same direction. The movement is likely to continue in that direction after such candles. The indicator highlights the significant candles from the existing ones on the chart; The indicator allows identifying the trends based on candles
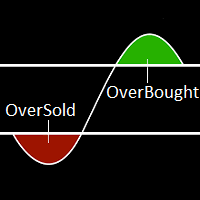
The term Overbought describes a period of time where there has been a significant and consistent upward move in price over a period of time without much pullback. The term Oversold describes a period of time where there has been a significant and consistent downward move in price over a period of time without much pullback. Because price cannot move in one direction forever, price will turn around at some point. This indicator will show a Magenta arrow in case of Overbought condition and Aqua ar
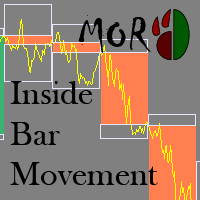
This indicator allows analyzing the movement of prices inside a bar. The indicator draws the contours of the bars of higher timeframes on the current chart.
Inputs Value TimeFrame - the timeframe to display bars NumberOfDays - the number of days the indicator calculates Bull_Body - the body color of the bullish bar Bear_Body - the body color of the bearish bar ShadowUp - the color of the upper shadow of the bar ShadowLow - the color of the lower shadow of the bar Selectable - enable/disable th
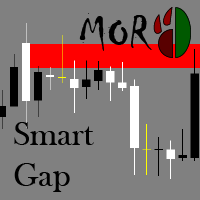
The indicator finds and visualizes price gaps, which often can be used as support and resistance levels. It can display levels from different timeframes on one chart.
Inputs Value Label - show/hide the timeframe of constructed levels TimeFrame - select timeframe to draw levels from DrawRangeDay - the length of the level in days DrawRangeHour - the length of the level in hours GapSizeForDrawing - a level will be drawn if gap is equal to or larger than this level in points CountDays - the number

The indicator identifies the trend change points. Does not redraw. Calculation is done on an active candle. Lines crossing is used as a trend change point. If the price is above the two lines, there is an uptrend. If the price is below the two lines, there is a downtrend. The indicator allows you to accurately enter the market during a trend change. It can also be used in custom strategies on a detected trend. 3 modes of notification on trend changes. Sound, arrows, sending push-notifications. I

Features: Generates BUY / SELL Signals for easy to use: You do not need to read or understand market trend lines on indicators. Quantina Bitcoin Indicator shows a little Red Arrow for SELL and a little Green Arrow for the BUY entry points above- and under - the actual bars. (Green = Bullish Trend , Red = Bearish Trend). Measured Signal Strength also has written on the chart for advanced traders. Working on every known currency pairs: It's working on major-, minor-, and cross - pairs too. Also, Q

NIZMA is a ready-made trading system, that is the most efficient on the EURUSD, AUDUSD and GBPUSD currency pairs. The best timeframes are M5 and higher. The system shows the market entry points in the form of arrows, and also displays the information on the strength and direction of the trend. The signals are easy to interpret. It is suitable for both novice and professional traders. With the properly selected settings, it gives the minimum number of false signals. In tests, this number did not

それは、より親しみやすく理解しやすい方法で買い手と売り手の量を示しています。このようにして、クマとブルのどちらが勝つかをより正確に判断できます。 私たちが事前に研究する行動のパターンがありますが、本質的に私たちは意思決定を行う際に自分自身をサポートします。さらに、すでに市場に参入している場合は、トレンドの変化が近づいているかどうかを確認できるため、トレンドの変化の前に終了します。 パラメーター 描画スタイル バイヤーボリュームカラー 売り手のボリュームカラー 幅(1〜5) この製品はMQL5.comでのみ販売されています。他のサイトでの販売は違法です。 私のすべての製品/サイン: https://www.mql5.com/en/users/mike_explosion/seller#products

The Magneto Precision Trend indicator is based on candlestick analysis. It determines the trend change on the previous candle, signal is not redrawn.
Indicator setup and use Increasing the Period parameter decreases the indicator sensitivity, resulting in less frequent changes in color but filtering the market noise. However, the trend change signals will arrive visually with a delay. And, conversely, decreasing the value of Period provides more accurate but more frequently changing signals. T

RSI Currency Strength Meter uses RSI (Relative Strength Index) to monitor how strong a currency is, or in other words, if it's being bought or sold by the majority compared to the other currencies. It displays the strength-lines of the currencies of the pair (base and counter currency of the chart) with changeable solid lines. Also, you can add up to five additional currencies to the "comparison pool". If you want to look and compare, for example, EUR, USD and JPY, it will only look at the EURUS

This indicator helps to define the dominant trend. The Blue line and Red line changes at incrementations of the trends.
Parameters ki: factor of the delay. per: Displays the indicator period. Trend: Displays the Trend movements. Trend true.(false) X: moves the trend left and right. Y: moves the trend up and down. How to understand the status: If the arrow is blue, trend is up. If the arrow is red, trend is down.

This indicator shows the crossing between two moving averages, a slower and faster moving average. Signal show alert pop-up, when MA1 crosses above the MA2. Signal show alert pop-up, when MA1 crosses below the MA2.
Inputs Value Fast MA Setup Period = 5 - period of Faster Moving Average (value 5). Mode = SMA - type of Moving Average (SMA, EMA, SMMA, LWMA). Price = Close - type of price (Close, Open, Low, High, Median, Typical, Weighted). Slow MA Setup Period = 10 - period of Slower MA (value 10

EW Oscillator PRO is an indicator for MetaTrader 4 based on mathematical calculations on the price chart. This is one of the most common and useful indicators for finding the trend reversal points. EW Oscillator PRO is equipped with multiple types of notification (push notifications, emails, alerts), which allows opening trades in time. A panel for displaying the information on the indicator signals from different timeframes is located in the top left corner (see screenshot #2).
Distinctive fe
The presented indicator uses the Laguerre filter to build a classical type oscillator, similar in its appearance and method of application to the regular MACD. At the same time, this tool is much more flexible in settings compared to the usual MACD and, thanks to the Laguerre filter, is more sensitive to price movements. Laguerre Osc allows you to choose the parameters in such a way as to be effective for almost any market or time period. Both the crossing of its zero value by the oscillator and

This indicator shows the crossing between three moving averages (slower, middle and faster ones). When fast MA crosses up middle MA and middle MA crosses up slow MA, the bullish alert is issued. When fast MA crosses down middle MA and middle MA crosses down slow MA, the bearish alert is issued. Signals to close buy positions are generated if fast MA crosses middle MA downwards, signals to close sell positions are generated if fast MA crosses middle MA upwards.
Inputs Fast MA Setup MAPeriod1 =

DYJ株式コントローラは全通貨株式取引システムである M1からMNまでの各通貨ペアのランダムな値を表示できます 1サイクルのStoch値がスーパーエリアとスーパーエリアに到達すると、色のヒントがあります これらの情報に基づいて正しい取引をすることができます
「DYJ在庫管理者」という在庫指標テンプレートを作成して保存してください。 スーパーストアまたはスーパーストアをマウスでクリックすると、対応する通貨ペアのサイクルマップが自動的に開き、Stoch指標がロードされます。 INPUT
InpPairs = "GBPUSD,EURUSD,USDJPY,USDCHF,XAUUSD,USDCAD,GBPJPY,EURJPY,EURGBP,EURAUD,EURNZD,EURCAD,CADJPY,AUDUSD,AUDNZD,AUDCAD,AUDJPY,NZDJPY,NZDUSD,NZDCAD,GBPAUD,GBPNZD,GBPCAD,CHFJPY,NZDCHF,AUDCHF,EURCHF"; InpStrategyMinTimeFrame
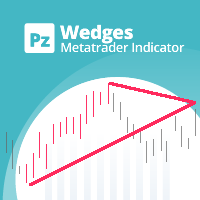
このインディケーターは ウェッジを 見つけます。 ウェッジ は、価格統合期間を囲む収束トレンドラインによって識別される継続パターンです。フォーメーションブレイクアウトと一緒にドンチャンブレイクアウトを使用してトレードを通知します。 [ インストールガイド | 更新ガイド | トラブルシューティング | よくある質問 | すべての製品 ] 使いやすい カスタマイズ可能な色とサイズ ブレイクアウト信号を実装します あらゆる種類のアラートを実装します
最適な使用法 オーバーラップする可能性があるすべてのサイズのウェッジを表示するには、異なるサイズ(6、12、18、24など)でインジケーターをチャートに数回ロードします。
入力パラメータ サイズ:検出されるパターンのサイズ。代替ポイント間のバーとして表されます ブレイクアウト期間:取引を通知するドンチャン期間
最大履歴バー:チャートで調べる過去のバーの量 強気パターンの色:このパラメーターは一目瞭然です 弱気パターンの色:このパラメーターは一目瞭然です 切れ目のないパターンの色:このパラメーターは一目瞭然です 線幅:パターン線のサイ

The indicator improves the idea implemented in the standard Bulls and Bears indicator. This indicator displays the difference between the High and Low for the current period of time and the values of the channel constructed at the maximum and minimum prices for a longer period. The growth of the indicator values above zero indicates that the High for the current period is greater than the average of the maximum prices for the period chosen as the indicator parameter. This situation in most c

This is a multi timeframe indicator to show the direction of the trend in multiple timeframes. The calculations are based on some original indicators but with special settings that is working for years and in combination with some newer indicator formulas. The indicator has multiple arrows based on various timeframe signals so that user can clearly see which signal is for which timeframe. Also draws horizontal lines with different thickness settings and colors from various latest signals so that

The Magneto Volume Trigger indicator is designed for determining the volume confirmed by the candlestick pattern and predicting the trend tendency.
Indicator setup and use The calculation of values is affected by two parameters - Period and Gate . The lower the value of Gate , the higher the sensitivity of the indicator. Period allows making a sample of data for the specified number of candles. The lower the value of Period , the more the indicator is adapted to the current market conditions.
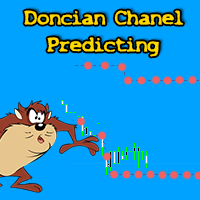
「ドンチャンチャネルの予測」インジケータを使用すると、現在の価格ポジションに基づいて、将来のドンチャンチャネルレベルの変化を予測できます。 標準のジグザグインジケーターは、反対側のドンチャンチャネルに接触すると、99%でビームを描画し始めます。 チャネル境界レベルの予測は、修正のエンドポイントまたはトレンド変化のポイントを見つけて、これらのイベントが発生する可能性のある時期を見積もるのに役立ちます。 ................................................................................................................ 設定 期間-ドンチャンチャネルを計算するための期間。推奨値は12〜240です。 ................................................................................................................
MACD MTF Signal is an indicator for understanding a trend reversal in any market . It is calculated using the MACD Histogram, which results from the difference between MACD and Signal Line. The strength of MACD MTF Signal is the ability to see more time frames at the same time if they are greater than the one displayed on the chart. In this way it is possible to understand a convergence of ascent or descent on several time frames, which means a strong push in one direction or the other. Another

The indicator identifies the most suitable moment for entering the market in terms of market volatility, when the market has the strength to move (the signal is indicated by an arrow under the candle). For each of the signals, the presence of trends on the current and higher timeframes is determined, so that the signal is in the direction of the majority of positions opened on the market (denoted near the signal by abbreviations of timeframes with a trend present). The signal appears after the c

This Indicator Shows 5 lines: Avg Buy - Average Buy price line & total size for all open long positions in your chart Avg Sell - Average Sell price line & total size for all open short positions in your chart B / E - Breakeven price line & total size for all open (long & short) positions in your chart S / L - Stop Loss price line T / P - Take Profit price line Calculation includes Commissions and Swaps Works for a specific Magic Number trades or all trades on chart All currency pairs and all cur

This is an arrow indicator for binary options. It does not redraw, arrows do not disappear. The indicator implements an optional tester for visual monitoring of the number of signal and win rate. Does not require adjustment or fitting. Works on all pairs and gold. The signal appears at the close of a candle. Entry is made on the next bar. Optional alert. For trading with robots, there is a setting for the number of bars in history. If 0, the entire history is used. The EA operation time: 24/5 Wo

ThreeVS3 is a unique and high quality indicator. It is also a effective and understandable trading tool. The operation concept is on a score basis, which is ranged from -3 to +3. Thus, you can just according to the score to do the trade easily.
How the Score calculated? The Score is calculated by 3 set of formulas. Each of them represent Long term, Short term, and entry level respectively.
How to understand the Score? The Positive sign means favor for long position, and Negative sign means f
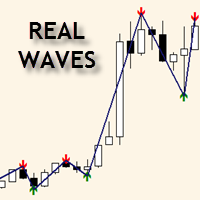
The indicator shows the real waves, based on alternating upper and lower extremums of the price chart, thus displaying the wave structure of the market. When using this indicator, there is no need to manually apply the wave markup for the current timeframe. Relevance of the extremums is determined in the process of their calculation, invalid extremums are not taken into account. Upper extremums are calculated by the bars highs, while lower ones are calculated by the bars lows. Only one bar is co

Moving band is a trend based, custom indicator which combines multiple Moving Averages and Bollinger Band .
Features Trend based Indicator Does not repaint No False Signals Works on all Time Frames Applicable on Forex, Indices and Stocks
Input Parameters Show Indicator after Testing : True/False Sound an alert : True/False Send an email : True/False Send a notification : True/False Signals The signals are generated with intersection of multiple Moving Averages with mid Bollinger Band Buy whe

MArketwave is a multicurrency, trend following indicator which combines three of the most commonly used parameters. Parameters Moving Averages Bollinger Bands Stochastic Oscillator The parameters have been customized to provide accurate signals. Signals Thick dark green up arrows - Uptrend Thin light green up arrows - Buy Thick red down arrow - Downtrend Thin red down arrow - Sell Trading tips Check the trend with thick arrows Buy or sell with thin arrows only in the direction of the main trend

This indicator displays the trend movements.
Parameters XRMultiplier: XR multiplier. Line: line movement (true/false). XRzak: XRzak movements (true/false). Arrow1: arrow movements (true/false). Arrow2: arrow movements up and down (true/false). Trend: trend movements (true/false). X: move the trend left and right. Y: move the trend up and down. How to understand the status: If the arrow is green, trend is up. If the arrow is red, trend is down.

The price is moving between two curve tunnel lines in a trend. The two lines of a tunnel represent support and resistance. In an uptrend, for instance, a trade might be entered at the support of the trend line (shown by the red line in the chart) and exited at resistance of the upper tunnel line (shown by the blue line). Tunnel show trend direction for any timeframe (if you have enough bars on the chart for higher timeframes). Trend, or price tunnel, can be up, down or sideways. If the current p
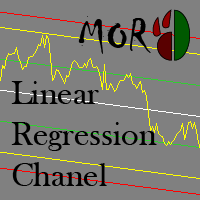
This indicator is designed for plotting the linear regression channel. For convenience, it has multiple operation modes and drawing of data from the selected timeframe.
Input parameters Price - the price to be used for calculation and plotting the upper and lower boundaries of the channel PriceHighLow - the value of bar's High and Low PriceOpenClose - the value of bar's Open and Close Mode - indicator operation mode Static - the linear regression channel is always plotted starting from BarStar

XPointer is a completely ready trading system. It shows the trader when to open and close a trade. It works on all currency pairs and all time frames. Very easy to use and does not require additional indicators for its operation. Even a beginner trader can start working with XPointer. But it will also be useful for professional traders to confirm the opening of orders.
Features of the XPointer indicator It does not redraw its values. It works on all currency pairs and all time frames. It has a

FutureForecast is one of the few indicators looking into the future, or rather calculating the current candle's High and Low price values.
Advantages of the indicator no repainting works on any timeframes works with any trading instruments perfectly suitable for scalping and trading binary options
Parameters alert - enable/disable alerts about signals. Enabled by default.
Parameters (Colors) FutureHigh - estimated High price line color. FutureLow - estimated Low price line color.
Recomme

Ichimotor is a trend based, custom indicator which combines the Ichimoku Cloud and Alligator
Features Trend based Indicator Does not repaint No False signals Works on all timeframe Applicable on Forex, Indices and Stocks
Input Parameters Show Indicator after Testing : True/False Sound an alert : True/False Send an email : True/False Send a notification : True/False
Signals The signals are generated when there is intersection of the Alligator with the Ichimoku Cloud Thick green Up arrows -

Lobster is a ready-made trading system with a flexible market analysis algorithm. It performs most of the work for a trader. All you have to do is open and close orders following the indicator signals. The indicator will be very useful for both beginners and professionals. It is able to work with other indicators and independently.
Features No signal repainting; Any pair; Any timeframe; Flexible market analysis system.
How to trade When the blue arrow appears, open a buy order; When the blue
The indicator analyzes the direction of the short- and long-term trend over the given periods taking into account market volatility. This approach allows combining high sensitivity of the indicator with a high probability of its signals.
The indicator use principle is very simple: indicator histogram above 0 is a buy signal; indicator histogram below 0 is a sell signal; The indicator is not redrawn on completed bars. This indicator is designed for trading pending orders. Thus, the confirmation
Buy Wait Sell Trigger is very easy to read and use. The one and only indicator's line (color Aqua) can be equal to a zero-line or plus/minus one-line. The zero line is characterizing the flat trend. It means that you should wait. The V-shaped impulse indicates the entrance to the opposite direction. The U-shaped impulse indicates entry orders in the same direction. If the indicator line resizes on the plus one-line, you may go Long. If the indicator line resizes on the minus one-line, you may go

Actual live calculation of the famous Renko Chart. NO NEED for offline charts.
This indicator will work on your live charts like a normal indicator would do, everything will be displayed on-screen and you will be able to customize it as much as you want.
Properties Variables Max Candles : Number of candles you want to elaborate Use "0" for all the candles in the chart Pips : Size of the renko brick I remember this indicator does not automatically calculates Digits from your broker, so you hav

MIG Scalper is very simple but powerful indicator. This is a very useful indicator, combined with a panel for fast trading will give you many satisfaction. This indicator can be used in any currency pairs and on any time frame, It fits at every speed of trading. Moreover, it's relatively easy to trade with MIG Scalper indicator. Arrows appear at the opening of a bar and do not disappear. This indicator produces two signals: BUY Signal: arrow aqua SELL Signal: arrow red
Indicator parameters MIG
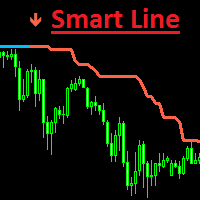
Smart Line is a trend indicator. It helps you find trend reversal points. This trading strategy is designed for trend trading. The indicator algorithm accurately determines the trend on various trading instruments, at different time intervals.
The Smart Line indicator can be used as an additional tool, or as the main one.
The color of the indicator lines changes depending on the current trend, as well as built-in indicators of possible entries in the position, indicated by arrows.
Paramet
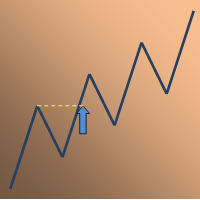
This is a functional extension of the ZigZagLW4 indicator. It detects the beginning of a new trend signaling of a new indicator line shoulder of a specified level. This is a stand-alone indicator, which means you do not need the activated ZigZagLW4 indicator for correct operation.
Algorithm logic To understand the logic of the indicator, let's take a look at the screenshots consistently displaying the conditions for the signals formation. The chart has ZigZagLW4 indicator with the Short_term a
This indicator works on any financial instruments and time periods. The indicator contains only one parameter: nBars - number of bars for histogram's value calculation. If a Green pole rises from a Red pole above the zero line then a Long position may be opened. If a Red pole rises from a Green pole under the zero line then a Short position may be opened. The height of the each pole represents the Power of an Up/Down movement. The transition from Red to Green (and vice versa) shows change of tre
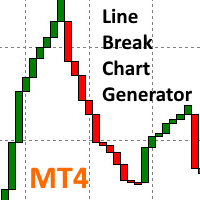
The professional line break chart generator is used to create live line break charts (i.e. 3 line break ). The chart is plotted using MT4's offline charging facility thus making it possible to trade* directly from the chart as well as attach any of the standard or custom indicators to perform technical analysis. The line break chart can be displayed as the most widely used 3 line break chart or a custom variation such as 2 or 5 line break chart . Wicks can be displayed or hidden on the chart - t
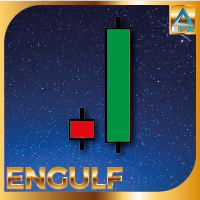
Engulfing Candle Pattern Indicator that shows a potential zone for your trades. Often used for Supply/Demand and Support/Resistance Strategies!
Indicator Properties Variables Max Candles : Number of Candles you want to elaborate Use "0" for All the candles in the chart Engulfing Size : Size of the Engulfing Candle Personally i use 2 or 3 for this setting. This setting is based on the size of the engulfing candle, more specifically, shows only engulfing that are bigger X times of the smaller ca
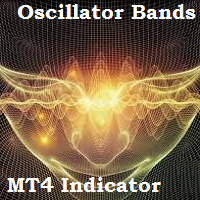
As all momentum indicators this oscillator is measuring the speed and change of price movement. Momentum indicator is using an overbought and oversold conditions. The SmoothingOscillatorBands indicator is using a curve bands to show those conditions instead of constant levels. If the Yellow line is over a Blue line then we have an Overbought condition and when the Yellow line start to break out below the Blue line then we have a good opportunity to go Short. If the Yellow line is under a Red lin

The Percent Pivot indicator is a simple indicator that calculates the main percentage values. The graphical layout makes it very similar to the traditional pivot but its internal computing system is unique and irreplaceable. Every day, the market creates new bullish or bearish rates. This indicator help you to identify possible supports or resistance levels. The main values such as 0.25% and 0.50% are good reference points to use as potential target or reversal levels. This indicator has been de

The Market Maker indicator focuses on key levels as minimum, maximum, opening and closing of important time frames. An attentive observation of these levels will enable you to identify the proper direction of the trend. On these levels the Market Makers try to make a very hunt of Stop Loss. We recommend to use Daily values on H1 chart, Weekly values on H4 chart and Monthly values on D1 charts. Use it setting all three time frames on the same chart and you will see that these levels will be a gre

Gets is a smart trading system with complex market analysis mechanism. The operation principle of Gets is based on neural networks and diversified collection of information from various market analyzers. Then the system analyzes the statistical databases to create a general idea of the current market situation and the further price movement. The information is displayed on the screen in a simple and intuitive way - in the form of buy and sell arrows. Also, the information on the current trend st

This indicator shows the trend based on two configurable moving averages. A custom calculation shows market volatility in the lower frame. Higher bars mean higher volatility. The chart also shows suggestions for buy, sell or close with the help of arrows. It is possible to set minimum volatility for entry points and to set time filtered alerts. This indicator is useful to judge trends or market volatility, for example to catch good periods for scalping.
Parameters Volatility Period - volatilit
Activity Meter is designed to identify the activity of sellers or buyers, to detect the current trend, and to search for extrema, where the price may reverse and the current trend may be replaced by the opposite one. The indicator works with any symbol provided that you have sufficient history data for a timeframe the indicator is launched at. It is recommended to launch Activity Meter on M1, М5, М15.
Alerts Alerts are activated when the indicator histogram crosses the dynamic level upwards fo

NostradamusMT4 is a powerful indicator from the set of professional trader. The indicator is based on Andrei Spiridonov's original price calculation method (ESTIMATED PRICE) for the current candle price.
Advantages The indicator does not redraw. It works on any timeframes. Works with any trading instruments. Perfectly suitable for scalping and trading binary options.
Parameters Color - color of the ESTIMATED PRICE FUTURE line.
How to work with the indicator The indicator forms the ESTIMATE
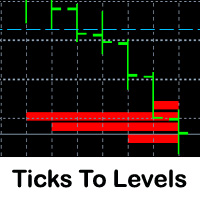
This indicator counts ticks and graphically displays the price levels, on which the greatest number of them was detected. Thus, it sufficiently accurately determines the levels of support and resistance. The indicator will be useful for traders who trade breakout or scalping strategies.
Features Technical analysis provides several ways for finding levels of support and resistance. Ticks to Levels provides another, fairly accurate, way of determining these levels empirically. The criterion for
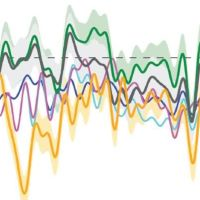
MA collection - мультитаймфреймовый индикатор, вобравший в себя множество разработок в сфере усреднения ценового ряда. Включает свыше 20-ти разновидностей индикаторов усреднения и более 10-ти единиц ценовых данных к которым может быть применено усреднение. В индикаторе предусмотрена цветовая и звуковая индикация смены тенденции. Методы усреднения: Simple Moving Average Exponential Moving Average Wilder Exponential Moving Average Linear Weighted Moving Average Sine Weighted Moving Average Triang

This is an indicator of "round levels" with a trading system module based on market scenarios near psychologically significant "market prices". Visualizing the SL/TP levels and modeling deals when they interact with OHLC prices, the module collects statistics for the specified period and plots the "profitability curve" on its basis, which allows controlling the expected profitability of trading signals.
Trading system The algorithm is based on the trading system The Elementary, Watson! ( EW )

The Shooting Stars indicator is designed to search for the Shooting Star and Hanging Man patterns on charts of any currency pairs.
Features Displays 5 unidirectional candles. This indicator identifies the Shooting Star and Hanging Man patterns. Once a pattern is identified, the indicator shows a confirmation signal. It is possible to disable the alert and unnecessary graphical elements. It is also possible to adjust the number of bars in history, where the graphical elements of the indicator a

Market Profile helps the trader to identify the behavior if major market players and define zones of their interest. The key feature is the clear graphical display of the range of price action, in which 70% of the trades were performed. Understanding of the location of volume accumulation areas can help traders increase the probability of success. The tool can be used as an independent system as well as in combination with other indicators and trading systems. this indicator is designed to suit
The indicator shows the exact price position in the current market on any symbol. It shows the trend direction on the current chart as well as on the two subsequent higher timeframes at the same time (from top to bottom). For example, you can observe the trend direction on M5 and M15 without leaving the M1 chart. The indicator switches all trend depending on the market conditions preventing you from entering against a trend or allowing you to exit a position in a timely manner. The indicator is
MetaTraderマーケットが取引戦略とテクニカル指標を販売するための最適な場所である理由をご存じですか?宣伝もソフトウェア保護も必要なく、支払いのトラブルもないことです。これらはすべて、MetaTraderマーケットで提供されます。
取引の機会を逃しています。
- 無料取引アプリ
- 8千を超えるシグナルをコピー
- 金融ニュースで金融マーケットを探索
新規登録
ログイン