メリルパターン
Alexander Fedosov | 8 10月, 2019
内容
はじめに
価格パターンのシステムを作成する最初の試みは、1971年にロバート・レビーによって行われました。レビーは5点を持つ価格変動パターンを適用し、それらに有意性があるかどうかを確認しました。レビーが顕著な結果を達成することはありませんでしたが、10年後にアーサー・メリルがその研究を続けました。
メリルはパターンをMとWの文字に似た2つのカテゴリに分けました。各カテゴリには、16個のパターンと独自のサブカテゴリが含まれています。メリルは以下の6つのサブカテゴリを強調しました。
- 上昇トレンド
- 下降トレンド
- 三角形
- 拡張
- ヘッドアンドショルダー
- ヘッドアンドショルダーズボトム
本稿では、テスト用のアプリケーションを使用して、メリルパターンの現在の関連性を定義します。さらに、このモデルをさまざまなタイプのデータ(終値、高値、安値、オシレータなど)に適用することは興味深いでしょう。
定義と適用
メリルパターンをどのように、またどのデータに適用するのかを明確にするために、それらが実際に何であるかを理解する必要があります。主な2つのカテゴリは、文字MとWに似たパターンです。これらはMパターンとWパターンと呼ばれます。各カテゴリには16個のパターンが含まれています。
図1は16個のMパターンを表します。ご覧のように、違いはパターンを構成する5つの点の相互配置にあります。
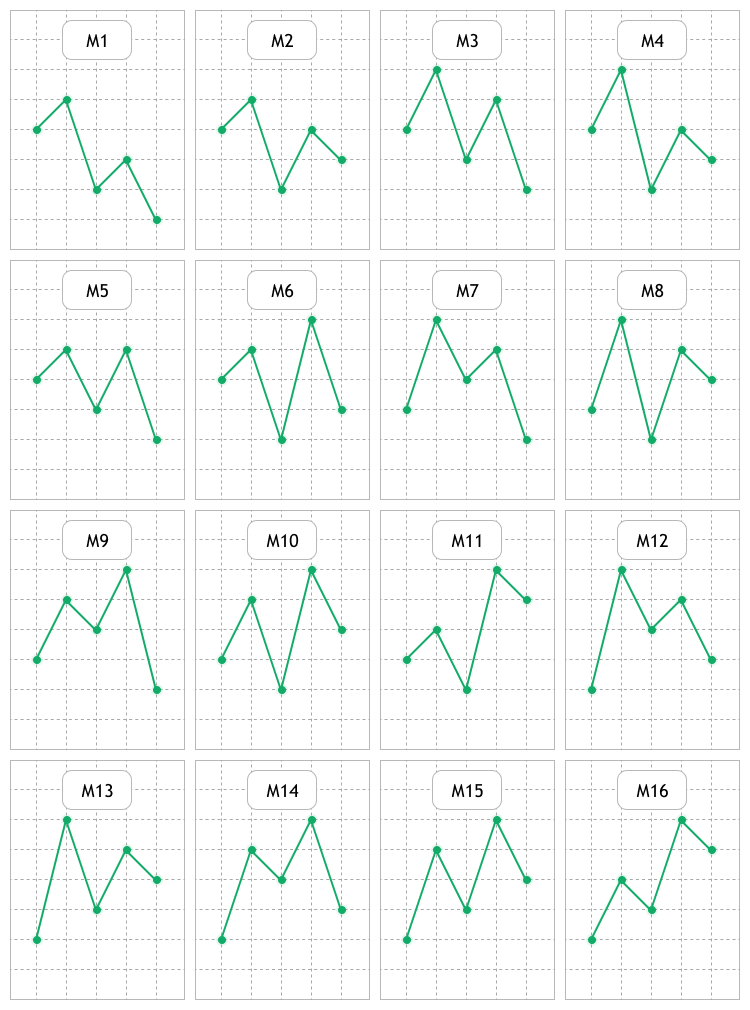
図1 Мパターンの視覚的表現
図2は16個のWパターンを表します。価格チャートと指標でこれら2つのグループを検索し、可能な規則性を調査、評価、検索します。
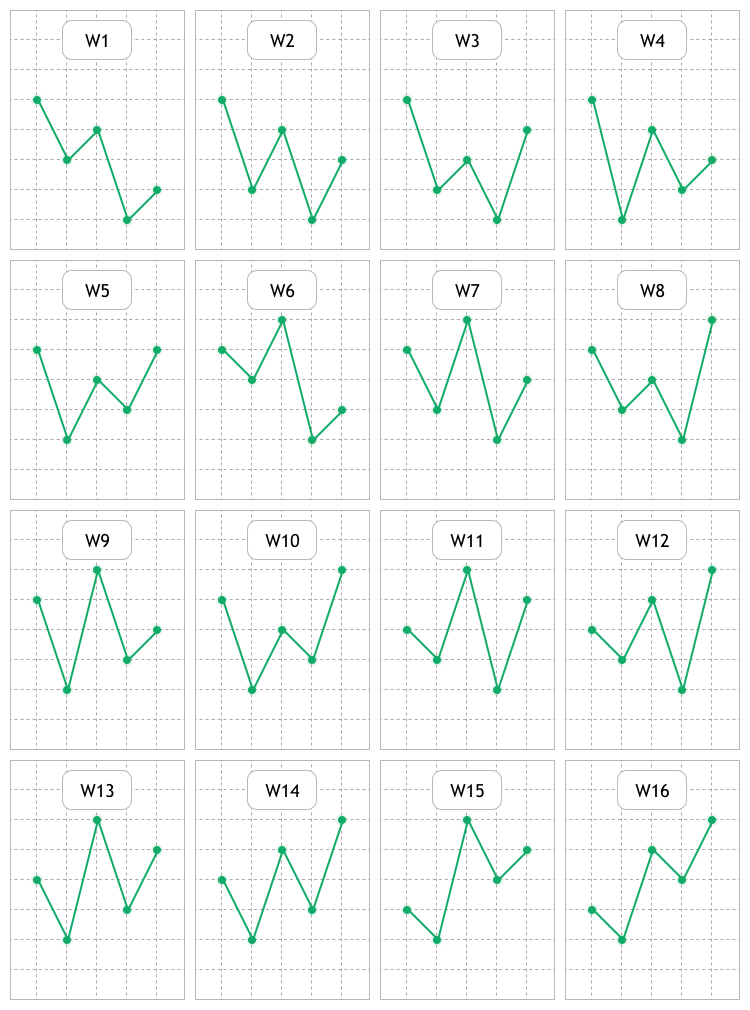
図2 Wパターンの視覚的表現
パターンの背後にある考え方は、特定のフォーメーションが出現すると、価格が特定の方向に移動し、それから利益を得ることができるという事実に要約されます。
メリルパターンをどの領域でどのように研究するかをできるだけ明確にするために、いくつかの例を示します。図3は、通常の線形USDCAD H1価格チャートを示しています。ローソク足やバーがより一般的になっているため、このタイプの表現はそれほど頻繁に使用されません。
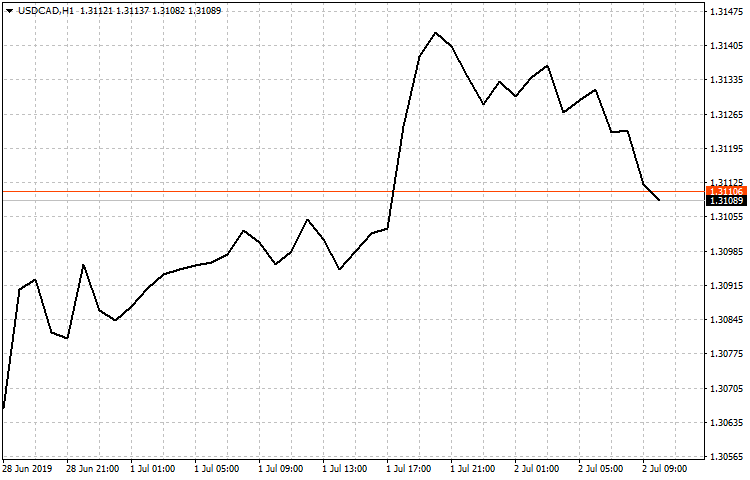
図3 終値に基づいた線形USDCAD H1チャート
ここで、上記のいくつかのパターンをすでに確認できます。これは研究の第1のの分野であり、終値に基づく線形チャートに適用されます。また、始値、高値、安値に基づいて線形チャートを確認します。
研究の第2の分野は、次のようなオシレータで構成されます。
- Average True Range(ATR) — 市場のボラティリティパラメータ
- Commodity Channel Index(CCI) — 平均価格からの銘柄価格の偏差の測定
- DeMarker(DeM)
- Force Index(勢力指数)(FRC)
- Williams’ Percent Range(WPR) — 買われ過ぎ/売られ過ぎの状態を定義する動的指標
- Relative Strength Index(相対強度指数)(RSI)
- モメンタム — 特定の期間における金融商品の価格の変化
上記の価格とオシレータの両方に適用されるパターンを評価する方法としては、『ローソク足分析技術の研究(第1部): 既存パターンの確認』稿で提案した方法が使用されます 。その背後にある考え方はシンプルです。
- 指定されたサンプルセクションでの分析されたパターンの識別
- 識別後の価格変動の分析
- データの収集とパターン効率の計算
ツールの開発とテスト
開発を開始する前に、どの設定を含めるべきかを定義する必要があります。ツールには[Analysis]および[Settings]タブを持つパネルがあります。EA設定ウィンドウのパラメータも使用されます。全体として、パターンを操作するためのツールを備えた3つのセクションがあります。次に、各セクションの設定について説明します。
[Analysis ]タブには以下が含まれます。
- テスト済みのパターンのタイプを選択するための2セットのボタンと、МおよびWパターンをすばやく選択/選択解除するための[All M]ボタンと[All W] ボタン
- テスト済みの時間枠を選択するためのボタンのセットと、ボタングループ全体を選択/選択解除するためのALLボタン
- [Trend threshold (points)]入力フィールド - 分析されたメリルパターンが識別された後に価格が最大3本のローソク足内で到達するポイントの利益
- 開始日と終了日、およびテスト時間を選択するためのダイアログウィンドウを開くボタン
- 必要な取引銘柄を見つけるためのフィルターである、チェックボックスとボタンのある入力フィールド(Majorに事前設定) - 主要通貨ペアが表示され、チェックボックスはフィルターを無効にし、利用可能なすべての取引銘柄を表示
- フィルター付きの表で選択された取引銘柄 - リストから選択後、パターン分析が実行される
- 7列で構成される結果表
- Figure name - M10やW12など、分析されたメリルパターンの名前
- Found - 選択したサンプルで指定されたタイプの検出されたパターンの数
- Timeframe - 指定されたパターンが分析された時間枠
- P, Uptrend - パターンが表示された後、[Trend threshold (points)]の値だけ価格が上昇する確率
- P, Dntrend - パターンが表示された後、[Trend threshold (points)]の値だけ価格が下降する確率
- K, UpTrend/K, DnTrend - 『ローソク足分析技術の研究(第1部): 既存パターンの確認』稿で説明されている比率で、分析されたパターンがトレンドの上方向または下方向に表示された後、価格が指定された利益に達するまでの時間を評価
図4は、上記のすべての銘柄とパラメータの視覚的な実装を示しています。
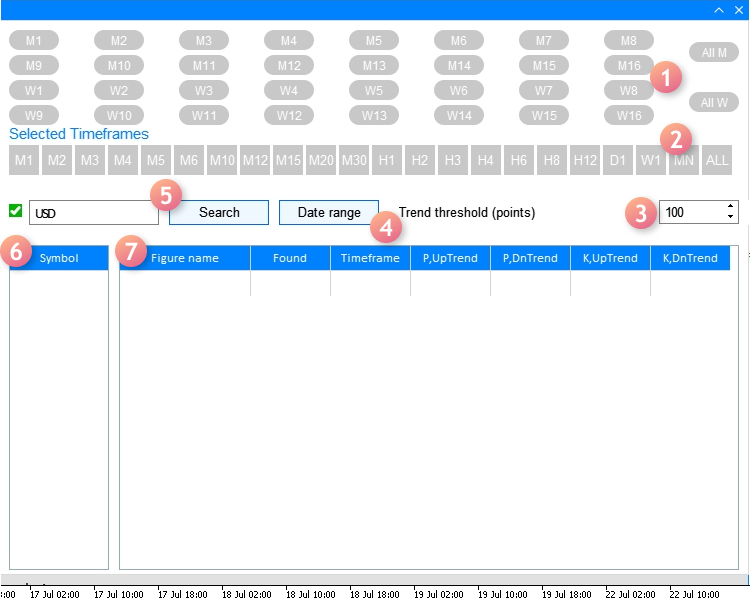
図4 [Analysis]タブ
それでは、[Settings]タブに進みましょう。
- Used indicator - メリルパターンの検索と分析を適用する指標を選択
- Weighting coefficients - 上記のK、UpTrend / DnTrend比率を計算するときに使用
- Interface language - インターフェイス言語を選択するドロップダウンリスト(英語またはロシア語)
以下の図5は設定を含むタブの外観を示します。
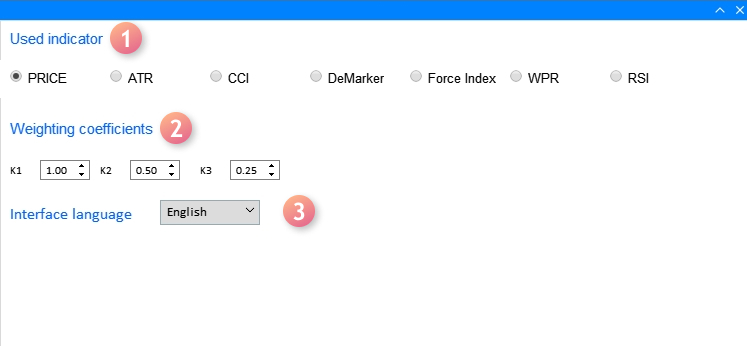
図5 [Settings]タブ
最後のセクションでは[EA settings]ウィンドウ(F7ホットキー)を適用し、[Used indicator]にリストされている適用中の指標の設定について説明します。図6は、設定の最後のセクションのウィンドウを表示しています。
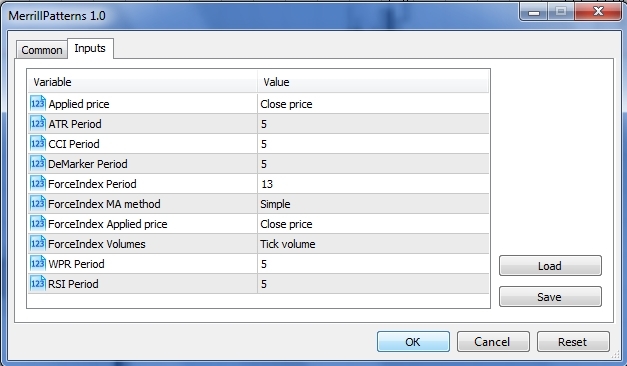
図6 使用中指標の設定ウィンドウ
ウィンドウで設定を定義するときは、次のニュアンスを考慮する必要があります。
- 最初の値(Applied price)では、7つの値(始値、終値、高値、安値、中央価格、標準価格、加重平均価格)を持つENUM_APPLIED_PRICE列挙型変数を適用します。チャート価格に基づいて分析を実行する場合、最後の3つの値は指標の計算用に設計されているため、最初の4つの値を使用する必要があります。
- パターンの分析で指標を使用する場合、[Applied price]の設定は、計算でENUM_APPLIED_PRICE型変数を使用する指標(ATR、CCI、RSI)に影響します。
ここで、アプリインターフェイスの実装と、メリルパターンの検索および分析の方法について考えてみましょう。
GUIを開発するには、インターフェイスのメインウィンドウを作成するCreateWindow()メソッドと研究する時間範囲を選択するためのダイアログウィンドウを作成するCreateWindowSetting1()メソッドで構成されるCreateGUI()メソッドを使用します。
//+------------------------------------------------------------------+
//| Create the program GUI                                           |
//+------------------------------------------------------------------+
bool CProgram::CreateGUI(void)
  {
//--- Create the panel
   if(!CreateWindow("Merrill Patterns"))
      return(false);
//--- Create the dialog window
   if(!CreateWindowSetting1("Setting dates"))
      return(false);
//--- GUI 作成を完成する
   CWndEvents::CompletedGUI();
   return(true);
  }
次に、各メソッドの構成を見てみましょう。まず、インターフェイスのメインウィンドウに注目します。これは、図4で説明されている要素で構成された[Analysis]タブの実装で構成されています。
//+------------------------------------------------------------------+
//| Analyze tab                                                      |
//+------------------------------------------------------------------+
//--- Create the pattern set buttons
   if(!CreatePatternSet(m_patterns,10,10))
      return(false);
//--- Timeframe header
   if(!CreateTFLabel(m_text_labels[1],10,105,0))
      return(false);
//--- Create the timeframe set buttons
   if(!CreateTimeframeSet(m_timeframes,10,125,0))
      return(false);
//--- Field for searching the symbol filter
   if(!CreateSymbolsFilter(m_symb_filter1,m_request1,10,180,0))
      return(false);
//--- Create the button for selecting a date range
   if(!CreateDateRange(m_request3,280,180,0))
      return(false);
//--- Create the field for entering the profit threshold value
   if(!CreateThresholdValue(m_threshold1,400,180,100,0))
      return(false);
//--- Create the symbol table
   if(!CreateSymbTable(m_symb_table1,10,225,0))
      return(false);
//--- Create the result table
   if(!CreateTable1(m_table1,120,225,0))
      return(false);
図5で示された[Settings]タブについては以下です。
//+------------------------------------------------------------------+
//| Settings tab                                                     |
//+------------------------------------------------------------------+
//---
   if(!CreateButtonsGroup1(10,50))
      return(false);
//--- Text labels
   if(!CreateTextLabel(m_text_labels[0],10,100))
      return(false);
   if(!CreateTextLabel(m_text_labels[3],10,10))
      return(false);
//--- 入力フィールド
   if(!CreateCoef(m_coef1,10,140,"K1",1))
      return(false);
   if(!CreateCoef(m_coef2,100,140,"K2",0.5))
      return(false);
   if(!CreateCoef(m_coef3,200,140,"K3",0.25))
      return(false);
   if(!CreateLanguageSetting(m_lang_setting,10,180,1))
      return(false);
//--- ステータスバー
   if(!CreateStatusBar(1,26))
      return(false);
//---
   return(true);
  }
インターフェイス要素を追加するために適用された各メソッドのより詳細な実装については、添付のソースコードを参照してください。
一時的な例を設定するためのダイアログウィンドウを実装するメソッドは、次のようになります。
//+---------------------------------------------------------------------------------+
//| Create the dialog window for selecting the range of dates in the Analysis tab   |
//+---------------------------------------------------------------------------------+
bool CProgram::CreateWindowSetting1(const string caption_text)
  {
//--- ウィンドウポインタをウィンドウ配列に追加する
   CWndContainer::AddWindow(m_window[2]);
//--- 座標
   int x=m_request3.X();
   int y=m_request3.Y()+m_request3.YSize();
//--- プロパティ
   m_window[2].XSize(372);
   m_window[2].YSize(230);
   m_window[2].WindowType(W_DIALOG);

//--- フォームを作成する
   if(!m_window[2].CreateWindow(m_chart_id,m_subwin,caption_text,x,y))
      return(false);
//---
   if(!CreateCalendar(m_calendar1,m_window[2],10,25,D'01.01.2019',1))
      return(false);
   if(!CreateCalendar(m_calendar2,m_window[2],201,25,m_calendar2.Today(),1))
      return(false);
//---
   if(!CreateTimeEdit(m_time_edit1,m_window[2],10,200,"Time",1))
      return(false);
   if(!CreateTimeEdit(m_time_edit2,m_window[2],200,200,"Time",1))
      return(false);
//---
   return(true);
  }
次に、パターンの検索、研究、評価の方法に注目しましょう。これを実現するには、アルゴリズムアクションのシーケンス全体を追跡する必要があります。まず、このアルゴリズムが開始されるMerrillPatterns.mq5ファイルを見てください。
//--- Include the application class
#include "Program.mqh"
CProgram program;
//+------------------------------------------------------------------+
//| EA inputs                                                        |
//+------------------------------------------------------------------+
input ENUM_APPLIED_PRICE   Inp_Price1              =  PRICE_CLOSE;   // Applied price
input int                  Inp_ATR_Peroid          =  5;             // ATR Period
input int                  Inp_CCI_Peroid          =  5;             // CCI Period
input int                  Inp_DeM_Peroid          =  5;             // DeMarker Period
input int                  Inp_ForcePeriod         =  13;            // ForceIndex Period
input ENUM_MA_METHOD       Inp_ForceMAMethod       =  MODE_SMA;      // ForceIndex MA method
input ENUM_APPLIED_PRICE   Inp_ForceAppliedPrice   =  PRICE_CLOSE;   // ForceIndex Applied price
input ENUM_APPLIED_VOLUME  Inp_ForceAppliedVolume  =  VOLUME_TICK;   // ForceIndex Volumes
input int                  Inp_WPR_Period          =  5;             // WPR Period
input int                  Inp_RSI_Period          =  5;             // RSI Period
//+------------------------------------------------------------------+
//| エキスパート初期化関数                                  |
//+------------------------------------------------------------------+
int OnInit(void)
  {
//---
   program.OnInitEvent();
//--- Set the trading panel
   if(!program.CreateGUI())
     {
      ::Print(__FUNCTION__," > Failed to create GUI!");
      return(INIT_FAILED);
     }
//---
   program.InitializePrice(Inp_Price1);
   program.InitializeATR(Inp_ATR_Peroid);
   program.InitializeCCI(Inp_CCI_Peroid);
   program.InitializeDeM(Inp_DeM_Peroid);
   program.InitializeForce(Inp_ForcePeriod,Inp_ForceMAMethod,Inp_ForceAppliedPrice,Inp_ForceAppliedVolume);
   program.InitializeWPR(Inp_WPR_Period);
   program.InitializeRSI(Inp_RSI_Period);
   return(INIT_SUCCEEDED);
  }
指標の入力とは別に、OnInit()ではグラフィカルシェルの検索が実行され、[Properties]プロパティウィンドウで設定されたデータを初期化します。すべてのメソッドは、外部設定を内部変数に渡します。
//---
   void              InitializePrice(ENUM_APPLIED_PRICE price)    { m_applied_price=price;        }
   void              InitializeATR(int period)                    { m_atr_period=period;          }
   void              InitializeCCI(int period)                    { m_cci_period=period;          }
   void              InitializeDeM(int period)                    { m_dem_period=period;          }
   void              InitializeWPR(int period)                    { m_wpr_period=period;          }
   void              InitializeRSI(int period)                    { m_rsi_period=period;          }
//+------------------------------------------------------------------+
//|                                                                  |
//+------------------------------------------------------------------+
void CProgram::InitializeForce(int period,ENUM_MA_METHOD ma_method,ENUM_APPLIED_PRICE price,ENUM_APPLIED_VOLUME volume)
  {
   m_force_period=period;
   m_force_ma_method=ma_method;
   m_force_applied_price=price;
   m_force_applied_volume=volume;
  }
//+-----------------------------------------------------------------
その後、アプリケーションを使用する準備が整い、残りの設定は作成されたGUIに渡されます。計算は、銘柄表(図4の位置6)から通貨銘柄を選択することで開始されることは既に述べました。これはまた、[Trend threshold](図4の位置3)の設定後に行われます。両方のイベントではChangeSymbol1()メソッドが検知されたデータの収集を始め分析のために準備します。
//+------------------------------------------------------------------+
//| Select a symbol in the Analysis tab                              |
//+------------------------------------------------------------------+
bool CProgram::ChangeSymbol1(const long id)
  {
//--- 要素IDを確認する
   if(id!=m_symb_table1.Id())
      return(false);
//--- Exit if the string is not highlighted
   if(m_symb_table1.SelectedItem()==WRONG_VALUE)
     {
      //--- Show full description of a symbol in the status bar
      m_status_bar.SetValue(0,"Symbol for analysis not selected");
      m_status_bar.GetItemPointer(0).Update(true);
      return(false);
     }
//--- Get a selected symbol
   string symbol=m_symb_table1.GetValue(0,m_symb_table1.SelectedItem());
//--- ステータスバーに完全な銘柄説明を表示する
   string val=(m_lang_index==0)?"Выбранный символ: ":"Selected symbol: ";
   m_status_bar.SetValue(0,val+::SymbolInfoString(symbol,SYMBOL_DESCRIPTION));
   m_status_bar.GetItemPointer(0).Update(true);
//---
   GetResult(symbol);
   return(true);
  }
その作業の本質は、銘柄表から選択された取引銘柄を定義し、その値をステータスバーとGetResult()メソッドに渡すことです。すべての主要な作業がその中で行われるため、メソッドをより詳細に検討しましょう。
//+------------------------------------------------------------------+
//| Handle pattern search results                                    |
//+------------------------------------------------------------------+
bool CProgram::GetResult(const string symbol)
  {
//--- Structure for evaluating pattern efficiency
   RATING_SET m_coef[];
//--- Figure types
   PATTERN_TYPE pattern_types[];
//---
   ArrayResize(pattern_types,33);
   for(int i=0;i<33;i++)
     {
      if(i==16)
         pattern_types[i]=-1;
      if(i<16)
         pattern_types[i]=PATTERN_TYPE(i);
      if(i>16)
         pattern_types[i]=PATTERN_TYPE(i-1);
     }
//--- Define selected timeframes
   GetTimeframes(m_timeframes,m_cur_timeframes);
   int total=ArraySize(m_cur_timeframes);
//--- Check for at least one selected timeframe
   if(total<1)
     {
      if(m_lang_index==0)
         MessageBox("Вы не выбрали рабочий таймфрейм!","Ошибка",MB_OK);
      else if(m_lang_index==1)
         MessageBox("You have not selected working timeframe!","Error",MB_OK);
      return(false);
     }
   int count=0;
   m_total_row=0;
//--- Remove all strings
   m_table1.DeleteAllRows();
//--- Get date range
   datetime start=StringToTime(TimeToString(m_calendar1.SelectedDate(),TIME_DATE)+" "+(string)m_time_edit1.GetHours()+":"+(string)m_time_edit1.GetMinutes()+":00");
   datetime end=StringToTime(TimeToString(m_calendar2.SelectedDate(),TIME_DATE)+" "+(string)m_time_edit2.GetHours()+":"+(string)m_time_edit2.GetMinutes()+":00");
//--- Check selected dates
   if(start>end || end>TimeCurrent())
     {
      if(m_lang_index==0)
         MessageBox("Неправильно выбран диапазон дат!","Ошибка",MB_OK);
      else if(m_lang_index==1)
         MessageBox("Incorrect date range selected!","Error",MB_OK);
      return(false);
     }
//---
   for(int k=0;k<33;k++)
     {
      if(k==16)
         continue;
      //--- Get selected patterns for analysis
      if(m_patterns[k].IsPressed())
        {
         ArrayResize(m_m_total,total);
         ArrayResize(m_coef,total);
         ZeroMemory(m_m_total);
         ZeroMemory(m_coef);
         count++;
         //--- Calculate by timeframes
         for(int j=0;j<total;j++)
           {
            double arr[];
            //--- Get data for analysis
            int copied=GetData(m_buttons_group1.SelectedButtonIndex(),symbol,m_cur_timeframes[j],start,end,arr);
            //---
            if(copied<9)
               MessageBox("Insufficient data for analysis","Error",MB_OK);
            for(int i=0;i<copied;i++)
              {
               if(i>copied-9)
                  continue;
               //--- Pattern search condition
               double A=arr[i];
               double B=arr[i+1];
               double C=arr[i+2];
               double D=arr[i+3];
               double E=arr[i+4];
               if(GetPatternType(A,B,C,D,E)==pattern_types[k])
                 {
                  m_m_total[j]++;
                  GetCategory(symbol,i+5,m_coef[j],m_cur_timeframes[j],m_threshold_value1);
                 }
              }
            //--- Add the result to the table
            AddRow(m_table1,m_patterns[k].LabelText(),m_coef[j],m_m_total[j],m_cur_timeframes[j]);
           }
        }
     }
//---
   if(count>0)
     {
      //---
      m_table1.DeleteRow(m_total_row);
      //--- 表を更新する
      m_table1.Update(true);
      m_table1.GetScrollVPointer().Update(true);
     }
   else
     {
      if(m_lang_index==0)
         MessageBox("Вы не выбрали паттерн!","Ошибка",MB_OK);
      else if(m_lang_index==1)
         MessageBox("You have not chosen a pattern!","Error",MB_OK);
     }
   return(true);
  }
まず、メソッドの最初に入力された変数の型を説明する必要があります。最初のものはRATING_SET構造体です。
struct RATING_SET
  {
   int               a_uptrend;
   int               b_uptrend;
   int               c_uptrend;
   int               a_dntrend;
   int               b_dntrend;
   int               c_dntrend;
  };
これには6つのint型変数が含まれており、パターンを識別した後、価格が指定された方向に移動する頻度と価格が到達する速さに関するデータを追加するために必要です。 たとえば、上昇トレンドがあり、トレンド閾値が5桁で100ポイントに設定され、価格が単一のローソク足内でこの値をカバーするとします。 この場合、a_uptrend変数は1の値を受け取ります。価格が2本のローソク足内で100ポイントに達すると、値はb_uptrend変数に渡されます。メソッドではm_coef[]構造体配列を使用します。
2番目の変数型はPATTERN_TYPEです。これは、すべてのタイプのメリルパターンを収集する列挙体です。
//+------------------------------------------------------------------+
//| Figure type                                                      |
//+------------------------------------------------------------------+
enum PATTERN_TYPE
  {
   M1,M2,M3,M4,M5,M6,M7,M8,
   M9,M10,M11,M12,M13,M14,M15,M16,
   W1,W2,W3,W4,W5,W6,W7,W8,
   W9,W10,W11,W12,W13,W14,W15,W16
  };
このメソッドにはpattern_types[]列挙体配列が適用されます。次に、アプリケーションで作業するために選択された時間枠が確認されます。このデータはGetTimeframes()メソッドで処理されます。
//+------------------------------------------------------------------+
//| Get the array of selected timeframes                             |
//+------------------------------------------------------------------+
void  CProgram::GetTimeframes(CButton &buttons[],ENUM_TIMEFRAMES &timeframe[])
  {
   string tf[22]=
     {
      "M1","M2","M3","M4","M5","M6","M10","M12","M15","M20","M30",
      "H1","H2","H3","H4","H6","H8","H12","D1","W1","MN"
     };
   int j=0;
   ArrayResize(timeframe,22);
   for(int i=0;i<22;i++)
     {
      if(buttons[i].IsPressed())
        {
         timeframe[j]=StringToTimeframe(tf[i]);
         j++;
        }
     }
   ArrayResize(timeframe,j);
  }
メソッドは、これを事前に設定されたm_cur_timeframes[]時間枠配列に書き込みます。次に、作業の時間範囲を取得します。
最初のループでは、パターンタイプを担当する選択されたボタンの押下を確認し、調査対象のパターンのセットを定義し始めます。次のループでは、その前に選択された時間枠で各パターンが調査されます。この段階で、事前に設定されたパターンと時間枠の設定をどのデータに適用すべきかという疑問が生じます。GetData()メソッドは、EAプロパティウィンドウで設定した設定と、アプリケーション設定タブで適用された指標(図5の位置1)を定義するため、その責任を負います。
//+------------------------------------------------------------------+
//|                                                                  |
//+------------------------------------------------------------------+
int CProgram::GetData(int index,string symb,ENUM_TIMEFRAMES tf,datetime start,datetime end,double &arr[])
  {
//---
   int Handle=INVALID_HANDLE,copied;
//--- Close price
   if(index==0)
     {
      MqlRates rt[];
      ZeroMemory(rt);
      copied=CopyRates(symb,tf,start,end,rt);
      ArrayResize(arr,copied);
      for(int i=0;i<copied;i++)
        {
         arr[i]=rt[i].close;
         if(m_applied_price==PRICE_OPEN)
            arr[i]=rt[i].open;
         else if(m_applied_price==PRICE_CLOSE)
            arr[i]=rt[i].close;
         else if(m_applied_price==PRICE_HIGH)
            arr[i]=rt[i].high;
         else if(m_applied_price==PRICE_LOW)
            arr[i]=rt[i].low;
        }
      return(copied);
     }
//--- ATR
   if(index==1)
      Handle=iATR(symb,tf,m_atr_period,m_applied_price);
//--- CCI
   if(index==2)
      Handle=iCCI(symb,tf,m_cci_period,m_applied_price);
//--- DeMarker
   if(index==3)
      Handle=iDeMarker(symb,tf,m_dem_period);
//--- Force Index
   if(index==4)
      Handle=iForce(symb,tf,m_force_period,m_force_ma_method,m_force_applied_volume);
//--- WPR
   if(index==5)
      Handle=iWPR(symb,tf,m_wpr_period);
//--- RSI
   if(index==6)
      Handle=iRSI(symb,tf,m_rsi_period,m_applied_price);
//---
   if(Handle==INVALID_HANDLE)
     {
      Print("Failed to get indicator handle");
      return(-1);
     }
   copied=CopyBuffer(Handle,0,start,end,arr);
   return(copied);
  }
分析用のデータを受信した後、アルゴリズムは、選択した時間枠で以前に設定されたすべてのパターンを検索するために使用されるGetPatternType()メソッドに進みます。
//+------------------------------------------------------------------+
//| Define the patterns                                              |
//+------------------------------------------------------------------+
PATTERN_TYPE CProgram::GetPatternType(double A,double B,double C,double D,double E)
  {
//--- M1
   if(B>A && A>D && D>C && C>E)
      return(M1);
//--- M2
   if(B>A && A>D && D>E && E>C)
      return(M2);
//--- M3
   if(B>D && D>A && A>C && C>E)
      return(M3);
//--- M4
   if(B>D && D>A && A>E && E>C)
      return(M4);
//--- M5
   if(D>B && B>A && A>C && C>E)
      return(M5);
//--- M6
   if(D>B && B>A && A>E && E>C)
      return(M6);
//--- M7
   if(B>D && D>C && C>A && A>E)
      return(M7);
//--- M8
   if(B>D && D>E && E>A && A>C)
      return(M8);
//--- M9
   if(D>B && B>C && C>A && A>E)
      return(M9);
//--- M10
   if(D>B && B>E && E>A && A>C)
      return(M10);
//--- M11
   if(D>E && E>B && B>A && A>C)
      return(M11);
//--- M12
   if(B>D && D>C && C>E && E>A)
      return(M12);
//--- M13
   if(B>D && D>E && E>C && C>A)
      return(M13);
//--- M14
   if(D>B && B>C && C>E && E>A)
      return(M14);
//--- M15
   if(D>B && B>E && E>C && C>A)
      return(M15);
//--- M16
   if(D>E && E>B && B>C && C>A)
      return(M16);
//--- W1
   if(A>C && C>B && B>E && E>D)
      return(W1);
//--- W2
   if(A>C && C>E && E>B && B>D)
      return(W2);
//--- W3
   if(A>E && E>C && C>B && B>D)
      return(W3);
//--- W4
   if(A>C && C>E && E>D && D>B)
      return(W4);
//--- W5
   if(A>E && E>C && C>D && D>B)
      return(W5);
//--- W6
   if(C>A && A>B && B>E && E>D)
      return(W6);
//--- W7
   if(C>A && A>E && E>B && B>D)
      return(W7);
//--- W8
   if(E>A && A>C && C>B && B>D)
      return(W8);
//--- W9
   if(C>A && A>E && E>D && D>B)
      return(W9);
//--- W10
   if(E>A && A>C && C>D && D>B)
      return(W10);
//--- W11
   if(C>E && E>A && A>B && B>D)
      return(W11);
//--- W12
   if(E>C && C>A && A>B && B>D)
      return(W12);
//--- W13
   if(C>E && E>A && A>D && D>B)
      return(W13);
//--- W14
   if(E>C && C>A && A>D && D>B)
      return(W14);
//--- W15
   if(C>E && E>D && D>A && A>B)
      return(W15);
//--- W16
   if(E>C && C>D && D>A && A>B)
      return(W16);
   return(-1);
  }
検出されたパターンはGetCategory()メソッドを使用して評価されます。ここでは、以前に定義されたRATING_SET型の構造体配列が使用されます。
//+------------------------------------------------------------------+
//| Define the profit categories                                     |
//+------------------------------------------------------------------+
bool CProgram::GetCategory(const string symbol,const int shift,RATING_SET &rate,ENUM_TIMEFRAMES timeframe,int threshold)
  {
   MqlRates rt[];
   datetime start=StringToTime(TimeToString(m_calendar1.SelectedDate(),TIME_DATE)+" "+(string)m_time_edit1.GetHours()+":"+(string)m_time_edit1.GetMinutes()+":00");
   start+=PeriodSeconds(timeframe)*shift;
   int copied=CopyRates(symbol,timeframe,start,4,rt);
//--- Get the data of previous candles
   if(copied<4)
      return(false);
   double high1,high2,high3,low1,low2,low3,close0,point;
   close0=rt[0].close;
   high1=rt[1].high;
   high2=rt[2].high;
   high3=rt[3].high;
   low1=rt[1].low;
   low2=rt[2].low;
   low3=rt[3].low;
   if(!SymbolInfoDouble(symbol,SYMBOL_POINT,point))
      return(false);

//--- Check for Uptrend
   if((int)((high1-close0)/point)>=threshold)
     {
      rate.a_uptrend++;
     }
   else if((int)((high2-close0)/point)>=threshold)
     {
      rate.b_uptrend++;
     }
   else if((int)((high3-close0)/point)>=threshold)
     {
      rate.c_uptrend++;
     }

//--- Check for Downtrend
   if((int)((close0-low1)/point)>=threshold)
     {
      rate.a_dntrend++;
     }
   else if((int)((close0-low2)/point)>=threshold)
     {
      rate.b_dntrend++;
     }
   else if((int)((close0-low3)/point)>=threshold)
     {
      rate.c_dntrend++;
     }
   return(true);
  }
処理された評価データはAddRow()メソッドに渡されます。このメソッドは、確率値と効率率を計算し、結果表に追加します。
//+------------------------------------------------------------------+
//|                                                                  |
//+------------------------------------------------------------------+
void CProgram::AddRow(CTable &table,string pattern_name,RATING_SET &rate,int found,ENUM_TIMEFRAMES timeframe)
  {
   int row=m_total_row;
   double p1,p2,k1,k2;
   int sum1=0,sum2=0;
   sum1=rate.a_uptrend+rate.b_uptrend+rate.c_uptrend;
   sum2=rate.a_dntrend+rate.b_dntrend+rate.c_dntrend;
//---
   p1=(found>0)?(double)sum1/found*100:0;
   p2=(found>0)?(double)sum2/found*100:0;
   k1=(found>0)?(m_k1*rate.a_uptrend+m_k2*rate.b_uptrend+m_k3*rate.c_uptrend)/found:0;
   k2=(found>0)?(m_k1*rate.a_dntrend+m_k2*rate.b_dntrend+m_k3*rate.c_dntrend)/found:0;
//---
   table.AddRow(row);
   table.SetValue(0,row,pattern_name);
   table.SetValue(1,row,(string)found);
   table.SetValue(2,row,TimeframeToString(timeframe));
   table.SetValue(3,row,DoubleToString(p1,2),2);
   table.SetValue(4,row,DoubleToString(p2,2),2);
   table.SetValue(5,row,DoubleToString(k1,2),2);
   table.SetValue(6,row,DoubleToString(k2,2),2);
   ZeroMemory(rate);
   m_total_row++;
  }
アプリケーションの使用に関連する潜在的な質問に答えるために、以下のビデオ(英語)は異なる設定での計算の例を示しています。
以下は、メリルパターンのテストに関する推奨事項です。
- アプリケーションが正しく機能するためには、ダウンロードする特定の取引銘柄でテストするための履歴データが必要です。
- 結果の処理に時間がかかる場合があるため、すべてのパターンとすべての時間枠を同時にダウンロードすることは推奨されません。
- 問題を引き起こす可能性のある最も一般的なシナリオには、ヒントが伴います。このようなシナリオには、未設定の時間枠やパターン、および無効な日付が含まれます。
- EAプロパティを設定するときは注意してください(図6)。設定が明確でない場合は、記事を読み直してください。
- この記事では、パターン効率の計算方法のトピックを2回取り上げました。記事のリンクはこちらです。設定タブの重み係数がパターン評価にどのように影響するかを明確に理解する必要があることに留意してください。
終わりに
以下の添付ファイルには、説明されたすべてのファイルがフォルダに分類されています。正しい操作のためには、MQL5フォルダを端末のルートディレクトリに保存してください。MQL5フォルダのあるルートディレクトリを開くには、MetaTrader 5ターミナルでCtrl+Shift+Dキーの組み合わせを押すか、下記の図7にあるようにコンテキストメニューを使用します。
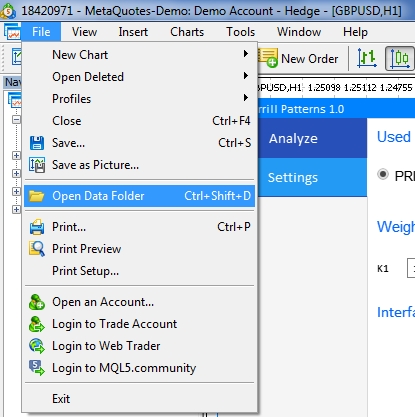
図7 MetaTrader 5ターミナルルートでMQL5フォルダを開く