初心者向け MQL4 言語テクニカルインディケータと組み込み関数
Antoniuk Oleg | 15 3月, 2016
はじめに
本稿は『初心者向け MQL4 言語』シリーズの第3弾です。最初の2稿では、のちの作成の基本となるMQL4 の基礎を学びました。ここでは組み込み関数およびテクニカルインディケータと連携する関数の使い方を学習します。後者はみなさんの Expert Advisor やインディケータをさらに発展させる上で基本となるものです。また、簡単な例で、市場参入のためのトレードシグナルの追跡法を見て、インディケータを正しく使用する方法が理解できるようにします。本稿が終わるころには、みなさんはこの言語自体について何か新しいおもしろいことを学んでいることでしょう。
数学関数
もっともシンプルでありながら、それでも利用され役に立つ数学関数から始めます。
MathAbs
関数プロトタイプ:
double MathAbs(double value)
これはひじょうにシンプルな関数で、絶対値(数字モジュール)を返します。それは、たとえば、負の数にそれを使用する場合、結果として正の数を取得することを意味します。
使用例:
int a=-10;
double b=-20.0;
double c=7.0;

a=MathAbs(a); // now a is equal to 10
b=MathAbs(b); // now b is equal to 20.0
c=MathAbs(c); // the value of c will not change, for it was positive
MathCeil、MathFloor、MathRound
関数プロトタイプ:
double MathCeil(double x)
double MathFloor(double x)
double MathRound(double value)
この3つの関数はひじょうに似通っています。すべて数値を整数に四捨五入すのです。ですがそれぞれに特徴があります。
MathCeil は整数の1000分の1の数字(たとえば 1.001)でも整数とみなす、という方法で四捨五入します。すなわち、数字は高い値に四捨五入されるのです。例:
double a;
a=MathCeil(1.001);  // a=2.0, even one thousandth is rounded off to a whole number
a=MathCeil(1.999);  // a=2.0
a=MathCeil(-1.001); // a=-1.0, it is correct, because -1.0 is more than -1.001
a=MathCeil(-1.999); // a=-1.0, it is correct, -1.0 is more than -1.999
MathFloor も MathCeil と同様ですがまったく逆です。すなわち、正の数を切り捨てる必要がある場合、この関数が単純に小数部分をなくすのです。
double a;
a=MathFloor(1.999); // a=1.0, no matter how large the fractional part is, it will be taken away
a=MathFloor(1.001); // a=1.0
a=MathFloor(-1.001); // a=-2.0, correct, because -2.0 is less than -1.001
a=MathFloor(-1.999); // a=-2.0, correct, -2.0 is less than -1.999
MathRound はなじみのある方法で四捨五入します。すなわち、小数部分が大きければ(0.5 以上)、その数字は 1 に四捨五入されます。小数部分が小さければ(0.5 未満)、その数字は 0 に四捨五入、すなわちただ省略、されます。例:
double a;
a=MathRound(1.1);   // a=1.0, the fractional part is too small (0.1)
a=MathRound(1.57);  // a=2.0, the fractional part is enough to be rounded off to 1
a=MathRound(-3.1);  // a=-3.0 not enough
a=MathRound(-6.99); // a=-7.0 enough
MathMax
MathMin
関数プロトタイプ:
double MathMax(double value1, double value2)
double MathMin(double value1, double value2)
この2つの関数はひじょうに似ています。2 つの引数を受け取って、それぞれ一番大きい引数、一番小さい引数を返します。例:
double a;
a=MathMax(50.0,1.0);  // a=50.0
a=MathMin(10.0,12.0); // a=10.0
MathPow
関数プロトタイプ:
double MathPow(double base, double exponent)
この関数はべき指数に対して基数を累乗することができます。例:
double a;
a=MathPow(5.0,2.0);  // a=25.0, 5 to the power 2
a=MathPow(2.0,8.0);  // a=256.0, 2 to the power 8
a=MathPow(25.0,0.5); // a=5.0, you know, a number to the power 0.5 is its square root
MathSqrt
関数プロトタイプ:
double MathSqrt(double x)
この関数によって平方根を取ります。ただし、負の数の平方根は取らないようにします。その場合はゼロが返されます。例:
double a;
a=MathSqrt(9.0);    // a=3.0
a=MathSqrt(25.0);   // a=5.0
a=MathSqrt(-256.0); // a=0.0, I explained
MathLog
関数プロトタイプ:
double MathLog(double x)
対数とは何か覚えていますか?基数 b に対する対数 a は、a を求めるためにb を累乗する必要がある指数に等しくなっています。広く利用されるのは、基数 e(オイラー数)の対数-自然対数(lna)と、基数10 に対する対数-常用(ブリッグスの)対数(lg a)です。対数についてのさらなる情報は以下にあります。
https://en.wikipedia.org/wiki/Logarithm
関数 MathLog は数字 x の自然対数を取ります。負の数やゼロの自然対数を求めようとしないでください。そうした場合には-1 を得ることとなります。関数使用例:
double a;
a=MathLog(10.0);  // a=2.30258509
a=MathLog(0.0);   // a=-1.0, incorrect
a=MathLog(-10.0); // a=-1.0, incorrect
MathExp
関数プロトタイプ:
double MathExp(double d)
この関数は e を累乗した数字 d を返します。この数字についてお忘れの方も多いことでしょう。
e は数学的定数で、自然対数の基数、無理数で超越数です。e = 2,718281828459045… はオイラー数または ネイピア数と呼ばれることもあります。微分法や積分法で重要な役割を果たします。オイラー数についてのさらなる情報は以下にあります。
http://en.wikipedia.org/wiki/Eulerian_number
ひじょうに大きな次数を指示する場合、オーバーフローが起こり、ゼロが返されます。誤りに対してはどのくらい次数が大きいものでしょうか?それを求めます。そのためにちょっとした実験を行います。
double exponent=1.0; // here the degree value will be stored
double result=1.0;   // result, returned by the function
int i=0;             // number of cycle iterations

while(result!=0.0)   // while the result is not equal to zero (while there is no overflowing)
{
   result=MathExp(exponent); // remember the result
   exponent*=10.0;           // increase the degree
   i++;                      // the next iteration is over
}
MessageBox("i="+i); // result of the experiment
そうすると以下が起こります。:関数 MathExp を呼ぶたび、そして毎回の反復で、最終的にオーバーフローが起こり、ゼロが返されるまで次数が10倍増します。私は次の結果を得ました。i=310 です。これは、次数として 1 × 10 を 309 乗まで(309 桁の長さの数字を想像してください!)使用できることを意味します。というわけで、オーバーフローを恐れることはないと思います。
MathMod
関数プロトタイプ:
double MathMod(double value,double value2)
この関数は除算の余りを求めます。たとえば、5 を 2 で割ると、2 余り 1 となります。1番目の引数の値-被除数、値 2 -除数、です。結果が返されます。例:
double a;

a=MathExp(5,2); // a=1.0
a=MathExp(10,3); // a=1.0, correct
a=MathExp(50,10); // a=0.0, divided without residue
MathRand および MathSrand
関数プロトタイプ:
int MathRand()
void MathSrand(int seed)
MathRand は 0~2767 の範囲で擬似乱数整数を順番に返します。ここで疑問を持たれるかもしれません。「疑似」とは?範囲も奇妙だ。5~ 10 が必要な場合はどうなるのだ?なぜきっちり 32767 なのか?答えはここにあります。
『疑似』とは、数字が完全にランダムではなく、何かに依存していることを意味します。5個の疑似乱数時を返すスクリプトを書くとします。例:
int a=0;

while(a<5)
{
   MessageBox(“random=”+MathRand());
   a++;
}
数字は実にランダムですが、もう一度スクリプトを開始すれば、シーケンスは常に同じになります。関数 MathRand がそこから始めて拒絶する数字があるため、そのようになるのです。この数字を開始の数字と呼ぶことにします。それを変更するには、別の関数 MathSrand を使用します。この関数は単一の引数-開始の数字、を受け取ります。その数字ですべての疑似乱数字が決まるのです。開始の数字が果物だと想像すると、そこから木(乱数)が大きくなるのです。デフォルトでは、開始の数字は1です。よって、ほんとうにランダムなシーケンスを得るためには、まず開始の数字にユニークな値を割り当てる必要があります。どうすればよいのでしょうか?もう一つ関数があります。それは TimeLocal で、これは引数を持たず、1970年1月1日 00:00 からの経過秒数を返します。この関数は理想的に適しています。なぜならほとんどの場合、ユニークな数字を受け取るためです。まだ混乱はしていませんか?それは次のようなものです。
int a=0;
MathSrand(TimeLocal()); // assign a unique value to the beginning number

while(a<5)
{
   MessageBox(“random=”+MathRand());
   a++;
}
これで毎回新しいシーケンスを取得します。続けましょう
0 から 32767 まで。なぜ 32767 なのでしょうか?見てください。int が受け付けられる最大値は 2 の16乗で(なぜならint 変数の値はコンピュータメモリでは16ビットで、記号とはみなされないからです)、それは 32768 に等しく、われわれはゼロからカウントを始めるためそこから1を引く必要があるのです。それで32767 を得るのです。
必要な範囲を得るには、演算子 % -除算の余りを使います。たとえば、0~5 、の範囲で32768ランダムな数字を得る必要がある場合、以下のようになります。
int a=0;
MathSrand(TimeLocal());
while(a<5)
{
   MessageBox(“random=”+MathRand()%6);
   a++;
}
われわれが書いたのは MathRand()%5 ではなく、MathRand()%6 だということにご注意ください。同時にわれわれの範囲はゼロからスタートしているので、1を足す必要があることにも注意が必要です。5 ~10 の範囲の乱数が必要であると仮定します。
MessageBox(“random=”+MathRand()%6+5); // just add the necessary shift
たとえば -5~5 など負の数の範囲を必要とするときも同様です。
MessageBox(“random=”+MathRand()%11-5);
負の数字のみ必要な場合は、結果に -1 を掛けます。たとえば、-10~ -20 の範囲を必要とする場合は以下のようになります。
MessageBox(“random=”+(MathRand()%11+10)*(-1));
たとえば1000分の1まで正確な 0.0~1.0 の範囲の非整数が必要であれば、以下のコードを使用します。
MessageBox(“random=”+MathRand()%1001/1000.0);
まず、 0~ 1000 の範囲の乱数を作成し、それを 1000.0 で割ります。1000(整数)ではなく、正確に 1000.0 (浮動小数点付)で割る必要があることに注意します。そうしなければ、四捨五入されるため、得るのはゼロとなります。
三角関数および逆三角関数
三角関数は角度からくる数学関数です。それらは周期的なプロセスの分析の際重要です。それらにひじょうに近いものに逆三角関数があります。詳しくは以下にあります。
https://en.wikipedia.org/wiki/Trigonometric_function
https://en.wikipedia.org/wiki/ArcSin
MQL4 ではこういった関数はすべて角度ではなく、ラジアンでの引数が受け取られます。すなわち、20°のサインを求める必要がある場合、まず20°をラジアンに変えなければなりません。例えば以下です。
MathSin(20.0*3.14159/180.0);
すなわち1 grade = π ÷ 180です。よく三角関数を利用するのであれば、定数を宣言し、プログラム冒頭で使用するのが便利です。
#define PI 3.1415926535897
MathSin、MathCos、MathTan、MathArcsin、MathArccos、 MathArctan
関数プロトタイプ:
double MathSin(double value)
double MathCos(double value)
double MathTan(double x)
double MathArcsin(double x)
double MathArccos(double x)
double MathArctan(double x)
関数いくつかの特殊な点を詳しく説明します。MathTan は -263~ 263 の範囲の値を受け取ります。限度を超えた場合、数字は不定となります。MathArcsin および MathArccos は -1~ 1 の範囲の値を受け取ります。それ以外はゼロと EA のジャーナルに適切なメッセージを取得します。MathArctan は 0 を受け取ると 0 を返します。
メッセージ表示のための新しい関数
これまで、情報表示の関数は1つしか知りませんでした。それはMessageBoxです。ここで、ひじょうに似通ってはいますが、それぞれ特徴ある関数をあと 3 つ学習します。
Alert
関数プロトタイプ:
void Alert(...)
ご自身のシグナル(情報)を持つダイアログウィンドウを表示します。この関数呼び出し時に特別な信号音が聞こえます。それはターミナル設定で変更または無効にすることができます。:サービス → 設定 → タブ「イベント」。そのウィンドウは次のようなものです。
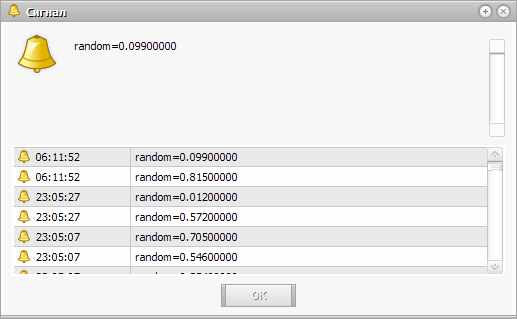
大量の情報を閲覧しやすいようにウィンドウサイズを変更することができます。また、直近の関数呼び出しは常に閲覧可能です。それらは削除されないためです。複数呼び出しを連続して行うこともできます。ウィンドウは直近のアクティブな信号で取得し、毎回「OK」をクリックする必要はありません。この関数は MessageBox 同様に使用できます。
Alert(“signal type:”+signalType);
Alert(“random=”+MathRand()%1001);
意図するところは違っても、です。エンターのためのパラメータは、コンマで区切って単純に列挙することとなります。すなわち、それは上の例のようなものですが、 "+" の代わりに "," を使ったものとなります。私は2番目のバリアントの使用をお薦めします。
Alert(“signal type:”,signalType);
Alert(“random=”,MathRand()%1001);
Comment
関数プロトタイプ:
void Comment(...)
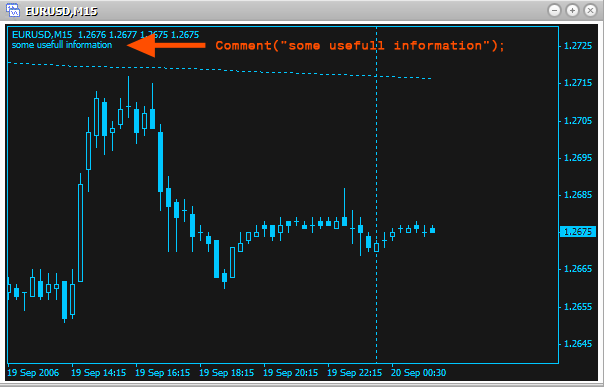
類似する関数、用途は同一、チャートの左上にメッセージ表示。ここではコードを操作するのになにもクリックする必要はありません。たとえば現状を表示するのにこの関数を使います。例:
Comment(“some usefull information”);
関数プロトタイプ:
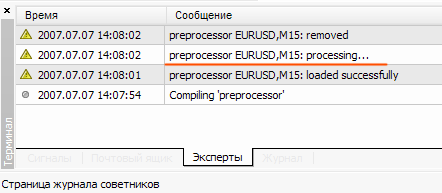
void Print( ...)
もうひとつ類似の関数です。Expert Advisorのジャーナルにメッセージを表示します。
Print(“processing...”);
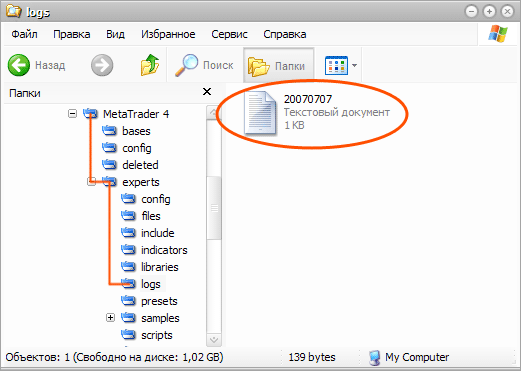
また、ジャーナルは、お持ちのコンピュータのフォルダMetaTrader 4\experts\logs: の対応するファイル(ファイル名は日付に対応しています)にメッセージをすべて保存します。
3つの関数に関するメモもいくつか作成します。配列は表示することができず、パラメータのように単純にそれらを指し示すだけです。それらはエレメントごとに表示されます。たとえば、以下のようにです。
for(int a=0;a<100;a++)
Alert("Close[",a,"]=",Close[a]);
各関数には最大 64 個のパラメータを表示することが可能です。関数Alert の呼び出しも毎回 Expert Advisor のジャーナルに書き込まれます。ある点の後4つの番号まで正確にdouble タイプが表示されます。
テクニカルインディケータ
Expert Advisor はほとんどすべてテクニカルインディケータを使用しています。 インストールファイル(MACD サンプル)に入っているシンプルな EA を見れば、それがテクニカルインディケータを使用しているのがわかります。ここからは利用可能なテクニカルインディケータの値を取得する方法を学んでいきます。テクニカルインディケータにはそれぞれ対応する関数があり、それは任意の有効な銘柄やタイムフレームで値をカウントすることができるものです。そして今このインディケータがチャート上で開いていても気にする必要はありません。それは問題にはなりません。
ここでテクニカルインディケータの関数パラメータを詳しく見ていきます。実際それら関数の大半は反復されます。
たとえば、詳しく説明しようとしている関数のテクニカルインディケータ値をカウントする最初の引数 2 つと最後の 1 つは似通っています。
- シンボル -テクニカルインディケータ値をカウントするために使用する銘柄(通貨ペア)を決定する1番目の引数すなわちどのチャートに対してテクニカルインディケータが使用されるか。現行チャートでインディケータを使用するには、定数 NULL (または 0)を用います。ここで現行チャートとはスクリプト(Expert Advisor、インディケータ)を開始するチャートです。もう一つ別の銘柄が必要な場合は、その名前を文字列として使用できます("EURUSD"、"GBPUSD"など)。
- タイムフレーム -2番目の引数。どのタイムフレームでインディケータが使用されるか定義します。現行チャートで使われているタイムフレームが必要であれば、 0 (ゼロ)とします。別のタイムフレームが必要であれば、定義済み定数を使用します。
- PERIOD_M1 - 1 分
- PERIOD_M5 - 5 分
- PERIOD_M15 - 15 分
- PERIOD_M30 - 30 分
- PERIOD_H1 - 1 時間
- PERIOD_H4 - 4 時間
- PERIOD_D1 - 1 日
- PERIOD_W1 - 1 週間
- PERIOD_MN1 - 1 月
- シフト -どのバーでインディケータが使用されるかを決定する最後の引数。最初の記事を思い出してください。最終バーの終値を求めるには、ゼロから始まるインデックを使用しました。すなわち、Close [0] -最終バーの終値。Close[1]-最後から2番目のバーの終値、など。この引数は配列内のインデックスと同様に動作します。最終バーのインディケータ値を求めるには、シフトが 0、最後から2番目のバーではシフトは 1、などです。
テクニカルインディケータは複数バーでカウントするために平均値 を使用することがよくあります。すなわち、複数バーで異なる価格(開始、終了等)を取り、明確な方法を用いて平均値を求めるのです。またひじょうに頻繁にシフトが使用されます。よってパラメータの中で、以下を見つけることができます。
- applied_price -平均値を得るのにどのタイプの価格を使用するか定義します。以下は使用する価格を選択するための定義済み定数です。
- PRICE_CLOSE-終値
- PRICE_OPEN -始値
- PRICE_HIGH -高値
- PRICE_LOW -安値
- PRICE_MEDIAN -平均価格(高値 + 安値)÷ 2
- PRICE_TYPICAL - 代表値(高値 + 安値 + 終値)÷ 3
- PRICE_WEIGHTED -加重終値(高値 + 安値 + 終値 + 終値)÷ 4
- ma_method -平均値を受け取るために使用される方法を定義します。以下は方法選択のための定義済み定数です。
- MODE_SMA -単純移動平均
- MODE_EMA -指数移動平均
- MODE_SMMA -平滑化移動平均
- MODE_LWMA -線形加重移動平均
- period -平均値を取得するためにバーを何本使用するか定義します。
- ma_shift -バーの正中線移動シフトが正であれば、線は右に移動します。逆に、シフトが負であれば、線は左に移動します。
上記パラメータはひじょうに頻繁に生じます。そのようなパラメータを見たら、この関数が値の計算に平均値を使用していることを理解します。値がどの程度正確に計算されるか、平均値がどの部分に取り入れらえているか知るには、各関数の短い説明のあとにあるリンクを利用してください。
もうひとつ重要な点があります。これらインディケータ(関数)はすべて2つのカテゴリーに分類できるのです。
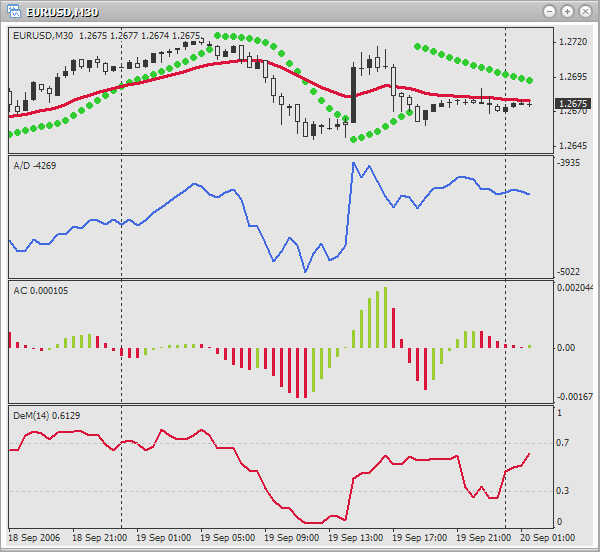
- シンプル -インディケータに値が1つだけの場合例:Acceleration/Deceleration (AC)、 Accumulation/Distribution (A/D)、DeMarker (DeM) 等。すなわち、インディケーにライン/ヒストグラムが1つだけあり、その値が適切な関数呼び出し時に返されるのです。1チャートで使用されるシンプルインディケータをいくつか以下に挙げています。
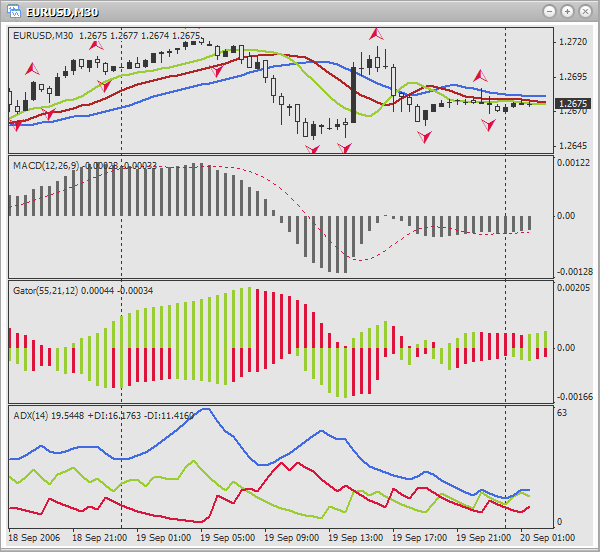
- complex -インディケータに複数の値(ライン)がある場合。例:アリゲータ、平均方向性指数(ADX)、ボリンジャーバンド(BB)、移動平均収束/拡散指標(MACD)等。そのような場合、インディケータがその値(ライン)を返すか指示する必要があります。このために、複雑なインディケータの関数ではすべてパラメータ「モード」を使用します。指示した特定の定数を用いて何が返されるか、です。あるチャートで使用される複雑なインディケータをいくつか以下に挙げています。
各関数説明はわかりやすい絵、用途説明(何が何をおこなっているか見やすくするため色付きになっています)、インディケータ説明へのリンク(トレーディングでの利用法、インディケータの意味)でさらに解りやすくなっています。それでインディケータをよく知り、実践で使用できるはずです。関数の使用法を理解するには本稿の関数説明を読み、例を見ることをお薦めします。今後、引数それぞれの割り当てを覚えるには、MetaEditor の「ヘルプ」をご利用ください。ホットキー Ctrl+T でウィンドウ ToolBox を開き、タブ ヘルプに行きます。そこにはパラメータ説明、また全関数の便利なリストもありますから、必要とするものが簡単にみつかるでしょう。「ヘルプ」の言語はメニュー閲覧する → 言語で変更可能です。その後、MetaEditor を再起動します。
Acceleration/Deceleration (AC)
インディケータ Acceleration/Deceleration (AC) は価格変動のスピードを変える(加速、減速)のに使用します。https://www.metatrader5.com/en/terminal/help/indicators/bw_indicators/ao
関数プロトタイプ:
double iAC(string symbol, int timeframe, int shift)
パラメータ:
- シンボル -テクニカルインディケータ値を計算するためにどの銘柄(通貨ペア)を使用するか定義します。現行(アクティブな)銘柄(チャート)が必要な場合は、NULL(または 0)を使用します。
- タイムフレーム -どのタイムフレームでインディケータが使用されるか定義します。現期間に対しては0 または次の定数のひとつを使用します。:PERIOD_M1、PERIOD_M5、PERIOD_M15、 PERIOD_M30、PERIOD_H1、PERIOD_H4、PERIOD_D1、 PERIOD_W1、PERIOD_MN1。
- シフト -どのバーでインディケータが使用されるかを定義します。
使用例:
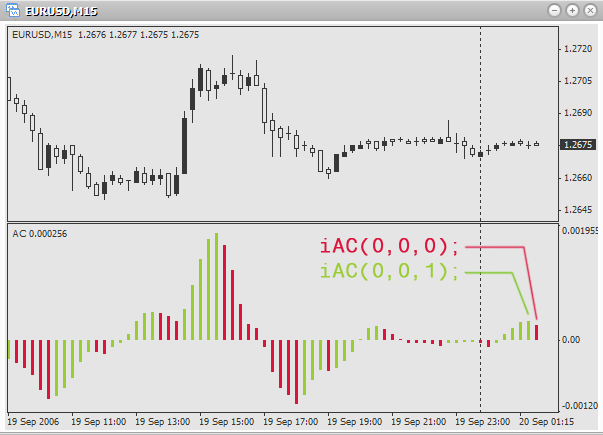
double ac;

ac=iAC(0,0,0);
// acceleration of the last bar on the active chart and timeframe

ac=iAC(0,0,1);
// acceleration of the last but one bar on the active chart and timeframe

ac=iAC("GBPUSD",PERIOD_M30,0);
// acceleration of the last bar on the chart GBPUSD, timeframe - 30 minutes
Accumulation/Distribution (A/D)
インディケータ Accumulation/Distribution (A/D) はボリューム計算によって価格変動を確認するために使用されます。
https://www.metatrader5.com/en/terminal/help/indicators/volume_indicators/ad
関数プロトタイプ:
double iAD(string symbol, int timeframe, int shift)
パラメータ:
- シンボル -テクニカルインディケータ値を計算するためにどの銘柄(通貨ペア)を使用するか定義します。現行(アクティブな)銘柄(チャート)が必要な場合は、NULL(または 0)を使用します。
- タイムフレーム -どのタイムフレームでインディケータが使用されるか定義します。現期間に対しては0 または次の定数のひとつを使用します。:PERIOD_M1、PERIOD_M5、PERIOD_M15、 PERIOD_M30、PERIOD_H1、PERIOD_H4、PERIOD_D1、 PERIOD_W1、PERIOD_MN1。
- シフト -どのバーでインディケータが使用されるかを定義します。
使用例:
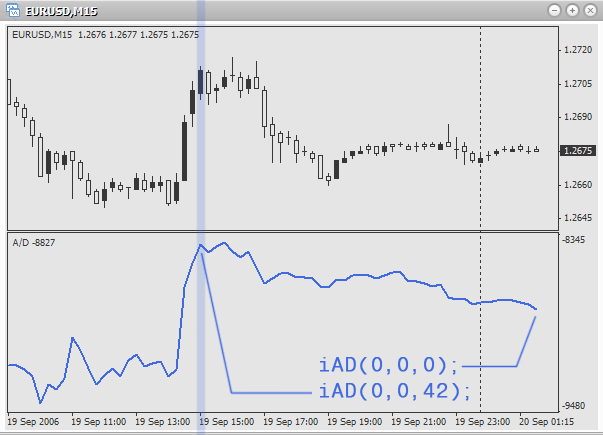
double ad;

ad=iAD(0,0,0);
// accumulation on the last bar on the current chart and period

ad=iAD(0,0,Bars-1);
// accumulation on the first available bar, active chart and period

ad=iAD("GBPUSD",PERIOD_M5,5);
// accumulation on the 6th last bar on GBPUSD, period - 5 minutes
アリゲータ
インディケータ、アリゲータはフラクタル幾何学と非線形力学を用いた3つの移動平均の組み合わせです。
https://www.metatrader5.com/en/terminal/help/indicators/bw_indicators/alligator
関数プロトタイプ:
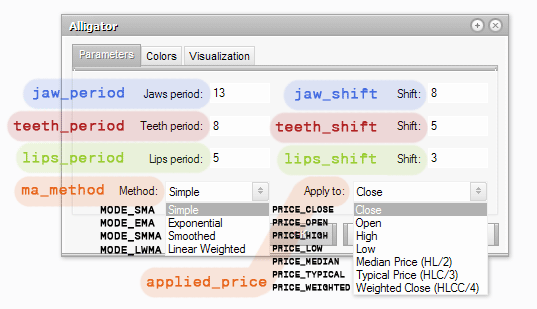
double iAlligator( string symbol, int timeframe, int jaw_period, int jaw_shift, int teeth_period,
                   int teeth_shift, int lips_period, int lips_shift, int ma_method, int applied_price,
                   int mode, int shift)
パラメータ:
- シンボル -テクニカルインディケータ値を計算するためにどの銘柄(通貨ペア)を使用するか定義します。現行(アクティブな)銘柄(チャート)が必要な場合は、NULL(または 0)を使用します。
- タイムフレーム -どのタイムフレームでインディケータが使用されるか定義します。現期間に対しては0 または次の定数のひとつを使用します。:PERIOD_M1、PERIOD_M5、PERIOD_M15、 PERIOD_M30、PERIOD_H1、PERIOD_H4、PERIOD_D1、 PERIOD_W1、PERIOD_MN1。
- jaw_period -アリゲータの顎(ブルーのライン)の平均期間
- jaw_shift -アリゲータの顎の移動
- teeth_period -アリゲータの歯(赤のライン)の平均期間
- teeth_shift -アリゲータの歯の移動
- lips_period -アリゲータのくちびる(グリーンのライン)の平均期間
- lips_shift -アリゲータのくちびるの移動
- ma_method -平均値を受け取るために使用される方法を定義します。以下は方法選択のための定義済み定数です。
- MODE_SMA -単純移動平均
- MODE_EMA -指数移動平均
- MODE_SMMA -平滑化移動平均
- MODE_LWMA -線形加重移動平均
- applied_price -使用される価格(何が平均化されるか)を定義します。以下は使用する価格を選択するための定義済み定数です。
- PRICE_CLOSE-終値
- PRICE_OPEN -始値
- PRICE_HIGH -高値
- PRICE_LOW -安値
- PRICE_MEDIAN -平均価格(高値 + 安値)÷ 2
- PRICE_TYPICAL - 代表値(高値 + 安値 + 終値)÷ 3
- PRICE_WEIGHTED -加重終値(高値 + 安値 + 終値 + 終値)÷ 4
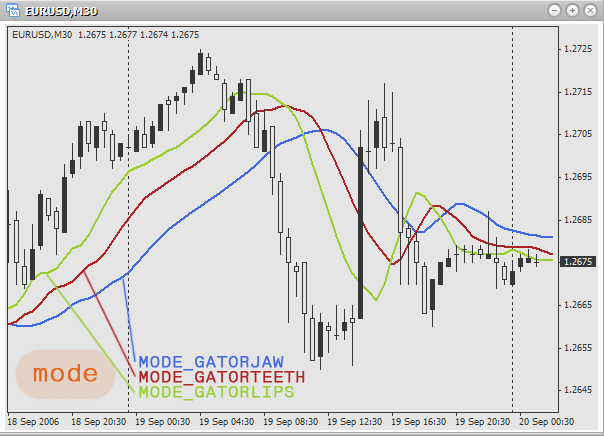
- モード -何の値(顎、歯、くちびる)を求めたいかを定義します。選択には以下の定数の一つを使用します。
- MODE_GATORJAW -アリゲータの顎のライン(ブルー)
- MODE_GATORTEETH -アリゲータの歯のライン(赤)
- MODE_GATORLIPS -アリゲータのくちびるのライン(グリーン)
- シフト -どのバーでインディケータが使用されるかを決定します。
チャートで「アリゲータ」を使用するとき、関数の引数が何に影響するか見ます。そういう類推が役に立つのです。
パラメータ 「モード」 によって何が返されるか定義します。
使用例:
double jaw;
double teeth;
double lips;

jaw=iAlligator(0,0,13,8,8,5,5,3,MODE_SMA,PRICE_MEDIAN,MODE_GATORJAW,0);
// find the values of "jaws" (blue line) on the current chart and period.
// Here simple moving average is used, price – average. Periods
// of averaging for jaws, teeth and lips – 13, 8 and 8 accordingly. Shift:
// 5, 5 and 3 accordingly. The value is taken for the last bar.

teeth=iAlligator(“EURUSD”,PERIOD_H1,128,96,64,0,0,0,MODE_EMA,PRICE_TYPICAL,MODE_GATORTEETH,1);
// find the values of "teeth" (red line) on an hour chart EURUSD.
// Exponential moving average and typical price are used.
// Periods of averaging: 128, 96 and 64. 「シフト」は使用されていません。The value
// is taken for the last but one bar.

lips=iAlligator(“GBPUSD”,PERIOD_D1,21,18,13,5,3,0,MODE_SMMA,PRICE_WEIGHTED,MODE_GATORLIPS,5);
// find the values of "lips" (green line) on a daily chart GBPUSD.
// Uses smoothed moving average and weighted close price.
// Periods of averaging: 21, 18 and 13. Shift: 5, 3 and 0. The value
// is taken for the 5th last bar.
平均方向性指数(ADX)
インディケータ 平均方向性指数(ADX) は価格トレンドの存在を判断するのに使用されます。
https://www.metatrader5.com/en/terminal/help/indicators/trend_indicators/admi
関数プロトタイプ:
double iADX(string symbol,int timeframe,int period,int applied_price,int mode,int shift)
パラメータ:
- シンボル -テクニカルインディケータ値を計算するためにどの銘柄(通貨ペア)を使用するか定義します。現行(アクティブな)銘柄(チャート)が必要な場合は、NULL(または 0)を使用します。
- タイムフレーム -どのタイムフレームでインディケータが使用されるか定義します。現期間に対しては0 または次の定数のひとつを使用します。:PERIOD_M1、PERIOD_M5、PERIOD_M15、 PERIOD_M30、PERIOD_H1、PERIOD_H4、PERIOD_D1、 PERIOD_W1、PERIOD_MN1。
- 周期 -平均値を求めるのに使用されるバー本数
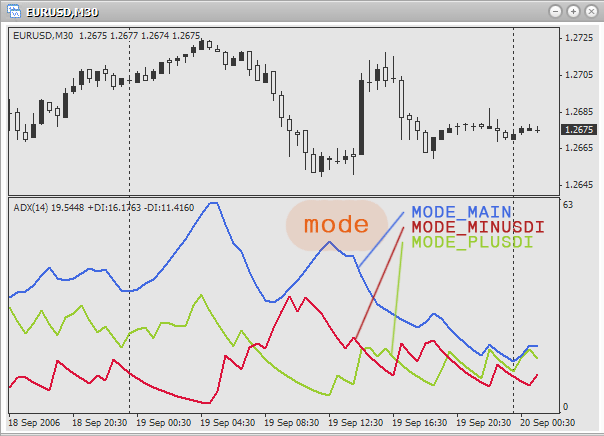
- モード -値が受け取られるラインを選択します。以下の定義済み定数の一つを使用します。
- MODE_MAIN -メインライン
- MODE_PLUSDI -ライン+DI
- MODE_MINUSDI -ライン –DI
- シフト -どのバーでインディケータが使用されるかを定義します。
パラメータ 「モード」 によって何が返されるか定義します。
使用例:
double main;    // main line
double plusDi;  // line +DI
double minusDi; // line -DI

main=iADX(0,0,3,PRICE_CLOSE,MODE_MAIN,0);
// find the value of the main line on the active chart and period on the last bar.
// Uses averaging on 3 bars, uses close price.

plusDi=iADX(“USDCAD”,PERIOD_M1,6,PRICE_OPEN,MODE_PLUSDI,1);
// find the value of line +DI on the minute chart USDCAD on the second last bar.
// Uses averaging on 6 bars, uses open price.

minusDi=iADX(“AUDUSD”,PERIOD_H1,10,PRICE_HIGH,MODE_MINUSDI,5);
// find the value of line -DI on the hour chart AUDUSD on the 6th last bar.
// Uses averaging on 10 bars, uses maximal price.
Average True Range (ATR)
インディケータ Average True Range (ATR) は市場の変動性を判断するのに使用されます。
https://www.metatrader5.com/en/terminal/help/indicators/oscillators/atr
関数プロトタイプ:
double iATR(string symbol,int timeframe,int period,int shift)
パラメータ:
- シンボル -テクニカルインディケータ値を計算するためにどの銘柄(通貨ペア)を使用するか定義します。現行(アクティブな)銘柄(チャート)が必要な場合は、NULL(または 0)を使用します。
- タイムフレーム -どのタイムフレームでインディケータが使用されるか定義します。現期間に対しては0 または次の定数のひとつを使用します。:PERIOD_M1、PERIOD_M5、PERIOD_M15、 PERIOD_M30、PERIOD_H1、PERIOD_H4、PERIOD_D1、 PERIOD_W1、PERIOD_MN1。
- 周期 -平均値を求めるのに使用されるバー本数
- シフト -どのバーでインディケータが使用されるかを定義します。
使用例:
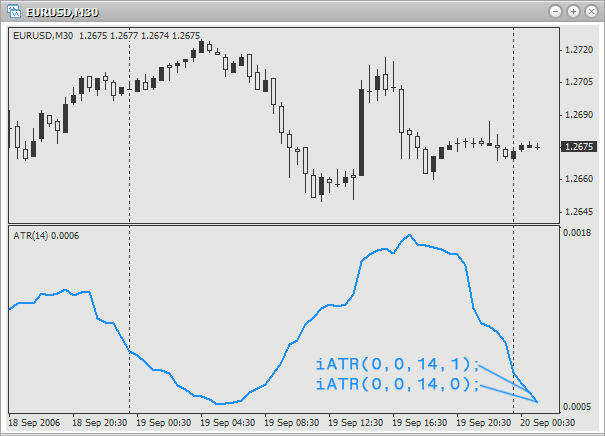
double atr;

atr=iATR(0,0,15,0);
// volatility of the last bar on the active chart and period.
// Uses 15 bars to get the mean value.

atr=iATR(“EURUSD”,PERIOD_M15,5,1);
// volatility of the last but one bar on a 15 minute chart EURUSD.
// Uses 5 bars to get the mean value.

atr=iATR(“USDCAD”,PERIOD_H1,32,0);
// volatility of the last bar on an hour chart USDCAD.
// Uses 32 bars to get the mean value.
ビル・ウィリアムズのオーサムオシレータ(AO)
インディケータ、ビル・ウィリアムズの オーサムオシレータ(AO) は市場変動の強さを判断するのに使用されます。<br1/>
https://www.metatrader5.com/en/terminal/help/indicators/bw_indicators/awesome
関数プロトタイプ:
double iAO( string symbol, int timeframe, int shift)
パラメータ:
- シンボル -テクニカルインディケータ値を計算するためにどの銘柄(通貨ペア)を使用するか定義します。現行(アクティブな)銘柄(チャート)が必要な場合は、NULL(または 0)を使用します。
- タイムフレーム -どのタイムフレームでインディケータが使用されるか定義します。現期間に対しては0 または次の定数のひとつを使用します。:PERIOD_M1、PERIOD_M5、PERIOD_M15、 PERIOD_M30、PERIOD_H1、PERIOD_H4、PERIOD_D1、 PERIOD_W1、PERIOD_MN1。
- シフト -どのバーでインディケータが使用されるかを定義します。
使用例:
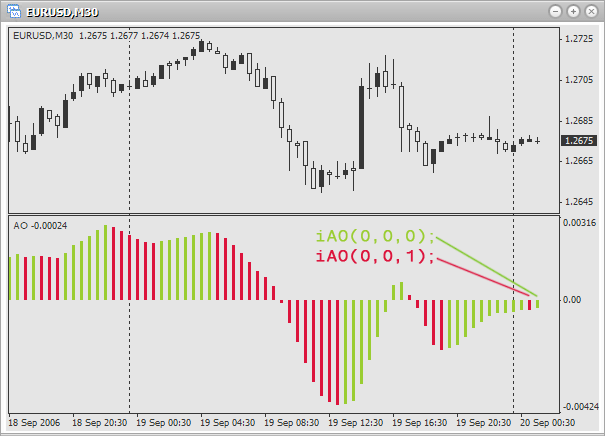
double ao;

ao=iAO(0,0,0);
// moving force of the last bar on the active chart and period

ao=iAO(“EURUSD”,PERIOD_M5,0);
// moving force of the last bar on 5-minute chart EURUSD

ao=iAO(“EURAUD”,PERIOD_W1,1);
// moving force of the last but one bar on a weekly chart EURAUD
ベアーズパワー
インディケータ ベアーズパワー は『ベアーズ』パワーのバランスを推定するのに使用されます。
http://www.fibo-forex.ru/pages.php?page=1799
関数プロトタイプ:
double iBearsPower(string symbol,int timeframe,int period,int applied_price,int shift)
パラメータ:
- シンボル -テクニカルインディケータ値を計算するためにどの銘柄(通貨ペア)を使用するか定義します。現行(アクティブな)銘柄(チャート)が必要な場合は、NULL(または 0)を使用します。
- タイムフレーム -どのタイムフレームでインディケータが使用されるか定義します。現期間に対しては0 または次の定数のひとつを使用します。:PERIOD_M1、PERIOD_M5、PERIOD_M15、 PERIOD_M30、PERIOD_H1、PERIOD_H4、PERIOD_D1、 PERIOD_W1、PERIOD_MN1。
- 周期 -平均値を求めるのに使用されるバー本数
- applied_price -使用される価格(何が平均化されるか)を定義します。以下は使用する価格を選択するための定義済み定数です。
- PRICE_CLOSE-終値
- PRICE_OPEN -始値
- PRICE_HIGH -高値
- PRICE_LOW -安値
- PRICE_MEDIAN -平均価格(高値 + 安値)÷ 2
- PRICE_TYPICAL - 代表値(高値 + 安値 + 終値)÷ 3
- PRICE_WEIGHTED -加重終値(高値 + 安値 + 終値 + 終値)÷ 4
- シフト -どのバーでインディケータが使用されるかを定義します。
使用例:
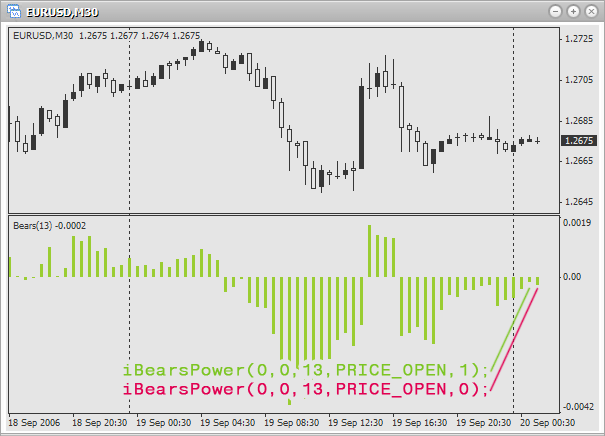
double bp;

bp=iBearsPower(0,0,5,PRICE_OPEN,0);
// balance of the last bar on the active chart and period. 平均化と始値には バーを5本 使用します。

bp=iBearsPower("EURUSD",PERIOD_M5,32,PRICE_CLOSE,1);
// balance of the last but one bar on 5-minute chart EURUSD. 平均化と終値にはバーを32 本使用します。

bp=iBearsPower("EURGBP",PERIOD_D1,51,PRICE_MEDIAN,0);
// balance of the last bar on a daily chart EURGBP. 平均化と平均価格にはバーを51 本使用します。
ボリンジャーバンド(BB)
インディケータ ボリンジャーバンド(BB) は価格変動の正常範囲の上下限を決定するのに使用されます。
https://www.metatrader5.com/en/terminal/help/indicators/trend_indicators/bb
関数プロトタイプ:
double iBands( string symbol, int timeframe, int period, int deviation, int bands_shift,
               int applied_price, int mode, int shift)
パラメータ:
- シンボル -テクニカルインディケータ値を計算するためにどの銘柄(通貨ペア)を使用するか定義します。現行(アクティブな)銘柄(チャート)が必要な場合は、NULL(または 0)を使用します。
- タイムフレーム -どのタイムフレームでインディケータが使用されるか定義します。現期間に対しては0 または次の定数のひとつを使用します。:PERIOD_M1、PERIOD_M5、PERIOD_M15、 PERIOD_M30、PERIOD_H1、PERIOD_H4、PERIOD_D1、 PERIOD_W1、PERIOD_MN1。
- 周期 -平均値を求めるのに使用されるバー本数
- 偏差 -メインラインからの偏差
- bands_shift -価格に関するシフト
- applied_price -使用される価格(何が平均化されるか)を定義します。以下は使用する価格を選択するための定義済み定数です。
- PRICE_CLOSE-終値
- PRICE_OPEN -始値
- PRICE_HIGH -高値
- PRICE_LOW -安値
- PRICE_MEDIAN -平均価格(高値 + 安値)÷ 2
- PRICE_TYPICAL - 代表値(高値 + 安値 + 終値)÷ 3
- PRICE_WEIGHTED -加重終値(高値 + 安値 + 終値 + 終値)÷ 4
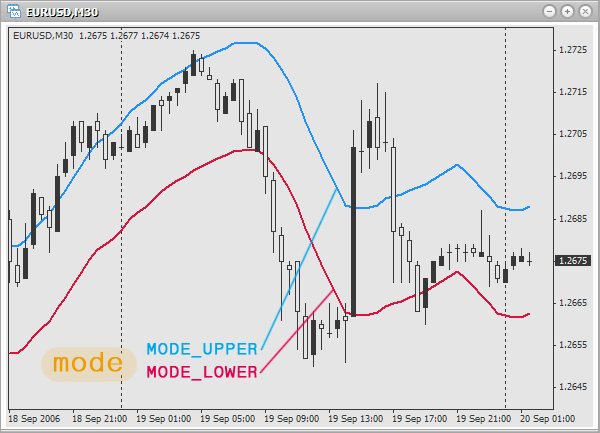
- モード -値を求めるラインを選択します。以下の定義済み定数の一つを使用します。
- MODE_UPPER -上側のライン
- MODE_LOWER -下側のライン
- シフト -どのバーでインディケータが使用されるかを決定します。
パラメータ 「モード」 によって何が返されるか定義します。
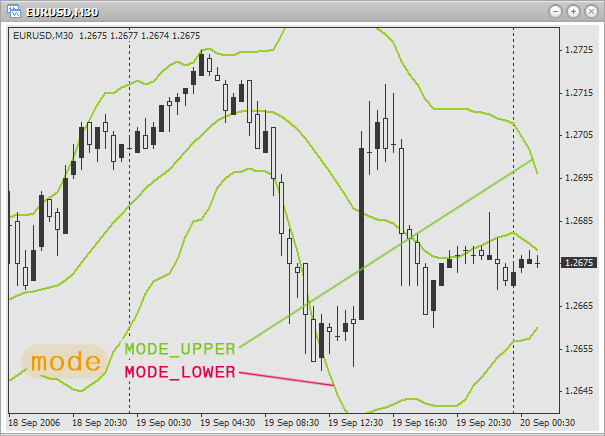
使用例:
double bb;

bb=iBands(0,0,20,2,0,PRICE_LOW,MODE_LOWER,0);
// lower limit of the last bar on the active chart and period.
// Use 20 bars for averaging, and the minimal price.
// Deviation from the main line is 2, shift is not used.

bb=iBands("EURUSD",PERIOD_H1,13,2,3,PRICE_HIGH,MODE_UPPER,1);
// upper limit of the last but one bar on an hour chart EURUSD.
// Use 13 bars for averaging, and the maximal price.
// Deviation from the main line is 2, shift is 3 bars.

bb=iBands("EURGBP",PERIOD_D1,21,3,4,PRICE_HIGH,MODE_UPPER,0);
// upper limit of the last bar on a daily chart EURGBP.
// Use 21 bars for averaging, and the maximal price.
// Deviation from the main line is 2, shift is 4 bars.
ブルズパワー
インディケータ ブルズパワー は『ブルズ』パワーのバランスを推定するのに使用されます。
http://www.forexdealer.net/help/bul_hlp.htm
関数プロトタイプ:
double iBullsPower(string symbol, int timeframe, int period, int applied_price, int shift)
パラメータ:
- シンボル -テクニカルインディケータ値を計算するためにどの銘柄(通貨ペア)を使用するか定義します。現行(アクティブな)銘柄(チャート)が必要な場合は、NULL(または 0)を使用します。
- タイムフレーム -どのタイムフレームでインディケータが使用されるか定義します。現期間に対しては0 または次の定数のひとつを使用します。:PERIOD_M1、PERIOD_M5、PERIOD_M15、 PERIOD_M30、PERIOD_H1、PERIOD_H4、PERIOD_D1、 PERIOD_W1、PERIOD_MN1。
- 周期 -平均値を求めるのに使用されるバー本数
- applied_price -使用される価格(何が平均化されるか)を定義します。以下は使用する価格を選択するための定義済み定数です。
- PRICE_CLOSE-終値
- PRICE_OPEN -始値
- PRICE_HIGH -高値
- PRICE_LOW -安値
- PRICE_MEDIAN -平均価格(高値 + 安値)÷ 2
- PRICE_TYPICAL - 代表値(高値 + 安値 + 終値)÷ 3
- PRICE_WEIGHTED -加重終値(高値 + 安値 + 終値 + 終値)÷ 4
- シフト -どのバーでインディケータが使用されるかを決定します。
使用例:
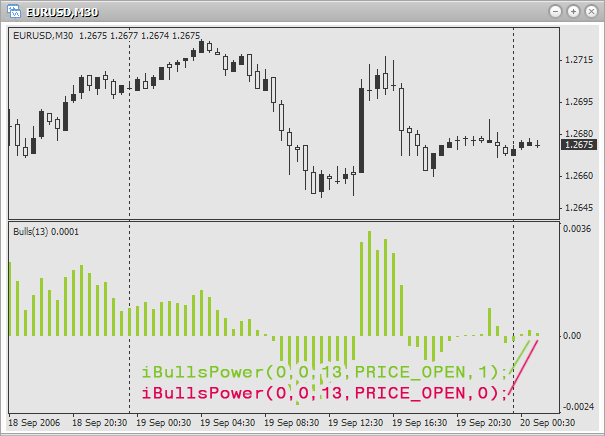
double bp;

bp=iBullsPower(0,0,10,PRICE_CLOSE,1);
// balance of the last but one bar on the active chart and period. Use 10 bars for averaging
// and close price.

bp=iBullsPower("EURGBP",PERIOD_M1,21,PRICE_HIGH,1);
// balance of the last bar on a minute chart EURGBP. Use 21 bars for averaging and the maximal price.

bp=iBullsPower("EURUSD",PERIOD_H1,33,PRICE_MEDIAN,0);
// balance of the last bar on an hour chart EURUSD. Use 33 bars for averaging and the average price.
コモディティチャンネル指数(CCI)
インディケータ コモディティチャンネル指数(CCI) はその価格の平均統計価格からの偏差を測定するのに使用されます。
https://www.metatrader5.com/en/terminal/help/indicators/oscillators/cci
関数プロトタイプ:
double iCCI( string symbol, int timeframe, int period, int applied_price, int shift)
パラメータ:
- シンボル -テクニカルインディケータ値を計算するためにどの銘柄(通貨ペア)を使用するか定義します。現行(アクティブな)銘柄(チャート)が必要な場合は、NULL(または 0)を使用します。
- タイムフレーム -どのタイムフレームでインディケータが使用されるか定義します。現期間に対しては0 または次の定数のひとつを使用します。:PERIOD_M1、PERIOD_M5、PERIOD_M15、 PERIOD_M30、PERIOD_H1、PERIOD_H4、PERIOD_D1、 PERIOD_W1、PERIOD_MN1。
- 周期 -平均値を求めるのに使用されるバー本数
- applied_price -使用される価格(何が平均化されるか)を定義します。以下は使用する価格を選択するための定義済み定数です。
- PRICE_CLOSE-終値
- PRICE_OPEN -始値
- PRICE_HIGH -高値
- PRICE_LOW -安値
- PRICE_MEDIAN -平均価格(高値 + 安値)÷ 2
- PRICE_TYPICAL - 代表値(高値 + 安値 + 終値)÷ 3
- PRICE_WEIGHTED -加重終値(高値 + 安値 + 終値 + 終値)÷ 4
- シフト -どのバーでインディケータが使用されるかを決定します。
使用例:
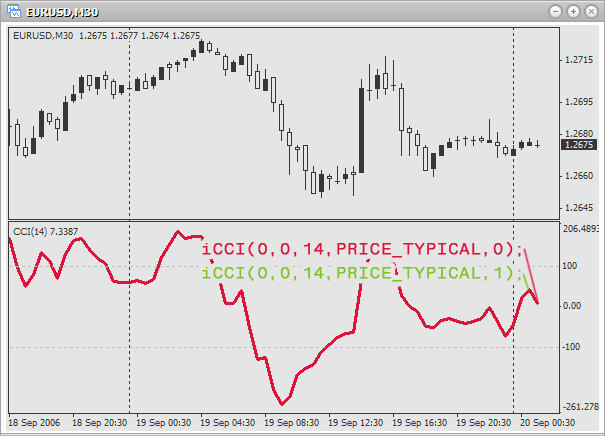
double cci;

cci=iCCI(0,0,14,PRICE_TYPICAL,0);
// index of the last bar on the active chart and period.
// Use 14 bars for finding the mean value and
// typical price.

cci=iCCI("EURUSD",PERIOD_M1,21,PRICE_HIGH,1);
// index of the last but one bar on a minute chart EURUSD.
// Use 21 bars for finding the mean value and
// maximal price.

cci=iCCI("EURGBP",PERIOD_D1,7,PRICE_CLOSE,0);
// index of the last bar on a daily chart EURGBP.
// Use 7 bars for finding the mean value and
// close price.
DeMarker (DeM)
インディケータ DeMarker (DeM) は過去のバーの価格差を基にした価格反転を予測するのに使用します。
https://www.metatrader5.com/en/terminal/help/indicators/oscillators/demarker
関数プロトタイプ:
double iDeMarker( string symbol, int timeframe, int period, int shift)
パラメータ:
- シンボル -テクニカルインディケータ値を計算するためにどの銘柄(通貨ペア)を使用するか定義します。現行(アクティブな)銘柄(チャート)が必要な場合は、NULL(または 0)を使用します。
- タイムフレーム -どのタイムフレームでインディケータが使用されるか定義します。現期間に対しては0 または次の定数のひとつを使用します。:PERIOD_M1、PERIOD_M5、PERIOD_M15、 PERIOD_M30、PERIOD_H1、PERIOD_H4、PERIOD_D1、 PERIOD_W1、PERIOD_MN1。
- 周期 -平均値を求めるのに使用されるバー本数
- シフト -どのバーでインディケータが使用されるかを定義します。
使用例:
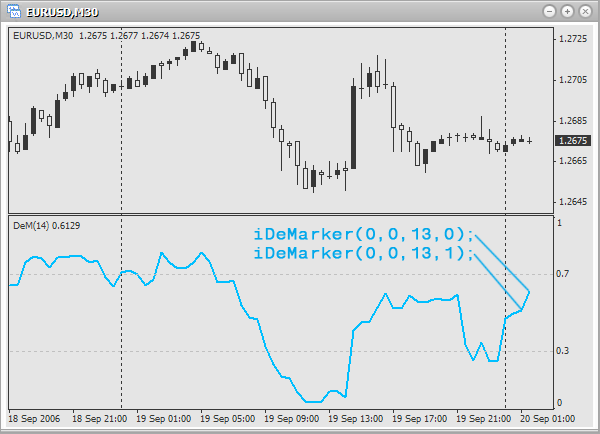
double dm;

dm=iDeMarker(0,0,13,0);
// DeMarker value of the last bar on the current chart and period.
// Use 13 bars to find the mean value.

dm=iDeMarker("EURJPY",PERIOD_H4,51,1);
// DeMarker value of the last but one bar on 4-hour chart EURJPY.
// Use 51 bars to find the mean value.

dm=iDeMarker("USDCAD",PERIOD_M30,21,0);
// DeMarker value of the last bar on 30-minutes chart USDCAD.
// Use 21 bars to find the mean value.
エンベロープ
インディケータ エンベロープ は 2 つの移動平均を基に価格変動の限度を決定するのに使用されます。https://www.metatrader5.com/en/terminal/help/indicators/trend_indicators/envelopes
関数プロトタイプ:
double iEnvelopes( string symbol, int timeframe, int ma_period, int ma_method, int ma_shift,
                   int applied_price, double deviation, int mode, int shift)
パラメータ:
- シンボル -テクニカルインディケータ値を計算するためにどの銘柄(通貨ペア)を使用するか定義します。現行(アクティブな)銘柄(チャート)が必要な場合は、NULL(または 0)を使用します。
- タイムフレーム -どのタイムフレームでインディケータが使用されるか定義します。現期間に対しては0 または次の定数のひとつを使用します。:PERIOD_M1、PERIOD_M5、PERIOD_M15、 PERIOD_M30、PERIOD_H1、PERIOD_H4、PERIOD_D1、 PERIOD_W1、PERIOD_MN1。
- ma_period -メインラインを求めるのに使用されるバー本数
- ma_method -平均値を求めるために使用する方法を定義します。以下は方法選択のための定義済み定数です。
- MODE_SMA -単純移動平均
- MODE_EMA -指数移動平均
- MODE_SMMA -平滑化移動平均
- MODE_LWMA -線形加重移動平均
- ma_shift -バー内でのインディケータラインの移動シフトが正であれば、インディケータラインは右に移動します。逆に、シフトが負であれば、ラインは左に移動します。
- applied_price -使用される価格(何が平均化されるか)を定義します。以下は使用する価格を選択するための定義済み定数です。
- PRICE_CLOSE-終値
- PRICE_OPEN -始値
- PRICE_HIGH -高値
- PRICE_LOW -安値
- PRICE_MEDIAN -平均価格(高値 + 安値)÷ 2
- PRICE_TYPICAL - 代表値(高値 + 安値 + 終値)÷ 3
- PRICE_WEIGHTED -加重終値(高値 + 安値 + 終値 + 終値)÷ 4
- deviation -パーセントで表示されるメインラインからの偏差例えば、0.1 と書けば 10%、 0.25 と書けば 25% などを意味します。
- モード -値を求めるラインを選択します。以下の定義済み定数の一つを使用します。
- MODE_UPPER -上側のライン
- MODE_LOWER -下側のライン
- シフト -どのバーでインディケータが使用されるかを決定します。
パラメータ 「モード」 によって何が返されるか定義します。
使用例:
double e;

e=iEnvelopes(0,0,21,MODE_SMA,0,PRICE_CLOSE,0.05,MODE_LOWER,0);
// lower limit of the last bar on the active chart and period.
// Use 21 bars and close price for finding the value of simple moving
// average. Shift is not used. Deviation from the main
// line: 5%.

e=iEnvelopes("EURUSD",PERIOD_H1,13,MODE_SMMA,3,PRICE_MEDIAN,0.15,MODE_UPPER,1);
// upper limit of the last but one bar on an hour chart EURUSD.
// Use 13 bars and average price for finding the value of smoothed moving
// average. Shift: 3 bars. Deviation from the main line: 15%.

e=iEnvelopes("EURAUD",PERIOD_D1,7,MODE_EMA,2,PRICE_CLOSE,0.20,MODE_LOWER,0);
// lower limit of the last bar on a daily chart EURAUD.
// Use 7 bars and close price for finding the value of exponential
// moving average. Shift: 2 bars. Deviation from the main
// line: 20%.
勢力指数(FRC)
インディケータ 勢力指数(FRC) は上昇のたびに『ブルズ』パワーを、下降のたびに『ベアズ』パワーを測定するのに使用されます。https://www.metatrader5.com/en/terminal/help/indicators/oscillators/fi
関数プロトタイプ:
double iForce( string symbol, int timeframe, int period, int ma_method,
               int applied_price, int shift)
パラメータ:
- シンボル -テクニカルインディケータ値を計算するためにどの銘柄(通貨ペア)を使用するか定義します。現行(アクティブな)銘柄(チャート)が必要な場合は、NULL(または 0)を使用します。
- タイムフレーム -どのタイムフレームでインディケータが使用されるか定義します。現期間に対しては0 または次の定数のひとつを使用します。:PERIOD_M1、PERIOD_M5、PERIOD_M15、 PERIOD_M30、PERIOD_H1、PERIOD_H4、PERIOD_D1、 PERIOD_W1、PERIOD_MN1。
- 周期 -平均値を求めるのに使用されるバー本数
- ma_period -メインラインを求めるのに使用されるバー本数
- ma_method -平均値を求めるのに使用する方法を定義します。以下は方法選択のための定義済み定数です。
- MODE_SMA -単純移動平均
- MODE_EMA -指数移動平均
- MODE_SMMA -平滑化移動平均
- MODE_LWMA -線形加重移動平均
- applied_price -使用される価格(何が平均化されるか)を定義します。以下は使用する価格を選択するための定義済み定数です。
- PRICE_CLOSE-終値
- PRICE_OPEN -始値
- PRICE_HIGH -高値
- PRICE_LOW -安値
- PRICE_MEDIAN -平均価格(高値 + 安値)÷ 2
- PRICE_TYPICAL - 代表値(高値 + 安値 + 終値)÷ 3
- PRICE_WEIGHTED -加重終値(高値 + 安値 + 終値 + 終値)÷ 4
- シフト -どのバーでインディケータが使用されるかを決定します。
使用例:
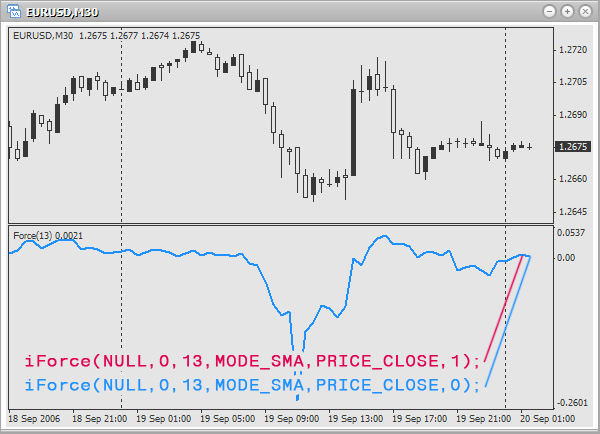
double f;

f=iForce(0,0,13,MODE_SMA,PRICE_CLOSE,0);
// force index of the last bar on the active chart and period. Period
// of averaging: 13 bars. Method of averaging: simple moving average.
// Use close price.

f=iForce("EURGBP",PERIOD_M5,21,MODE_LWMA,PRICE_HIGH,1);
// force index of the last but one bar on 5-minute chart EURGBP. Period
// of averaging: 21 bars. Method of averaging: linearly-weighted moving average.
// Use maximal price.

f=iForce("EURUSD",PERIOD_M1,32,MODE_SMMA,PRICE_MEDIAN,0);
// force index of the last bar on a minute chart EURUSD. Period
// of averaging: 32 bars. Method of averaging: smoothed moving average.
// Use average price.
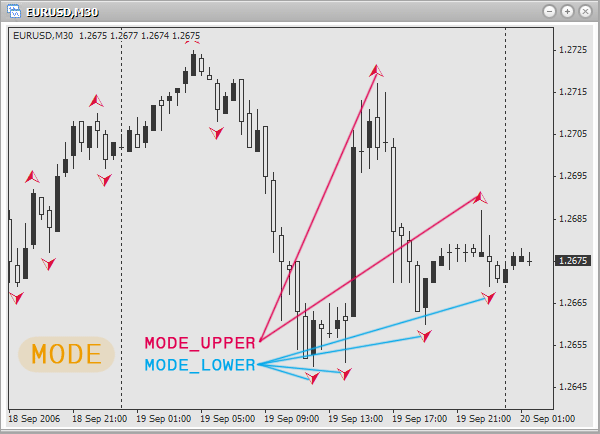
フラクタル
フラクタルはビル・ウィリアムズのトレーディングシステムの5つのインディケータの1つで、価格チャートの底と頂点を検出するのに使用されます。フラクタルはすべてのバーに表示されるわけではありません。よって、バーにフラクタルが現れない場合、関数はゼロを返します。
https://www.metatrader5.com/en/terminal/help/indicators/bw_indicators/fractals
関数プロトタイプ:
double iFractals( string symbol, int timeframe, int mode, int shift)
パラメータ:
- シンボル -テクニカルインディケータ値を計算するためにどの銘柄(通貨ペア)を使用するか定義します。現行(アクティブな)銘柄(チャート)が必要な場合は、NULL(または 0)を使用します。
- タイムフレーム -どのタイムフレームでインディケータが使用されるか定義します。現期間に対しては0 または次の定数のひとつを使用します。:PERIOD_M1、PERIOD_M5、PERIOD_M15、 PERIOD_M30、PERIOD_H1、PERIOD_H4、PERIOD_D1、 PERIOD_W1、PERIOD_MN1。
- モード -値が受け取られるラインを選択します。以下の定義済み定数が使用されます。
- MODE_UPPER -上部フラクタル
- MODE_LOWER -下部フラクタル
- シフト -どのバーでインディケータが使用されるかを定義します。
パラメータ 「モード」 によって何が返されるか定義します。
使用例:
double f;

f=iFractals(0,0,MODE_UPPER,0);
// upper fractal of the last bar on the active chart and
// period.

f=iFractals("USDCAD",PERIOD_M5,MODE_LOWER,1);
// lower fractal of the last but one bar on 5-minute chart
// USDCAD.

f=iFractals("USDJPY",PERIOD_D1,MODE_UPPER,0);
// upper fractal of the last bar on a daily chart USDJPY.
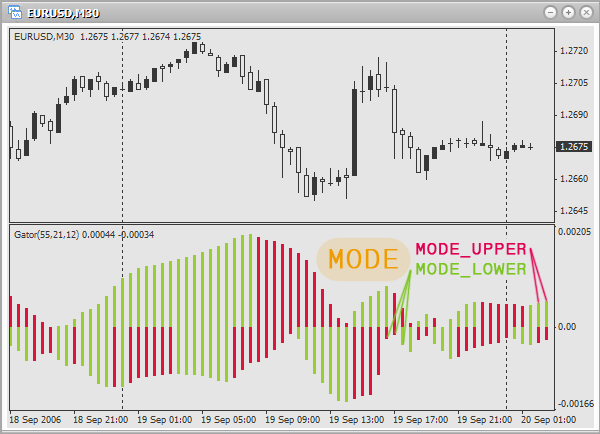
ゲイターオシレータ
ゲイターオシレータはインディケータ「アリゲータ」を基に作成されており、残高曲線の収束または発散程度を測定するのに使用されます。
https://www.metatrader5.com/en/terminal/help/indicators/bw_indicators/go
関数プロトタイプ:
double iGator( string symbol, int timeframe, int jaw_period, int jaw_shift, int teeth_period,
               int teeth_shift, int lips_period, int lips_shift, int ma_method,
               int applied_price, int mode, int shift)
パラメータ:
- シンボル -テクニカルインディケータ値を計算するためにどの銘柄(通貨ペア)を使用するか定義します。Use NULL (or 0), if you need the current (active) security (chart).
- タイムフレーム -どのタイムフレームでインディケータが使用されるか定義します。現期間に対しては0 または次の定数のひとつを使用します。:PERIOD_M1、PERIOD_M5、PERIOD_M15、 PERIOD_M30、PERIOD_H1、PERIOD_H4、PERIOD_D1、 PERIOD_W1、PERIOD_MN1。
- jaw_period -アリゲータの顎(ブルーのライン)の平均期間
- jaw_shift -アリゲータの顎の移動
- teeth_period -アリゲータの歯(赤のライン)の平均期間
- teeth_shift -アリゲータの歯の移動
- lips_period -アリゲータのくちびる(グリーンのライン)の平均期間
- lips_shift -アリゲータのくちびるの移動
- ma_method -平均値を求めるのに使用する方法を定義します。以下は方法選択のための定義済み定数です。
- MODE_SMA -単純移動平均
- MODE_EMA -指数移動平均
- MODE_SMMA -平滑化移動平均
- MODE_LWMA - 線形加重移動平均
- applied_price -使用される価格(何が平均化されるか)を定義します。以下は使用する価格を選択するための定義済み定数です。
- PRICE_CLOSE-終値
- PRICE_OPEN -始値
- PRICE_HIGH -高値
- PRICE_LOW -安値
- PRICE_MEDIAN -平均価格(高値 + 安値)÷ 2
- PRICE_TYPICAL - 代表値(高値 + 安値 + 終値)÷ 3
- PRICE_WEIGHTED -加重終値(高値 + 安値 + 終値 + 終値)÷ 4
- モード -何の値(顎、歯、くちびる)を求めたいかを定義します。選択には以下の定数の一つを使用します。
- MODE_UPPER -上部ヒストグラム
- MODE_LOWER -下部ヒストグラム
- シフト -どのバーでインディケータが使用されるかを決定します。
パラメータ 「モード」 によって何が返されるか定義します。
使用例:
double g;

g=iGator(0,0,13,8,8,0,0,0,MODE_SMA,PRICE_CLOSE,MODE_UPPER,0);
// upper histogram of the last bar on the active chart and period. Periods of
// averaging for jaw, teeth and lips accordingly: 13,8,8. Shift is not used.
// For averaging use close price and the method of a simple moving average.

g=iGator("EURGBP",PERIOD_M1,21,13,9,4,3,2,MODE_SMMA,PRICE_OPEN,MODE_LOWER,1);
// lower histogram of the last but one bar on a minute chart EURGBP. Periods of
// averaging for jaw, teeth and lips accordingly: 21,13,9. Shifts accordingly:
// 4,3 and 2. For averaging use open price and the method of smoothed
// moving average.

g=iGator("USDCAD",PERIOD_D1,51,21,13,8,5,4,MODE_EMA,PRICE_MEDIAN,MODE_UPPER,0);
// upper histogram of the last bar on a daily chart USDCAD. Periods of
// averaging for jaw, teeth and lips accordingly: 51,21,13. Shifts accordingly: 8,5 and 4.
// For averaging use average price and the method of exponential moving average.
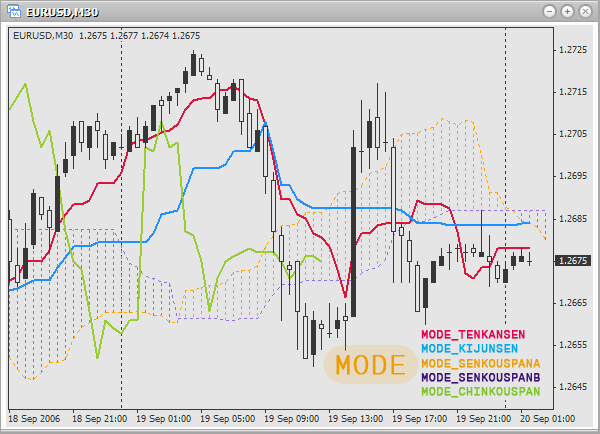
一目均衡表
インディケータ一目均衡表はトレンド、サポートおよびレジスタンスレベル、売りや買いのシグナルを定義するのに使用されます。
https://www.metatrader5.com/en/terminal/help/indicators/trend_indicators/ikh
関数プロトタイプ:
double iIchimoku( string symbol, int timeframe, int tenkan_sen, int kijun_sen,
                  int senkou_span_b, int mode, int shift)
パラメータ:
- シンボル -テクニカルインディケータ値を計算するためにどの銘柄(通貨ペア)を使用するか定義します。現行(アクティブな)銘柄(チャート)が必要な場合は、NULL(または 0)を使用します。
- タイムフレーム -どのタイムフレームでインディケータが使用されるか定義します。現期間に対しては0 または次の定数のひとつを使用します。:PERIOD_M1、PERIOD_M5、PERIOD_M15、 PERIOD_M30、PERIOD_H1、PERIOD_H4、PERIOD_D1、 PERIOD_W1、PERIOD_MN1。
- tenkan_sen -転換線の平均化期間
- kijun_sen-基準線の平均化期間
- senkou_span_b -先行スパン B の平均化期間
- モード -見つけたい値を定義します。選択には以下の定数の一つを使用します。
- MODE_TENKANSEN -転換線
- MODE_KIJUNSEN -基準線
- MODE_SENKOUSPANA-先行スパン A
- MODE_SENKOUSPANB -先行スパン B
- MODE_CHINKOUSPAN -遅行スパン
- シフト -どのバーでインディケータが使用されるかを決定します。
パラメータ 「モード」 によって何が返されるか定義します。
使用例:
double i;

i=iIchimoku(0,0,13,21,53,MODE_KIJUNSEN,0);
// the value of the line Kijun-sen on the last bar on the current security and period.
// Periods for finding mean values for Tenkan Sen, Kijun Sen and Senkou Span B
// accordingly: 13,21 and 53.

i=iIchimoku("EURUSD",PERIOD_M5,21,53,96,MODE_TENKANSEN,1);
// the value of the line Tenkan-sen on the last but one bar on 5-minute chart EURUSD.
// Periods for finding mean values for Tenkan Sen, Kijun Sen and Senkou Span B
// accordingly: 21,53 and 96.

i=iIchimoku("USDCAD",PERIOD_D1,3,5,9,MODE_CHINKOUSPAN,0);
// the value of the line Chinkou Span on the last bar on a daily chart USDCAD.
// Periods for finding mean values for Tenkan Sen, Kijun Sen and Senkou Span B
// accordingly: 3,5 and 9.
市場簡素化指数(BW MFI)
インディケータ 市場簡素化指数(BW MFI) は1ティックに対する価格を測定するのに使用されます。https://www.metatrader5.com/en/terminal/help/indicators/bw_indicators/market_facilitation
関数プロトタイプ:
double iBWMFI( string symbol, int timeframe, int shift)
パラメータ:
- シンボル -テクニカルインディケータ値を計算するためにどの銘柄(通貨ペア)を使用するか定義します。現行(アクティブな)銘柄(チャート)が必要な場合は、NULL(または 0)を使用します。
- タイムフレーム -どのタイムフレームでインディケータが使用されるか定義します。現期間に対しては0 または次の定数のひとつを使用します。:PERIOD_M1、PERIOD_M5、PERIOD_M15、 PERIOD_M30、PERIOD_H1、PERIOD_H4、PERIOD_D1、 PERIOD_W1、PERIOD_MN1。
- シフト -どのバーでインディケータが使用されるかを決定します。
使用例:
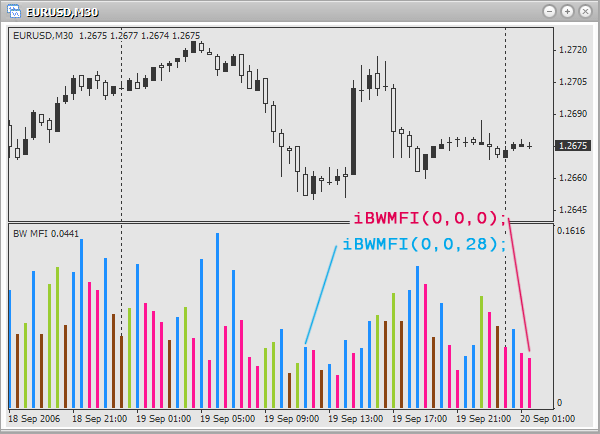
double mfi;

mfi=iBWMFI(0,0,0);
// index of market facilitation of the last bar on the active chart and period.

mfi=iBWMFI("EURUSD",PERIOD_H1,1);
// index of market facilitation of the last but one bar on an hour chart EURUSD.

mfi=iBWMFI("EURGBP",PERIOD_D1,0);
// index of market facilitation of the last bar on a daily chart EURGBP.
モメンタム
インディケータ モメンタム は ある期間での価格変化の量を測定するのに使用されます。https://www.metatrader5.com/en/terminal/help/indicators/oscillators/momentum
関数プロトタイプ:
double iMomentum( string symbol, int timeframe, int period, int applied_price, int shift)
パラメータ:
- シンボル -テクニカルインディケータ値を計算するためにどの銘柄(通貨ペア)を使用するか定義します。現行(アクティブな)銘柄(チャート)が必要な場合は、NULL(または 0)を使用します。
- タイムフレーム -どのタイムフレームでインディケータが使用されるか定義します。現期間に対しては0 または次の定数のひとつを使用します。:PERIOD_M1、PERIOD_M5、PERIOD_M15、 PERIOD_M30、PERIOD_H1、PERIOD_H4、PERIOD_D1、 PERIOD_W1、PERIOD_MN1。
- 周期 -平均値を求めるのに使用されるバー本数
- applied_price -使用される価格(何が平均化されるか)を定義します。以下は使用する価格を選択するための定義済み定数です。
- PRICE_CLOSE -始値
- PRICE_OPEN -終値
- PRICE_HIGH -高値
- PRICE_LOW -安値
- PRICE_MEDIAN -平均価格(高値 + 安値)÷ 2
- PRICE_TYPICAL - 代表値(高値 + 安値 + 終値)÷ 3
- PRICE_WEIGHTED -加重終値(高値 + 安値 + 終値 + 終値)÷ 4
- シフト -どのバーでインディケータが使用されるかを決定します。
使用例:
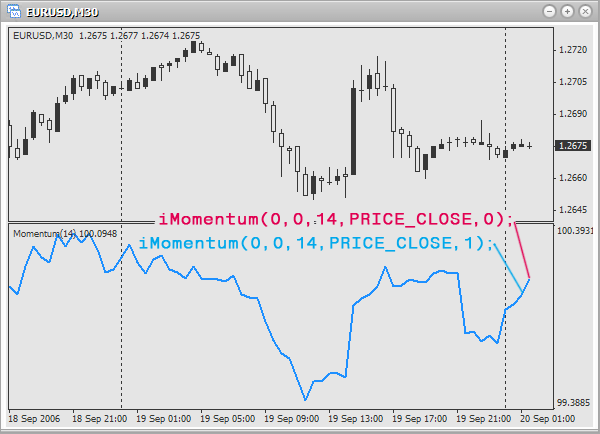
double m;

m=iMomentum(0,0,12,PRICE_CLOSE,1);
// momentum of the last but one bar on the active chart and period. Use
// 12 bars and close price for finding a mean value.

m=iMomentum("EURUSD",PERIOD_D1,21,PRICE_OPEN,0);
// momentum of the last bar on a daily chart EURUSD. Use
// 21 bars and open price for finding a mean value.

m=iMomentum("USDCAD",PERIOD_H1,7,PRICE_MEDIAN,1);
// momentum of the last but one bar on an hour chart USDCAD. Use
// 7 bars and average price for finding a mean value.
資金流入指数(MFI)
インディケータ 資金流入指数(MFI) は投資の強さを測定するのに使用されます。
https://www.metatrader5.com/en/terminal/help/indicators/volume_indicators/mfi
関数プロトタイプ:
double iMFI( string symbol, int timeframe, int period, int shift)
パラメータ:
- シンボル -テクニカルインディケータ値を計算するためにどの銘柄(通貨ペア)を使用するか定義します。現行(アクティブな)銘柄(チャート)が必要な場合は、NULL(または 0)を使用します。
- タイムフレーム -どのタイムフレームでインディケータが使用されるか定義します。現期間に対しては0 または次の定数のひとつを使用します。:PERIOD_M1、PERIOD_M5、PERIOD_M15、 PERIOD_M30、PERIOD_H1、PERIOD_H4、PERIOD_D1、 PERIOD_W1、PERIOD_MN1。
- 周期 -平均値を求めるのに使用されるバー本数
- シフト -どのバーでインディケータが使用されるかを決定します。
使用例:
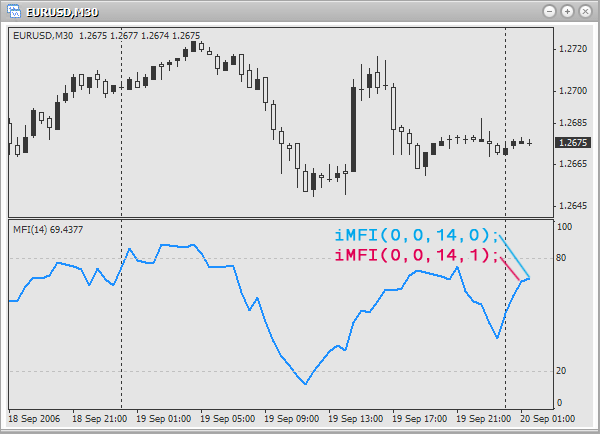
double mfi;

iMFI(0,0,14,1);
// intensity of investments of the last but one bar on the current chart and period.
// Use 14 bars to find the mean value.

iMFI("EURGBP",PERIOD_H4,32,0);
// intensity of investments of the last bar on 4-hour chart EURGBP.
// Use 32 bars to find the mean value.

iMFI("EURUSD",PERIOD_W1,9,1);
// intensity of investments of the last but one bar on a weekly chart EURUSD.
// Use 9 bars to find the mean value.
移動平均(MA)
インディケータ 移動平均(MA) は特定期間に対する平均価格を示します。https://www.metatrader5.com/en/terminal/help/indicators/trend_indicators/ma
関数プロトタイプ:
double iMA( string symbol, int timeframe, int period, int ma_shift,
            int ma_method, int applied_price, int shift)
パラメータ:
- シンボル -テクニカルインディケータ値を計算するためにどの銘柄(通貨ペア)を使用するか定義します。現行(アクティブな)銘柄(チャート)が必要な場合は、NULL(または 0)を使用します。
- タイムフレーム -どのタイムフレームでインディケータが使用されるか定義します。現期間に対しては0 または次の定数のひとつを使用します。:PERIOD_M1、PERIOD_M5、PERIOD_M15、 PERIOD_M30、PERIOD_H1、PERIOD_H4、PERIOD_D1、 PERIOD_W1、PERIOD_MN1。
- 周期 -平均値を求めるのに使用されるバー本数
- ma_shift -バー内でのライン移動。シフトが正であれば、線は右に移動します。逆に、シフトが負であれば、線は左に移動します。
- ma_method -平均値を求めるのに使用する方法を定義します。以下は方法選択のための定義済み定数です。
- MODE_SMA -単純移動平均
- MODE_EMA -指数移動平均
- MODE_SMMA -平滑化移動平均
- MODE_LWMA -線形加重移動平均
- applied_price -使用される価格(何が平均化されるか)を定義します。以下は使用する価格を選択するための定義済み定数です。
- PRICE_CLOSE-終値
- PRICE_OPEN -始値
- PRICE_HIGH -高値
- PRICE_LOW -安値
- PRICE_MEDIAN -平均価格(高値 + 安値)÷ 2
- PRICE_TYPICAL - 代表値(高値 + 安値 + 終値)÷ 3
- PRICE_WEIGHTED -加重終値(高値 + 安値 + 終値 + 終値)÷ 4
- シフト -どのバーでインディケータが使用されるかを決定します。
使用例:
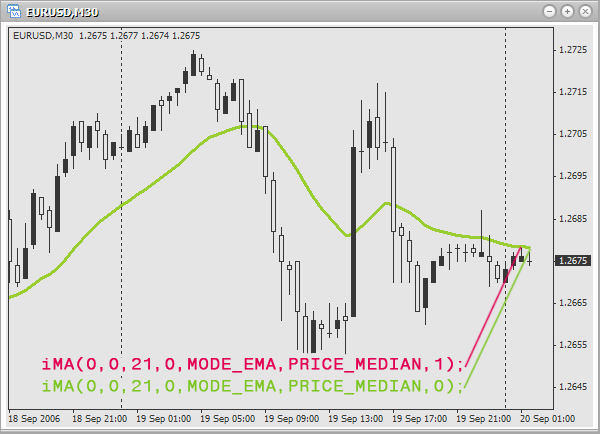
double ma;

ma=iMA(0,0,13,0,MODE_SMA,PRICE_CLOSE,0);
// moving average of the last bar on the active chart and period.
// Use 13 bars and close price for finding simple moving average.
// Shift is not used.

ma=iMA("GOLD",PERIOD_M15,21,6,MODE_LWMA,PRICE_LOW,1);
// moving average of the last but one bar on 15-minute chart GOLD.
// Use 21 bars and minimal price for finding linearly-weighted moving average.
// Shift: 6 bars.

ma=iMA("EURCHF",PERIOD_D1,18,4,MODE_SMMA,PRICE_TYPICAL,0);
// moving average of the last bar on a daily chart EURCHF.
// Use 18 bars and typical price for finding smoothed moving average.
// Shift: 4 bars.
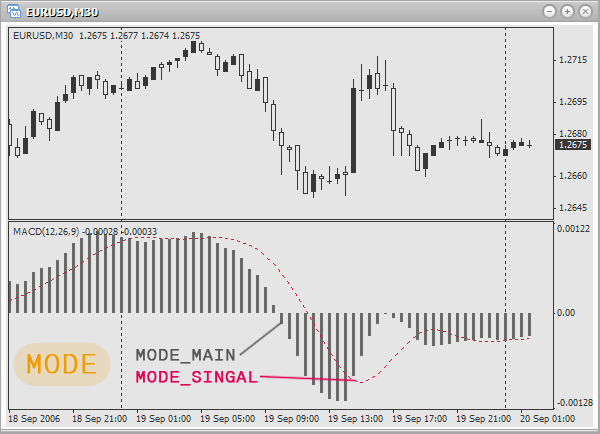
移動平均収束/分散(MACD)
インディケータ 移動平均収束/分散(MACD) は 2 つの移動平均間の相関関係を基にトレンドをトレースするのに使用されます。
https://www.metatrader5.com/en/terminal/help/indicators/oscillators/macd
関数プロトタイプ:
double iMACD( string symbol, int timeframe, int fast_ema_period,
              int slow_ema_period, int signal_period, int applied_price,
              int mode, int shift)
パラメータ:
- シンボル -テクニカルインディケータ値を計算するためにどの銘柄(通貨ペア)を使用するか定義します。現行(アクティブな)銘柄(チャート)が必要な場合は、NULL(または 0)を使用します。
- タイムフレーム -どのタイムフレームでインディケータが使用されるか定義します。現期間に対しては0 または次の定数のひとつを使用します。:PERIOD_M1、PERIOD_M5、PERIOD_M15、 PERIOD_M30、PERIOD_H1、PERIOD_H4、PERIOD_D1、 PERIOD_W1、PERIOD_MN1。
- fast_ema_period -バー数。高速移動平均の計算に使用されます。
- slow_ema_period -バー数。低速移動平均の計算に使用されます。
- signal_period -バー数。シグナルラインの計算に使用されます。
- applied_price -使用される価格(何が平均化されるか)を定義します。以下は使用する価格を選択するための定義済み定数です。
- PRICE_CLOSE-終値
- PRICE_OPEN -始値
- PRICE_HIGH -高値
- PRICE_LOW -安値
- PRICE_MEDIAN -平均価格(高値 + 安値)÷ 2
- PRICE_TYPICAL - 代表値(高値 + 安値 + 終値)÷ 3
- PRICE_WEIGHTED -加重終値(高値 + 安値 + 終値 + 終値)÷ 4
- モード -求めたい値を定義します。選択には以下の定数の一つを使用します。
- MODE_MAIN -メインライン
- MODE_SIGNAL -シグナルライン
- シフト -どのバーでインディケータが使用されるかを定義します。
パラメータ 「モード」 によって何が返されるか定義します。
使用例:
double ma;

ma=iMACD(0,0,9,21,9,PRICE_CLOSE,MODE_MAIN,0);
// value of the main line for the last bar on the active chart and period.
// Bars, used to find mean values of a fast, slow and signal
// moving average accordingly: 9,21 and 9. Use close price.

ma=iMACD("EURUSD",PERIOD_H1,21,52,18,PRICE_HIGH,MODE_SIGNAL,1);
// value of the signal line for the last but one bar on an hour chart EURUSD.
// Bars, used to find mean values of a fast, slow and signal
// moving average accordingly: 21,52 and 18. Use maximal price.

ma=iMACD("USDCAD",PERIOD_D1,7,13,7,PRICE_MEDIAN,MODE_MAIN,1);
// value of the main line for the last but one bar on a daily chart USDCAD.
// Bars, used to find mean values of a fast, slow and signal
// moving average accordingly: 7,13 and 7. Use average price.
オシレータの移動平均(OsMA)
インディケータ オシレータの移動平均(OsMA) はインディケータ「移動平均収束/拡散(MACD)」のメインラインとシグナルライン間の差を測定するのに使用されます。https://www.metatrader5.com/en/terminal/help/indicators/oscillators/macd
関数プロトタイプ:
double iOsMA( string symbol, int timeframe, int fast_ema_period, int slow_ema_period,
              int signal_period, int applied_price, int shift)
パラメータ:
- シンボル -テクニカルインディケータ値を計算するためにどの銘柄(通貨ペア)を使用するか定義します。現行(アクティブな)銘柄(チャート)が必要な場合は、NULL(または 0)を使用します。
- タイムフレーム -どのタイムフレームでインディケータが使用されるか定義します。現期間に対しては0 または次の定数のひとつを使用します。:PERIOD_M1、PERIOD_M5、PERIOD_M15、 PERIOD_M30、PERIOD_H1、PERIOD_H4、PERIOD_D1、 PERIOD_W1、PERIOD_MN1。
- fast_ema_period -バー数。高速移動平均の計算に使用されます。
- slow_ema_period -バー数。低速移動平均の計算に使用されます。
- signal_period -バー数。シグナルラインの計算に使用されます。
- applied_price -使用される価格(何が平均化されるか)を定義します。以下は使用する価格を選択するための定義済み定数です。
- PRICE_CLOSE-終値
- PRICE_OPEN -始値
- PRICE_HIGH -高値
- PRICE_LOW -安値
- PRICE_MEDIAN -平均価格(高値 + 安値)÷ 2
- PRICE_TYPICAL - 代表値(高値 + 安値 + 終値)÷ 3
- PRICE_WEIGHTED -加重終値(高値 + 安値 + 終値 + 終値)÷ 4
- シフト -どのバーでインディケータが使用されるかを定義します。
使用例:
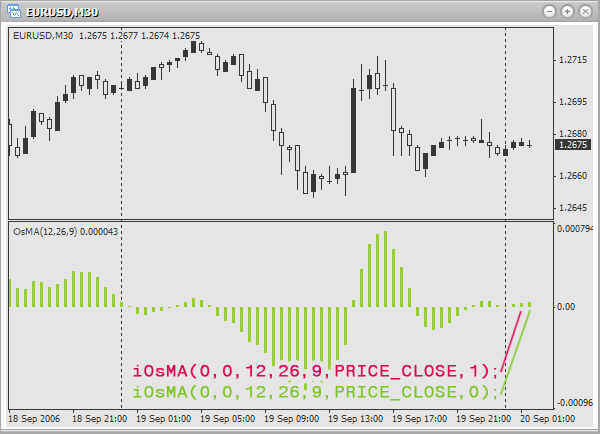
double osma;

osma=iOsMA(0,0,12,26,9,PRICE_CLOSE,0);
// difference of the last bar on the active chart and period. Bars, used
// to find mean values for the fast, slow and signal
// moving average accordingly: 12,26 and 9. Use close price.

osma=iOsMA("EURUSD",PERIOD_M1,7,13,6,PRICE_OPEN,1);
// difference of the last but one bar on a minute chart EURUSD. Bars, used
// to find mean values for the fast, slow and signal
// moving average accordingly: 7,13 and 6. Use open price.

osma=iOsMA("EURAUD",PERIOD_H1,21,48,18,PRICE_TYPICAL,0);
// difference of the last bar on an hour chart EURAUD. Bars, used
// to find mean values for the fast, slow and signal
// moving average accordingly: 21,48 and 18. Use typical price.
オン バランス ボリューム(OBV)
インディケータ オン バランス ボリューム(OBV) は、このボリュームに従い価格変化にボリュームを関連づけます。
https://www.metatrader5.com/en/terminal/help/indicators/volume_indicators/obv
関数プロトタイプ:
double iOBV( string symbol, int timeframe, int applied_price, int shift)
パラメータ:
- シンボル -テクニカルインディケータ値を計算するためにどの銘柄(通貨ペア)を使用するか定義します。現行(アクティブな)銘柄(チャート)が必要な場合は、NULL(または 0)を使用します。
- タイムフレーム -どのタイムフレームでインディケータが使用されるか定義します。現期間に対しては0 または次の定数のひとつを使用します。:PERIOD_M1、PERIOD_M5、PERIOD_M15、 PERIOD_M30、PERIOD_H1、PERIOD_H4、PERIOD_D1、 PERIOD_W1、PERIOD_MN1。
- applied_price -使用される価格(何が平均化されるか)を定義します。以下は使用する価格を選択するための定義済み定数です。
- PRICE_CLOSE-終値
- PRICE_OPEN -始値
- PRICE_HIGH -高値
- PRICE_LOW -安値
- PRICE_MEDIAN -平均価格(高値 + 安値)÷ 2
- PRICE_TYPICAL -一般価格(高値 + 安値+ 終値)÷ 3
- PRICE_WEIGHTED -加重終値(高値 + 安値 + 終値 + 終値)÷ 4
- シフト -どのバーでインディケータが使用されるかを定義します。
使用例:
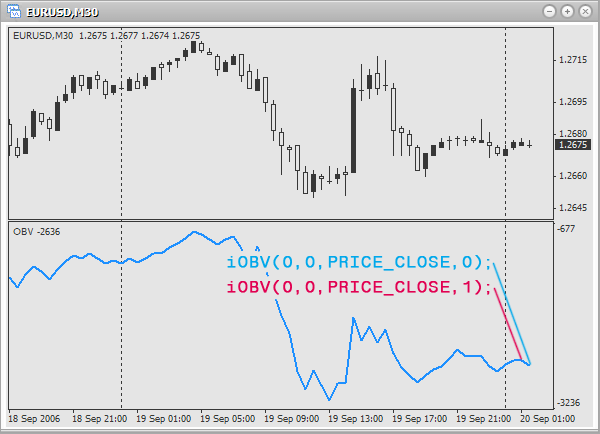
double obv;

obv=iOBV(0,0,PRICE_OPEN,0);
// Balance volume of the last bar on the current chart and period. Use open price

obv=iOBV("GBPCHF",PERIOD_M30,PRICE_CLOSE,1);
// Balance volume of the last but one bar on 30-minutes chart GBPCHF. Use close price.

obv=iOBV("GBPJPY",PERIOD_H4,PRICE_MEDIAN,0);
// Balance volume of the last bar on 4-hour chart GBPJPY. Use average price.
パラボリック ストップ アンド リバース システム(パラボリック SAR)
インディケータ パラボリック ストップ アンド リバース システム(パラボリック SAR)はトレンド市場を分析し、エグジットポイントを決めるのに使用されます。https://www.metatrader5.com/en/terminal/help/indicators/trend_indicators/psar
関数プロトタイプ:
double iSAR( string symbol, int timeframe, double step, double maximum, int shift)
パラメータ:
- シンボル -テクニカルインディケータ値を計算するためにどの銘柄(通貨ペア)を使用するか定義します。現行(アクティブな)銘柄(チャート)が必要な場合は、NULL(または 0)を使用します。
- タイムフレーム -どのタイムフレームでインディケータが使用されるか定義します。現期間に対しては0 または次の定数のひとつを使用します。:PERIOD_M1、PERIOD_M5、PERIOD_M15、 PERIOD_M30、PERIOD_H1、PERIOD_H4、PERIOD_D1、 PERIOD_W1、PERIOD_MN1。
- step-ストップレベルのインクリメント。通常は 0.02。
- maximum -最大ストップレベル。通常は 0.2。
- シフト -どのバーでインディケータが使用されるかを定義します。
使用例:
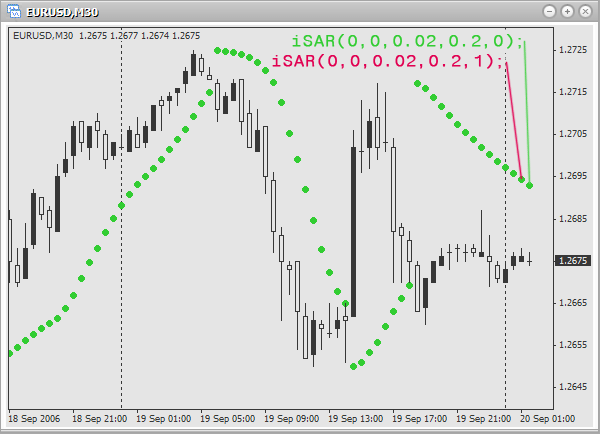
double sar;

sar=iSAR(0,0,0.02,0.2,0);
// indicator value for the last bar on the current chart and period.
// Step of stop level increment: 0.02. Maximal stop level: 0.2.

sar=iSAR("EURUSD",PERIOD_M1,0.03,0.18,1);
// indicator value for the last but one bar on a minute chart EURUSD.
// Step of stop level increment: 0.03. Maximal stop level: 0.18.

sar=iSAR("EURCHF",PERIOD_H1,0.01,0.15,0);
// indicator value for the last bar on an hour chart EURCHF.
// Step of stop level increment: 0.01. Maximal stop level: 0.15.
相対強度指数(RSI)
インディケータ 相対強度指数(RSI) は価格の転換を予測するのに使用されます。https://www.metatrader5.com/en/terminal/help/indicators/oscillators/rsi
関数プロトタイプ:
double iRSI( string symbol, int timeframe, int period, int applied_price, int shift)
パラメータ:
- シンボル -テクニカルインディケータ値を計算するためにどの銘柄(通貨ペア)を使用するか定義します。現行(アクティブな)銘柄(チャート)が必要な場合は、NULL(または 0)を使用します。
- タイムフレーム -どのタイムフレームでインディケータが使用されるか定義します。現期間に対しては0 または次の定数のひとつを使用します。:PERIOD_M1、PERIOD_M5、PERIOD_M15、 PERIOD_M30、PERIOD_H1、PERIOD_H4、PERIOD_D1、 PERIOD_W1、PERIOD_MN1。
- 周期 -平均値を求めるのに使用されるバー本数
- applied_price -使用される価格(何が平均化されるか)を定義します。以下は使用する価格を選択するための定義済み定数です。
- PRICE_CLOSE-終値
- PRICE_OPEN -始値
- PRICE_HIGH -高値
- PRICE_LOW -安値
- PRICE_MEDIAN -平均価格(高値 + 安値)÷ 2
- PRICE_TYPICAL - 代表値(高値 + 安値 + 終値)÷ 3
- PRICE_WEIGHTED -加重終値(高値 + 安値 + 終値 + 終値)÷ 4
- シフト -どのバーでインディケータが使用されるかを定義します。
使用例:
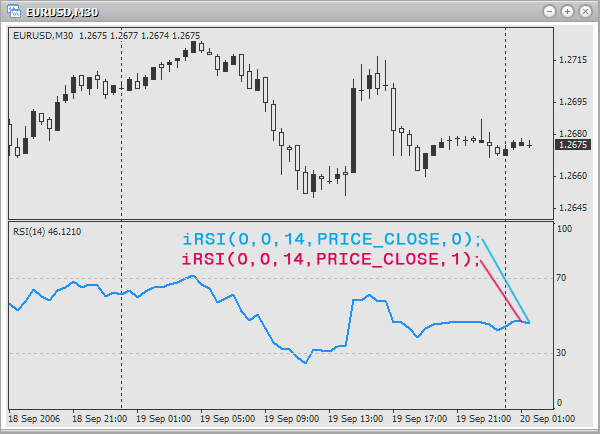
double rsi;

rsi=iRSI(0,0,14,PRICE_CLOSE,0);
// indicator value for the last bar on the active chart and period.
// Use 14 bars and close price to find the mean value.

rsi=iRSI("USDCAD",PERIOD_M1,9,PRICE_OPEN,1);
// indicator value for the last but one bar on a minute chart USDCAD.
// Use 9 bars and close price to find the mean value.

rsi=iRSI("EURAUD",PERIOD_H1,25,PRICE_TYPICAL,0);
// indicator value for the last bar on an hour chart EURAUD.
// Use 25 bars and typical price to find the mean value.
相対活力指数(RVI)
インディケータ相対活力指数(RVI)は、売りや買いのシグナルを定義するのに使用されます。
このインディケータは、あいまいさを排除するため前出のものとの併用がお薦めです。
https://www.metatrader5.com/en/terminal/help/indicators/oscillators/rvi
関数プロトタイプ:
double iRVI( string symbol, int timeframe, int period, int mode, int shift)
パラメータ:
- シンボル -テクニカルインディケータ値を計算するためにどの銘柄(通貨ペア)を使用するか定義します。現行(アクティブな)銘柄(チャート)が必要な場合は、NULL(または 0)を使用します。
- タイムフレーム -どのタイムフレームでインディケータが使用されるか定義します。現期間に対しては0 または次の定数のひとつを使用します。:PERIOD_M1、PERIOD_M5、PERIOD_M15、 PERIOD_M30、PERIOD_H1、PERIOD_H4、PERIOD_D1、 PERIOD_W1、PERIOD_MN1。
- 周期 -平均値を求めるのに使用されるバー本数
- モード -見つけたい値を定義します。選択には以下の定数の一つを使用します。
- MODE_MAIN -メインライン
- MODE_SIGNAL -シグナルライン
- シフト -どのバーでインディケータが使用されるかを決定します。
パラメータ 「モード」 によって何が返されるか定義します。
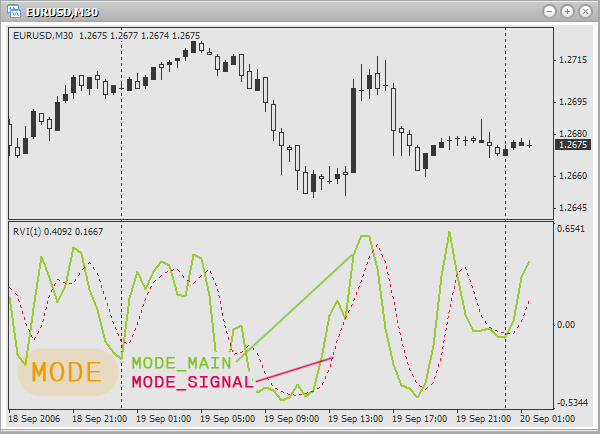
使用例:
double rvi;

rvi=iRVI(0,0,12,MODE_MAIN,1);
// value of the main line of the last but one bar on the active chart and period.
// Use 12 bars to find the mean value.

rvi=iRVI("EURUSD",PERIOD_D1,21,MODE_SIGNAL,0);
// value of the signal line on the last bar on a daily chart EURUSD.
// Use 21 bars to find the mean value.

rvi=iRVI("GBPJPY",PERIOD_H1,19,MODE_MAIN,1);
// value of the main line on the last but one bar on an hour chart GBPJPY.
// Use 19 bars to find the mean value.
標準偏差
インディケータ 標準偏差 は市場の変動性を判断するのに使用されます。
https://ta.mql4.com/indicators/trends/standard_deviation
関数プロトタイプ:
double iStdDev( string symbol, int timeframe, int ma_period, int ma_shift,
                int ma_method, int applied_price, int shift)
パラメータ:
- シンボル -テクニカルインディケータ値を計算するためにどの銘柄(通貨ペア)を使用するか定義します。現行(アクティブな)銘柄(チャート)が必要な場合は、NULL(または 0)を使用します。
- タイムフレーム -どのタイムフレームでインディケータが使用されるか定義します。現期間に対しては0 または次の定数のひとつを使用します。:PERIOD_M1、PERIOD_M5、PERIOD_M15、 PERIOD_M30、PERIOD_H1、PERIOD_H4、PERIOD_D1、 PERIOD_W1、PERIOD_MN1。
- ma_period -バー本数。インディケータライン取得のために使用されます。
- ma_shift -バー内でのインディケータラインの移動シフトが正であれば、線は右に移動します。逆に、シフトが負であれば、線は左に移動します。
- ma_method -平均値を求めるのに使用する方法を定義します。以下は方法選択のための定義済み定数です。
- MODE_SMA -単純移動平均
- MODE_EMA -指数移動平均
- MODE_SMMA -平滑化移動平均
- MODE_LWMA -線形加重移動平均
- applied_price -使用される価格(何が平均化されるか)を定義します。以下は使用する価格を選択するための定義済み定数です。
- PRICE_CLOSE-終値
- PRICE_OPEN -始値
- PRICE_HIGH -高値
- PRICE_LOW -安値
- PRICE_MEDIAN -平均価格(高値 + 安値)÷ 2
- PRICE_TYPICAL - 代表値(高値 + 安値 + 終値)÷ 3
- PRICE_WEIGHTED -加重終値(高値 + 安値 + 終値 + 終値)÷ 4
- シフト -どのバーでインディケータが使用されるかを決定します。
使用例:
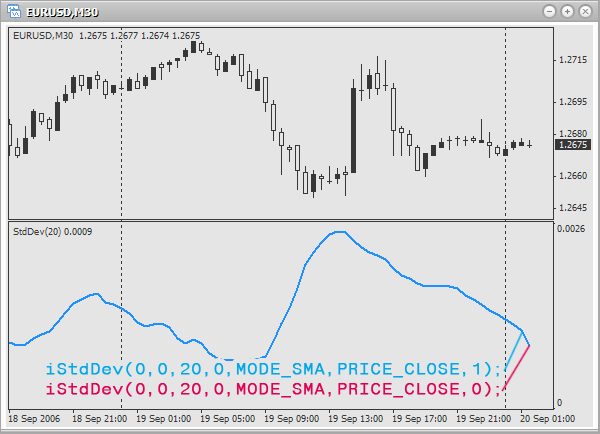
double sd;

sd=iStdDev(0,0,10,0,MODE_SMA,PRICE_CLOSE,1);
// deviation of the last but one bar on the active chart and period.
// Use 10 bars and close price to find simple
// moving average. Shift is not used.

sd=iStdDev("EURUSD",PERIOD_D1,21,3,MODE_SMMA,PRICE_MEDIAN,0);
// deviation of the last bar on a daily chart EURUSD.
// Use 21 bars and average price to find smoothed
// moving average. Shift: 3 bars.

sd=iStdDev("USDCAD",PERIOD_H4,17,2,MODE_EMA,PRICE_OPEN,1);
// deviation of the last but one bar on 4-hour chart USDCAD.
// Use 17 bars and open price to find exponential
// moving average. Shift: 2 bars.
ストキャスティック オシレータ
インディケータストキャスティック オシレータは、売りや買いのシグナルを定義するのに使用されます。
https://www.metatrader5.com/en/terminal/help/indicators/oscillators/so
関数プロトタイプ:
double iStochastic( string symbol, int timeframe, int %Kperiod,
                    int %Dperiod, int slowing, int method,
                    int price_field, int mode, int shift)
パラメータ:
- シンボル -テクニカルインディケータ値を計算するためにどの銘柄(通貨ペア)を使用するか定義します。現行(アクティブな)銘柄(チャート)が必要な場合は、NULL(または 0)を使用します。
- タイムフレーム -どのタイムフレームでインディケータが使用されるか定義します。現期間に対しては0 または次の定数のひとつを使用します。:PERIOD_M1、PERIOD_M5、PERIOD_M15、 PERIOD_M30、PERIOD_H1、PERIOD_H4、PERIOD_D1、 PERIOD_W1、PERIOD_MN1。
- %K period -バー本数。ライン %K を生成するために使用されます。
- %D period -バー本数。ライン %D を生成するために使用されます。
- 減速 -減速の値
- メソッド -方法を定義します。平均値を求めるのに使用されます。以下は方法選択のための定義済み定数です。
- MODE_SMA -単純移動平均
- MODE_EMA -指数移動平均
- MODE_SMMA -平滑化移動平均
- MODE_LWMA -線形加重移動平均
- price_field -計算にどの価格が使用される定義します。以下の定義済み定数が価格選択に使用されます。
- 0 -安値 ÷ 高値
- 1 -終値 ÷ 終値
- モード -求めたい値を定義します。選択には以下の定数の一つを使用します。
- MODE_MAIN -メインライン
- MODE_SIGNAL -シグナルライン
- シフト -どのバーでインディケータが使用されるかを定義します。
パラメータ 「モード」 によって何が返されるか定義します。
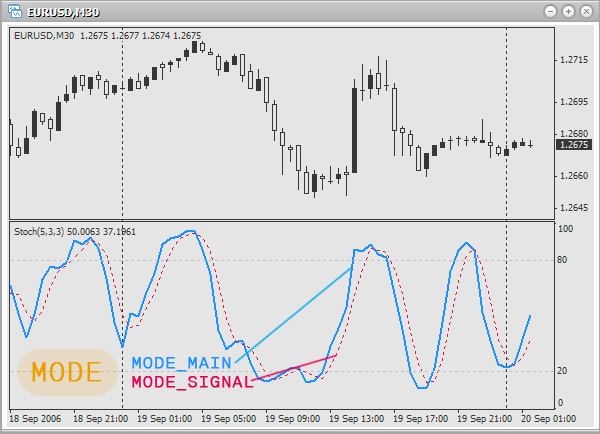
使用例:
double s;

s=iStochastic(0,0,10,6,6,MODE_SMA,0,MODE_MAIN,0);
// value of the main line for the last bar on the current chart and period.
// Bars used to calculate lines %K, %D and slowing
// accordingly: 10, 6 and 6. Method of averaging: simple moving average.
// Use prices: Low/High.

s=iStochastic("EURUSD",PERIOD_M1,6,3,3,MODE_SMMA,1,MODE_SIGNAL,1);
// value of the signal line for the last but one bar on a minute chart EURUSD.
// Bars used to calculate lines %K, %D and slowing
// accordingly: 6, 3 and 3. Method of averaging: smoothed moving average.
// Use prices: Close/Close.

s=iStochastic("EURGBP",PERIOD_M5,9,7,7,MODE_EMA,0,MODE_MAIN,0);
// value of the main line for the last bar on 5-minute chart EURGBP.
// Bars used to calculate lines %K, %D and slowing
// accordingly: 9, 7 and 7. Method of averaging: exponential moving average.
// Use prices: Low/High.
ウィリアムズの範囲率(%R)
インディケータ ウィリアムズの範囲率(%R)
は市場が買い持ち/売り持ちであることを判断するのに使用されます。
https://www.metatrader5.com/en/terminal/help/indicators/oscillators/wpr
関数プロトタイプ:
double iWPR( string symbol, int timeframe, int period, int shift)
パラメータ:
- シンボル -テクニカルインディケータ値を計算するためにどの銘柄(通貨ペア)を使用するか定義します。現行(アクティブな)銘柄(チャート)が必要な場合は、NULL(または 0)を使用します。
- タイムフレーム -どのタイムフレームでインディケータが使用されるか定義します。現期間に対しては0 または次の定数のひとつを使用します。:PERIOD_M1、PERIOD_M5、PERIOD_M15、 PERIOD_M30、PERIOD_H1、PERIOD_H4、PERIOD_D1、 PERIOD_W1、PERIOD_MN1。
- 周期 -平均値を求めるのに使用されるバー本数
- シフト -どのバーでインディケータが使用されるかを決定します。
使用例:
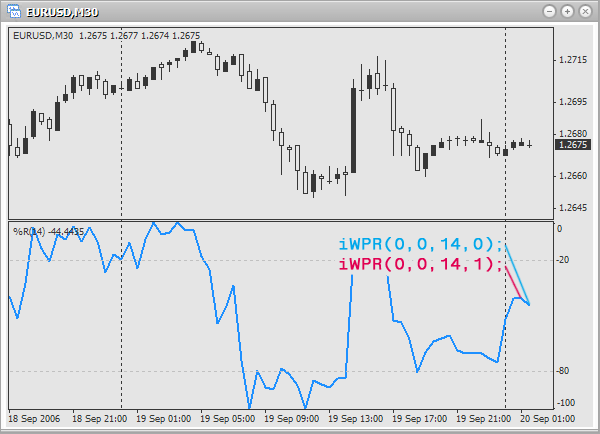
double wpr;

wpr=iWPR(0,0,14,1);
// overbought: the last but one bar on the active chart and period.
// Use 14 bars to get the mean value.

wpr=iWPR("USDCHF",PERIOD_D1,9,0);
// overbought: The last bar on a daily chart USDCHF.
// Use 9 bars to get the mean value.

wpr=iWPR("GBPJPY",PERIOD_H1,23,1);
// overbought: the last but one bar on an hour chart GBPJPY.
// Use 23 bars to get the mean value.
テクニカルインディケータ関数の正しい使い方
これら関数を正しく使うために、インディケータがどのように配され、それ(トレードシグナル)をどのように使うかを正確に知る必要があります。もちろんそれらはご自身の Expert Advisor やインディケータで使用するべきものです。それでもなお、宿題として、いずれかのインディケータ(自分で選びます)のシグナルを基にエンタリングポイントを伝えるスクリプトを書いてみてください。
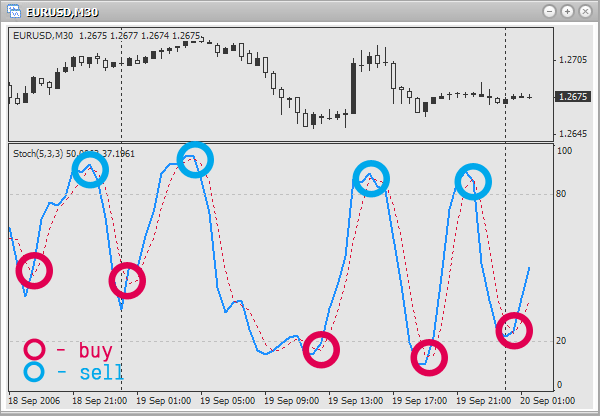
例として、その宿題の課題を書いてみます。ストキャスティック オシレータのトレードシグナルを基にエンタリングポイントを示すものとします。市場エンターに以下のルールを採用します。
メインラインがシグナルラインより高くなったら買う。メインラインがシグナルラインより低いところまで落ちたら売る。
絵では、エンタリングポイントが丸で囲まれています。
まず、変数をいくつか宣言します。そこに現行バーおよび前回バーにおけるシグナルラインとメインラインの値を格納するのです。
double mainLine;
double prevMainLine;
double signalLine;
double prevSignalLine;
ここでこれら変数に対する値を求めます。
mainLine=iStochastic(0,0,5,3,3,MODE_SMA,0,MODE_MAIN,0);
prevMainLine=iStochastic(0,0,5,3,3,MODE_SMA,0,MODE_MAIN,1);
signalLine=iStochastic(0,0,5,3,3,MODE_SMA,0,MODE_SIGNAL,0);
prevSignalLine=iStochastic(0,0,5,3,3,MODE_SMA,0,MODE_SIGNAL,1);
最終バーと最後から2番目のバーに制限しているのがわかります。売りや買いのシグナルがあるか確認します。
if(prevMainLine<prevSignalLine && mainLine>signalLine)
   Alert("Signal to buy");
// if the main line was under the signal one and rised over it,
// this is a signal to buy

if(prevMainLine>prevSignalLine && mainLine<signalLine)
   Alert("Signal to sell");
// if the main line was over the signal one and fell bellow it,
// this is a signal to sell
比較の演算子および 理論&&を使いました。それを正しく理解するようにしてください。
最後のバー百本を確認するためそれをサイクルに入れます。
for(int a=0;a<100;a++)
{
   mainLine=iStochastic(0,0,5,3,3,MODE_SMA,0,MODE_MAIN,a);
   prevMainLine=iStochastic(0,0,5,3,3,MODE_SMA,0,MODE_MAIN,a+1);
   signalLine=iStochastic(0,0,5,3,3,MODE_SMA,0,MODE_SIGNAL,a);
   prevSignalLine=iStochastic(0,0,5,3,3,MODE_SMA,0,MODE_SIGNAL,a+1);

   if(prevMainLine<prevSignalLine && mainLine>signalLine)
      Alert("Signal to buy");

   if(prevMainLine>prevSignalLine && mainLine<signalLine)
      Alert("Signal to sell");
}
おわかりですか?サイクルからカウンターを追加しただけで、バーを確認することができます。便宜のために、百ではなく定数 BARS_TO_ANALYSE を宣言します。それは最終バーがいくつ分析されるか決めます。以下はスクリプトの最終バージョンです。
//+------------------------------------------------------------------+
//|                                        showStochasticSignals.mq4 |
//|                                    Antonuk Oleg Copyright © 2007 |
//|                                                   banderass@i.ua |
//+------------------------------------------------------------------+
#property copyright "Antonuk Oleg Copyright © 2007"
#property link      "banderass@i.ua"

#define BARS_TO_ANALYSE 100

//+------------------------------------------------------------------+
//| script program start function                                    |
//+------------------------------------------------------------------+
int start()
{
   double mainLine;
   double prevMainLine;
   double signalLine;
   double prevSignalLine;

   for(int a=0;a<BARS_TO_ANALYSE;a++)
   {
      mainLine=iStochastic(0,0,5,3,3,MODE_SMA,0,MODE_MAIN,a);
      prevMainLine=iStochastic(0,0,5,3,3,MODE_SMA,0,MODE_MAIN,a+1);
      signalLine=iStochastic(0,0,5,3,3,MODE_SMA,0,MODE_SIGNAL,a);
      prevSignalLine=iStochastic(0,0,5,3,3,MODE_SMA,0,MODE_SIGNAL,a+1);

      if(prevMainLine<prevSignalLine && mainLine>signalLine)
         Alert("Signal to buy. Time: ",TimeToStr(Time[a]));

      if(prevMainLine>prevSignalLine && mainLine<signalLine)
         Alert("Signal to sell. Time: ",TimeToStr(Time[a]));
   }
   return(0);
}
このスクリプトでは、次の小さなコードのフラグメントに違和感を持つはずです(もしそうなら、みなさんは優秀な学習者です)。
TimeToStr(Time[a])
この関数は1970年1月1日から経過した秒数を受け取り、この日付の文字列を返します。あらかじめ決められた配列 Time[] は選択されたバーに適用されたとおり、同じ秒数を返します。ここに理想的なペアがあります。
サブタスク として、重移動平均(期間 200~500 で)を追加し、次の方法で不要なシグナルをふるい落とします。価格が正中線の上にあれば、売らない。価格が正中線の下にあれば、買わない。
なんとかやり遂げましたか?できてない?では、そういうあなたにもう少し情報を提供します。
変数宣言についての新しい何か
通常、変数はこのように宣言します。
double maxPrice;
double minPrice;
double lastPrices[100];

int maxIndex;
int minIndex;
int levels[10];
もうそれはしないでください。以下のように行うのです。
double maxPrice,
       minPrice,
       lastPrices[100];

int maxIndex,
    minIndex,
    levels[10];
すなわち、まずタイプを、そしてコンマで分けた変数(配列)名を指定します。不要な処理を避けていますが、なにも変わりはありません。初期化でも同様です。
int value1=10,
    value2=12,
    matrix[2][2]={1,2,
                  3,4};
複数の値を返す関数
そんな関数があるのでしょうか?もちろんあります。ご自分でそれを書くことができるのです。どんなふうにできるか見ていきます。
値を1つ返すもっともシンプルな関数:
int func()
{
   return(100);
}
同時に異なるタイプの値を複数返す必要がある場合はどうなるのでしょうか?以下を見ます。
void SuperFunc(int& valueForReturn1,double& valueForReturn2,string& valueForReturn3)
{
   valueForReturn1=100;
   valueForReturn2=300.0;
   valueForReturn3="it works!!";
}
では、この「驚きの」関数を呼び出してみます。
int value1=0;
double value2=0.0;
string value3="";

SuperFunc(value1,value2,value3);
MessageBox("value1="+value1+" value2="+value2+" value3="+value3);
結果は以下です。
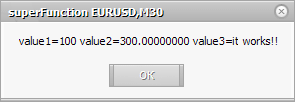
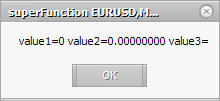
この関数にはシンプルな関数との一般的な違いが1つあります。それは、この関数を宣言するとき、引数の後に アパサンド文字 (&)を入れることです。これを引数で行えば、関数内でその値を変更することができ、それを呼び出したあとの結果は同じです。引数でのそのような操作は参照によるパラメータの受け渡しと呼ばれます。こうして、異なるタイプの変数を好きなだけ返すことができるのです。上のコードでアパサンド文字を省略し、結果を確認してみます。
コメントの新規タイプ
1行をどのようにコメントするかはご存じですね。
// it is a one string comment
一時的に無効にするため、特定のコードブロックをコメントする方が便利なことがあります。上記は 20~30 の文字列のコメントをするには好都合とはいえません。ここではマルチラインコメントを使用します。
/*
   それはマルチラインコメントです。
   ひじょうに便利です。お試しください。
*/
おわりに
本日は数多くの新しいテーマを学習しました。数学的関数および三角関数、またテクニカルインディケータで操作をする関数を分析しました。簡単な例でトレードシグナルを正確にトレースする方法を確認しました。スクリプトで使用するには便利ではなく、その目的で作成されたわけでもありませんが、今後の学習でご自分のインディケータや Expert Advisor で使う方法を知ることとなります。そしてそれらがどれほど有用か知ることになるのです。