XAU/USD, H4 Let’s look at the four-hour chart. Tenkan-sen line is below Kijun-sen, the red line is turning upwards and can soon cross the flat blue line, forming a signal to buy. Confirmative Chinkou Span line is crossing the price chart from below; current Kumo-cloud is descending...
The latest innovation at Claws&Horns analytical company was the integration of our analytical service directly to the Metatrader 4 and Metatrader 5 trading terminals, an integration procedure carried out using the standard MetaQuotes company news feeder. The development and implementation of IOS and Android mobile applications was also an excellent addition for our clients wanting to check analytics ‘on-the-go’. We continuously satisfy the needs of each client with quality analytics. Information is delivered on time and exactly where it is mostly demanded - in the trading terminal. This prevents traders from spending enormous amounts of their valuable time outside the terminal looking for analytical reviews and possible price movement scenarios. Now everything clients need to successfully trade is close at hand.
Current trend Chinese stock market is falling while the government is trying to stop the panic and prevent further fall. Chinese regulator asked state owned companies to avoid selling their own shares to stabilise the market. Despite their attempts, Shanghai Composite fell by 5...
Current trend The pair EUR/USD remains under the pressure as worries regarding Greek exit from the Eurozone grow. Today, an emergency EU leaders’ summit is held, where Greece is going to put ahead their proposals to get the financial aid. Country’s default possibility becomes stronger...
Ladies and gentlemen, we are delighted to share an interview with you from Kristina Leonova (Executive Director at MAYZUS Investment Company) about her successful collaboration with “Claws&Horns”:
Q: Why did you choose “Claws&Horns” above other analytical service providers? A: We decided to choose "Claws&Horns" analytical service after we tried their free trial version. We saw that they have everything our clients needed in one place, and the feedback from our clients was extremely positive.
Q: What kind of benefits provided by “Claws&Horns” do you value the most? A: One of the best things about "Claws&Horns" is that everything is in one place.There is no need for our clients to search for analytical materials, trading tips and signals from other vendors, and personally I have found that this has increased our clients loyalty and trust in us as a broker exponentially.
Q: How did you come across “Claws&Horns”? A: We are always looking for new and innovative services to provide our clients with, and simultaneously trying to add value to our company in the most cost efficient way. We were approached by a “Claws&Horns” representative, and after being given an in depth presentation, and trying their demo version, we were completely sold on the product. Our IB’s had been demanding such intricate analysis for a long time, and once seeing what “Clawns&Horns” offer, we realized it was a perfect fit.
Q: What was your first impression after using the services from “Claws&Horns”? A: My first impression was, it looked really expensive! After seeing the company presentation and using the demo version, I realized the absolute value for our company and the vast amount of benefits for our clients. The cabinet was so user friendly, unlike anything I had seen before, and when I tested the trading signals, I was amazed at their accuracy and the great detail the company goes into on their reviews. As it turned out, the cost was a fraction of what I was willing to pay, and have paid before for less advantageous services in the past.
Q: Have the trading volumes of your clients increased since collaborating with “Claws&Horns” analytical service? A: Yes, absolutely. Our trading volumes increased after we started using "Claws&Horns" analytics. Furthermore, we have noticed a significant drop in relation to the time a new client starts trading on our live accounts, as we actively encourage the use of “Claws&Horns” analytical service through our sales and marketing team.
Current trend Australian dollar in the AUD/USD pair opened Monday with a gap down of almost 40 points in return for the events in Greece. Besides the European factor and the U.S...
Current trend On Thursday, the Euro grew by 30 points against the USD amid poor economic data from the US. Non-farm Payrolls amounted to 223 K of new jobs, which is 7 K below what was expected. The unemployment level fell by 0.2% to 5.3%, however, labor participation rate was only 62...
Current trend Brent crude oil is falling against the US dollar. Some experts say the risk of Greek default makes energy prices lose its positions. To avoid the collapse, the Greek authorities decided to close all banks and place restrictions on the withdrawal and transfer of money...
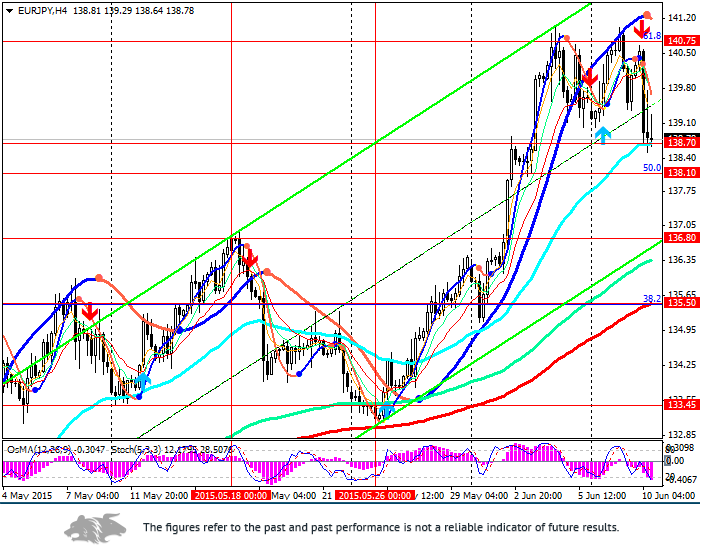
Since the beginning of this week, the Yen has stopped its decline against most major currencies after the news that Japanese GDP in the first quarter has grown by annualised 3.9%. The previous figure was 2.4%. On Tuesday, the Yen continued to rise, acting as a safe haven against all other currencies. It has gained 0.2% against the USD and by 0.2% against Euro following the news that Chinese consumer price index has fallen. On Wednesday, during the Asian session the head of the Bank of Japan Haruhiko Kuroda said that the decline in real effective exchange rate of the Yen is unlikely to continue. The Yen has grown by more than 1% against the USD and the Euro. At the moment the pair EUR/JPY is trading at 138.80.
Let us remind that consumer inflation in Japan stands at zero versus the 2% target set by the Bank of Japan. In order to support the economy, the Bank of Japan is implementing aggressive quantitative easing monetary policy and interest rate is maintained at near zero level, being one of the lowest in the world. In the medium-term, the Yen will remain weak and it is expected that at the next meeting on 18-19 of June the Bank of Japan will leave monetary policy unchanged. The Euro in the pair EUR/JPY is supported by the difference in interest rates and an increasing yield of German ten-year bonds.
Support and resistance
On the 4-hour and daily charts OsMA and Stochastic give sell signals; however, due to the weakening of the Yen, this local decline can be considered as a correction. The pair is near its support levels. On the 4-hour chart these are 138.70 (ЕМА50), 136.80 (bottom line of the ascending channel and ЕМА144), and also 138.10 (Fibonacci 50% of the corrective upward movement to the decline since December 2014.) The pair has reached the level of 140.75 (Fibonacci 61.8%), and if the rise resumes, the pair will go back to this level.
Support levels: 138.70, 138.10 and 136.80.
Resistance levels: 139.25, 140.25.
Trading tips
It is recommended to open long positions with the targets of 140.75 and 142.00 from the levels of 138.70, 138.10, 137.00 and 136.80 and in case of indicators signal opening long positions. (on the four-hour chart OsMA histogram shall rise and go above the zero line; Stochastic shall leave the sell zone and fast line of Stochastic shall cross the slow line from below to above). Short positions can be opened after breakthrough at the level of 135.50 (Fibonacci 38.2%) with the targets of 133.45 and 132.25.
Current trend Since opening session on Tuesday the index Stoxx Europe 600 has dropped by 0.2%, and at the same time German DAX fell by 0.3%, which is the decline over 10% since mid-April. Later, favourable data on the British trade balance for April became known and GDP of Eurozone in Q1. No more British or European news is scheduled for release today; therefore movement in the pair will depend on the movement of the Pound and Euro against the USD.
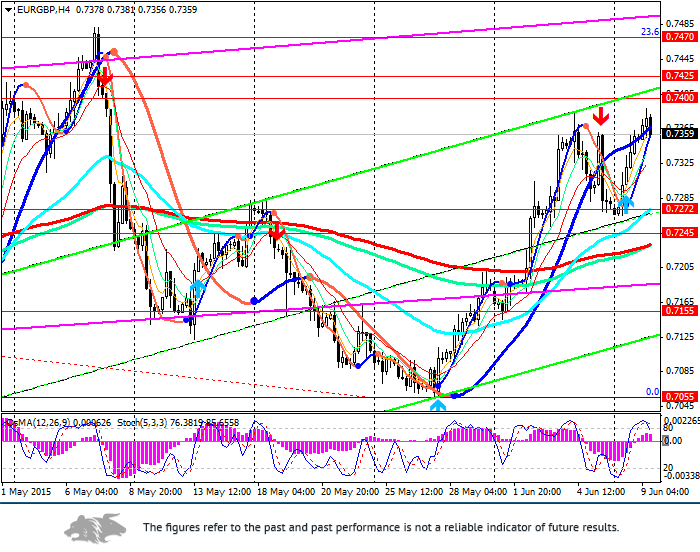
It is necessary to be very careful when opening long positions on the pair, as the rise in the pair can stop. Until recently, the Euro in the pair EUR/GBP was supported by several factors. Despite Greek problems Euro was actively bought in the cross-pair with other currencies and amid the growing yield of the 10-year German bonds.
Support and resistance
Following the decline from the level of 0.8810 in the summer 2013, the pair EUR/GBP has stabilized and since mid-March 2015 is moving in the channel of 0.7055–0.7400
On the daily chart the rise in the pair is prevented by the resistance levels of 0.7525 (ЕМА200), 0.7470 (Fibonacci 23.6%) and 0.7425 (ЕМА144). At the moment the pair is at the level of 0.7370 not far from the above resistance levels. On the daily and four-hour charts the indicators OsMA and Stochastic are in the buy zone; Stochastic is giving a sell signal.
Support levels: 0.7245, 0.7155 and 0.7055
Resistance levels: 0.7400, 0.7425, 0.7470 and 0.7525
Trading tips
It is recommended to open short positions at the market order and from the levels of 0.7400 and 0.7425 with the targets of 0.7270, 0.7245 and 07155. Alternative scenario is possible if the price breaks down the level of 0.7470 with the targets of 0.7525 and 0.7570.
NFPR has become public. The results exceeded market expectations and the forecast. (In May there were 280 000 new jobs versus the forecast of 225 000). Hourly wages have also increased (+0.3% versus the forecast of +0.2%). At the Asian session this Monday the price of the precious metals and currencies has adjusted to the growth in the USD last Friday, which means that the market needed a break. Since the opening of European session the USD continued uptrend. So, what can we expect in future?
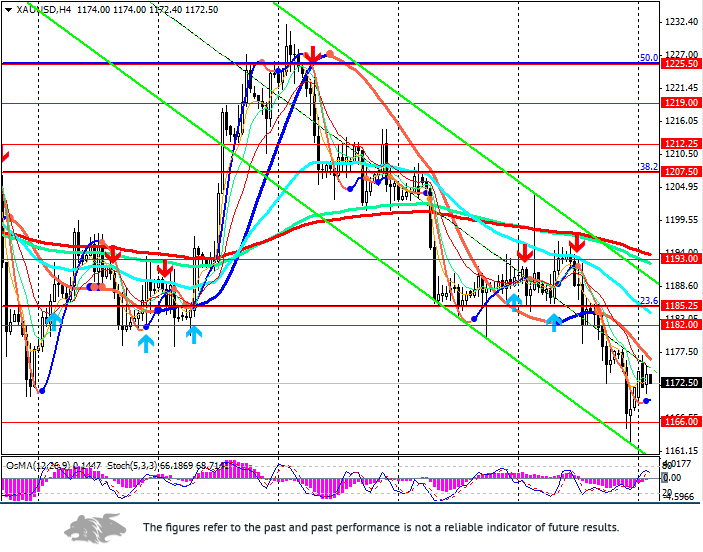
Since February 2015 gold has been in the downward local trend within the general decline since October 2012. The low of this year was at the level of $1142.60 per troy ounce. Precious metals do not bring large dividends any more, and given strengthening in the USD they can become unprofitable for the investors. In these conditions shares and bonds as well as the USD are more attractive. At COMEX last Friday August futures of gold fell in price by 0.6% up to $1168.10 per ounce. This is the lowest closing level since March 2015.
Today, condition index of the US labor market for May will be released at 17:00 (GMT+3). In case the index is positive, the USD will continue to strengthen. If the index is negative, the pair can rebound.
Support and resistance
On the monthly chart gold goes to support levels of 1080.00 (ЕМА144) and 960.00 (ЕМА200). If gold reaches the level of 1150.00, the decline will accelerate.
On the four-hour chart the main resistance is at the level of 1185.20 (Fibonacci 23.6%). On the daily chart the indicators OsMA and Stochastic give signals for short positions. On the four-hour chart the price is in the middle of the downward channel (green color). Stochastic and OsMA do not give clear signals so far. Support levels: 1172.00 and 1166.00. Resistance levels: 1182.00, 1185.25 and 1193.00.
Trading tips
It is recommended to open short positions from the level of 1182.00 with the target of 1166.00, or in case of the clear signals on the four-hour chart ( OsMA histogram should go to the negative zone and fast line of Stochastic should cross the slow line from top to bottom).
An alternative scenario is possible if the price breaks down the level of 1185.25 (Fibonacci 23.6%). In this case the targets will be level of 1193.00 and 1207.50 (Fibonacci 38.2%) if the trend continues).
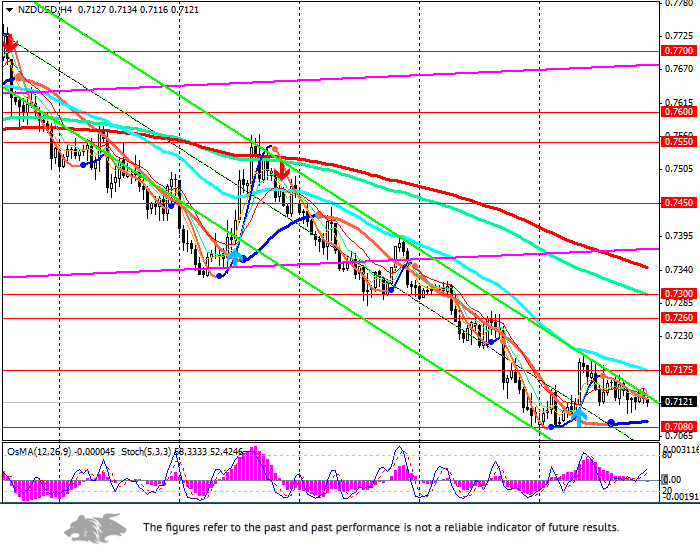
Following some fluctuations during Asian and European sessions the pair NZD/USD stopped at the today’s opening level of 0.7120 in the anticipation of the US non-farm payroll figures due 15:30 (GMT+3). However, regardless of the results of NFPR, the pair NZD/USD is likely to continue declining. The NZD is under the pressure from a decrease in dairy product prices as well as from a soft monetary policy of the NZRB. Even if the NZRB leaves interest rate unchanged at 3.5% at the meeting next Thursday, the interest rate is likely to be cut twice until the end of the year.
However, there are some peculiarities. In the US data turns out to be below the forecast of 235 000, the Fed can suggest to soften monetary policy.
The New Zealand dollar is heavily oversold for pairs NZD/USD, EUR/NZD and AUD/NZD. Market needs a correction. Support and resistance
The pair is at the strong resistance level on the monthly line ЕМА200.
Support levels: 0.7080, 0.7000, 0.6800 and 06700
Resistance levels: 0.7175, 0.7260 and 0.7300
Trading tips
It is recommended to open short positions at the current price, and from the levels of 0.7175 and 0.7200 with protective order at 0.7230 and the targets of 0.7080 and 0.7000. Alternative scenario is possible if the price breaks through the levels of 0.7260 and 0.7300. In this case the next targets are 0.7400 and 0.7550.