• Panoramica
  • Recensioni (18)
  • Commenti (77)
  • Novità

RSI Divergence Scanner

4.46

** All Symbols x All Timeframes scan just by pressing scanner button **

*** Contact me to send you instruction and add you in "RSI scanner group" for sharing or seeing experiences with other users.

Introduction

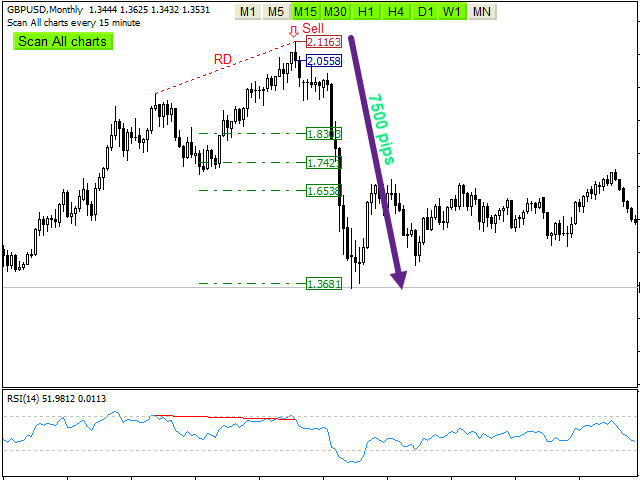
RSI divergence is a main technique used to determine trend reversing when it’s time to sell or buy because prices are likely to drop or pick in the charts. The RSI Divergence indicator can help you locate the top and bottom of the market. This indicator finds Regular divergence for pullback the market and also finds hidden RSI Divergence to show continuing trend.

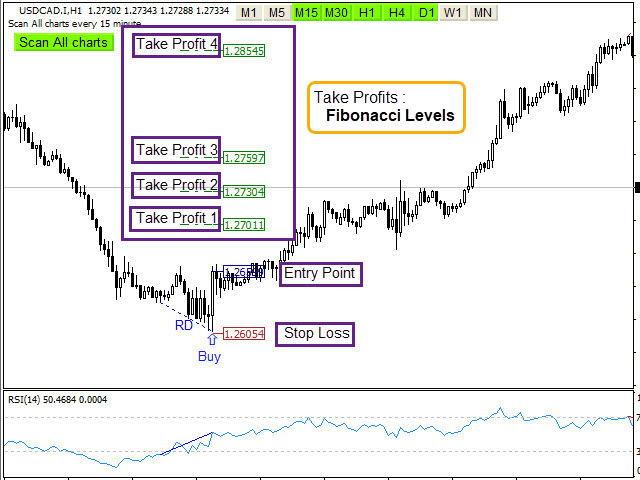
This indicator shows divergence on the RSI that is a strong hint for an excellent entry point and finds immediately with alarm and notification and also has stop loss, take profits and entry point with candlestick checking for easy trading.

Main Features

  • Detect the best and  most successful point of trend or reversal trend
  • Easy-to-use and user-friendly indicator
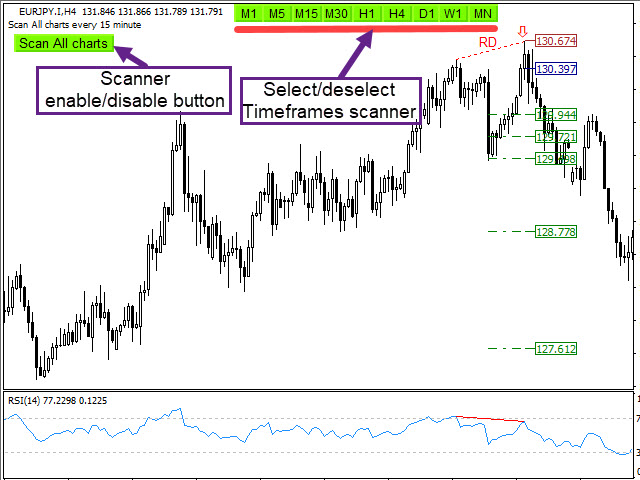
  • Scan All charts button ( Forex, Crypto, Indices and commodities )
  • Select and deselect time frames button for scan (M1,M5,M15,M30,H1,H4,D1,W1,MN)
  • It displays and pushes notification stop-loss, entry-point and take-profit levels
  • Candlestick check for the best entry point
  • Use Fibonacci levels
  • Editable ceiling and floor RSI value 
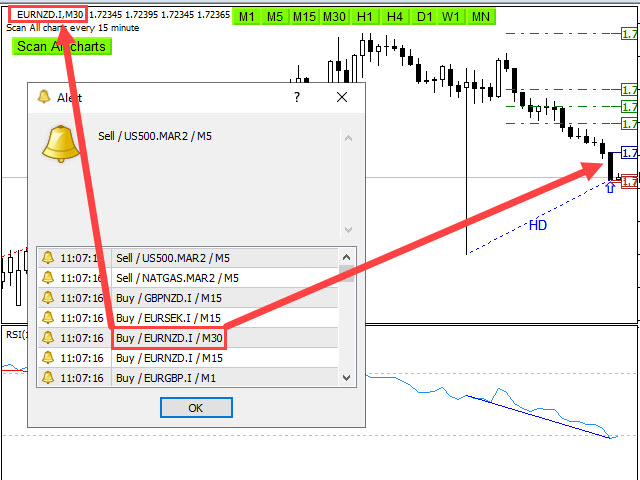
  • Sending the alert and push notification
  • Alert enable/disable base on your setting time
  • Adjust the pattern setting

How to test:

You can find tester version here. It is free on USDCHF and AUDCHF real charts.


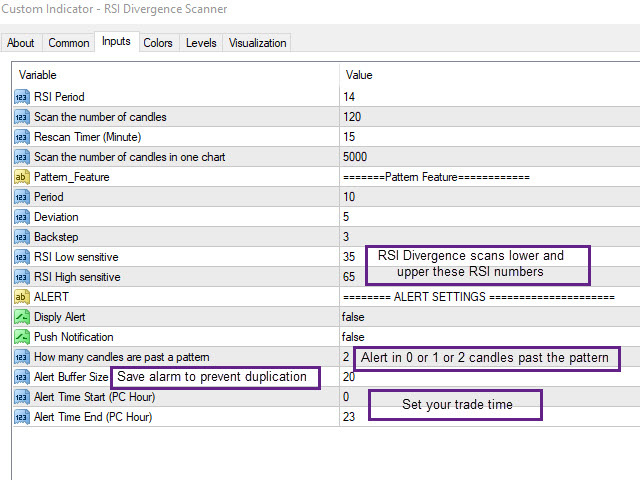
    Input Parameters

    =========Scanner============

    • Scan All Charts – Enable
    • Scan the number of candles – Amount of history bars to evaluate
    • Re-scan Timer – Re-scan all charts in all time frames after passing time
    • Method to choose how appearing pattern : breakout(after breakout and filtering) or pattern(immediately after creating pattern)

    =======Pattern Feature============

    • Pattern_Feature(Period, Deviation, Backstep) - Algorithm Parameters for pattern recognition
    • RSI Low sensitive –  RSI Divergence algorithm checks when RSI is lower this number
    • RSI High sensitive – RSI Divergence algorithm checks when RSI is upper this number

    =======Display/style Options============

    • Display_Options – Display or do not  TP&SL levels
    • Stop Loss/Take Profit levels and Breakout Style - Set the Fonts and colors of patterns

      ========ALERT SETTINGS ==========

      • Display Alert or Push Notification – Enable or disable Alert or Push Notification
      • How many candles are past a pattern – Maximum Number of candles Passed from a pattern to allow alert
      • Alert Buffer Size – Maximum save alert to prevent duplicate alerts
      • Alert start/end time  – Determine trading hours based on the computer clock to activate and deactivate the alarm


      Recensioni 18
      Mashal Khan
      129
      Mashal Khan 2024.09.04 11:37 
       

      A very nice indicator, especially for bigger time frames, 1H and above, accurtaely indicate reversal and break of structures. highly recommended for day and swing traders.

      Jack Hudson
      260
      Jack Hudson 2023.12.06 17:48 
       

      Really loving this. Gives divergence signals in real time allowing you to enter or wait for your TP confirmations/confluence.

      davevicens
      321
      davevicens 2023.01.03 16:31 
       

      First operation divergence 5 min and profit achieved. It gives good results. Very accurate!!!! Great Work

      Prodotti consigliati
      Indicator for binary options arrow is easy to use and does not require configuration works on all currency pairs, cryptocurrencies buy signal blue up arrow sell signal red down arrow tips do not trade during news and 15-30 minutes before their release, as the market is too volatile and there is a lot of noise it is worth entering trades one or two candles from the current period (recommended for 1 candle) timeframe up to m 15 recommended money management fixed lot or fixed percentage of the depo
      SFO Trend Racer
      Tevin Marshall
      5 (1)
      SFO Trend Racer system is a trend indicator created by the CEO and Founder of " Simple Forex Options ", Tevin Marshall . It serves 6 different functions all in one. It shows the trader the entry signals as well as exit signals, whether it is a take profit or a stop loss. It also uses trend filters and signal confirmations so that the trader is able to make the most logically fit decision. Trend Racer uses various filters and specific settings from a plethora of indicators. The beauty in this ind
      HeikenashiSmoothing
      Rodolfo Leonardo De Morais
      Heiken ashi Smoothing in separate window MTF The color of the Heiken-Ashi candles depend on their shadows. The advantage of the Heiken-Ashi chart is that the trend is determined very simply, the upward-facing sails are blue, and the downward-tendency sails are red. For profitable trading it is necessary to use it with the standard candles (make analyzes) and with the other indicators. Indicator Parameters TimeFrame - Graphic time being 0 = Current graph time, 1 = M1, 5 = M5, 15 = M15, 30 = M30
      This is  a dashboard indicator that displays the Average Level of each selected currency pairs that filters and gives us a signal for overbought (>=90%) or if price at extreme peak above 90, and/or oversold (<=10%) or if price at extreme peak below 10. The calculation is using Relative Strength Index default periods (2 & 9) applied to three different higher time frames H4,D1,&W1. This won't change or altered even if you change symbol or switch to lower time frames or even in monthly and y
      RSI Jurik
      Augustine Kamatu
      Introducing RSI Jurik—an innovative indicator designed to revolutionize your forex trading strategy by combining custom moving averages based on the Relative Strength Index (RSI) with the MetaTrader 4 indicator, RSI. Jurik moving averages are renowned for their accuracy and reliability in analyzing price movements in the forex market. They provide traders with smoother representations of price action, reducing noise and offering clearer signals for identifying trends and potential reversals.
      FREE
      Buy and sell zones
      Evgeniy Zhdan
      5 (2)
      Indicator for determining flat and trend. If the price is below any of the two histograms and two lines (red and blue), this is a sell zone. When purchasing this version of the indicator, MT5 version for one real and one demo account - as a gift (to receive, write me a private message)! If the price is above any of the two histograms and two lines (red and blue), this is a buy zone. MT5 version:  https://www.mql5.com/en/market/product/70409 If the price is between two lines or in the zone
      If the direction of the market is upward, the market is said to be in an  uptrend ; if it is downward, it is in a  downtrend  and if you can classify it neither upward nor downward or rather fluctuating between two levels, then the market is said to be in a sideways trend. This indicator shows Up Trend (Green Histogram), Down Trend (Red Histogram) and Sideways Trend (Yellow Histogram). Only one input parameter: ActionLevel. This parameter depends of the length of the shown sideways trend.
      [ZhiBiCCI] indicators are suitable for all cycle use, and are also suitable for all market varieties. [ZhiBiCCI] Green solid line is a reversal of bullish divergence. The green dotted line is a classic bullish divergence. [ZhiBiCCI] The solid line to the red is a reverse bearish divergence. The red dotted line is a classical bearish divergence. [ZhiBiCCI] can be set in the parameters (Alert, Send mail, Send notification), set to (true) to send instant signals to the alarm window, email, in
      Sto Signal AM
      Andriy Matviyevs'kyy
      This indicator displays Stochastic osc signals on the price chart and allows the user to receive notifications of such signals. The Stochastic indicator is a classic and proven indicator of the technical analysis of the markets. Despite its age, it is still relevant today. Depending on the settings, the indicator allows you to work effectively on various TFs and any markets. Signals are given on fully formed bars and are not redrawn. Custom Parameters: Stochastic_Price (0-1) - The applied pric
      Reincarnations
      Maryna Shulzhenko
      The Reincarnations trend indicator is used to determine the strength and direction of a trend and to find price reversal points. This tool scans the market looking for the correct entry. You can see and evaluate it yourself, perhaps it will suit you for a number of tasks related to forecasting price movements. It uses only price data and analytics to calculate entry points. Does not use auxiliary indicators. It has two parameters for customization. Indicator setting. Interval - price analysis
      Con questo strumento di trading puoi scansionare 15 mercati contemporaneamente. Presentazione del nuovo indicatore di trading 2024: ️ Dashboard Stocastico multi valuta e multi time frame. Ci sono almeno due ragioni per cui ho creato questo strumento di trading: Innanzitutto, sono stanco di osservare solo un mercato. In secondo luogo, non voglio perdere il momento di ingresso in un altro mercato. Ecco perché voglio conoscere contemporaneamente altre condizioni di mercato. Per questo
      CCI Mtf
      Dmitriy Susloparov
      This is a fully multi-timeframe version of the Commodity Channel Index standard indicator, which works for any combination of timeframes. The indicator preserves the correct time scale for all charts at any intervals. When switching to a higher or lower timeframe, the time scale is not distorted. For example, one value of М15 will occupy 15 bars on М1 and 3 bars on М5 . The indicator allows you to see the real dynamics and the overall ratio for all selected periods, as well as accurately evaluat
      Dynamic SR Trend Channel Dynamic SR Trend Channel is a simple indicator for trend detection as well as resistance/support levels on the current timeframe. It shows you areas where to expect possible change in trend direction and trend continuation. It works with any trading system (both price action and other trading system that use indicators) and is also very good for renko charting system as well. In an uptrend, the red line (main line) serves as the support and the blue line serves as the
      SuperTrend Alerts
      Libertas LLC
      3 (4)
      SuperTrend Alerts adds alerts to the widely popular SuperTrend indicator. As the name suggests, SuperTrend is a trending indicator which works best in trendy (not choppy) markets. SuperTrend is extremely popular for intraday and daily trading, and can be used on any timeframe. Place a call when the price closes above the SuperTrend line, and place a put when the price closes below the SuperTrend line. These crossovers are highlighted by non-repainting up/down arrows. Alerts Email, message and
      TrendWave Oscillator is an advanced MT4 oscillator that not only identifies the trend direction but also provides visual and audio alerts to enhance trading strategies. Key Features: - Color-coded trend indication:   - Blue : Indicates an uptrend, signaling potential price growth.   - Orange : Indicates a downtrend, suggesting possible price decline.   - Gray : Represents a flat market or lack of clear entry signals. - Graphical signals on the chart :   - Aqua : Highlights an uptrend, empha
      Indicator for determining the trend. The arrows and lines on the chart show the price reversal and the probable current trend or correction. You should always trade in the direction of the arrow. It is best to use the indicator on several time frames at once and enter the market when all time frames have the same arrow. For example, we open a sell trade if there is a red arrow on the M5, M30 and H4 timeframes. Or we open a buy deal if the indicator shows a blue arrow on all timeframes. Advant
      Binary Options Support Resistance Indicator This indicator is designed for binary options trading and effectively shows retracements from support and resistance levels. Signals appear on the current candle. A red arrow pointing downwards indicates a potential selling opportunity, while a blue arrow pointing upwards suggests buying opportunities. All that needs adjustment is the color of the signal arrows. It is recommended to use it on the M1-M5 timeframes as signals are frequent on these timef
      Trend Suffer
      Philip Effiong Philip
      Alerts you on new trends, with ENTRY and EXIT points. INSTRUCTIONS  Select asset of choice, activate the indicator on the chart and just follow the signals from the arrows. ITS FREE, GIVE ME A GOOD RATING! Platform : Metatrader4 Asset : All Currencies, Gold, BTCUSD, NASDAQ PS : F or newbie and pro traders. Used by more 3,000 traders around the world. Send  a mail for further help and information...........
      FBO Impact
      Abayomi Bello
      FBO Impact  is a professional yet simple to use trend following system. It detects the prevailing trend and gives entry points after pullbacks to significant price levels. To determine the trend it uses a unique filtering algorithm. Suitable for defining entry points for scalping as well as for intra-day trading. Features Works with the prevailing market trend. Suitable for all currency pairs. Ideal for all time frames but higher time frames are recommended. Does not redraw/repaint the arrows on
      Smooth MA Trend Cross Alert is indicator signal strategy trading by Smoothed Moving Average (SMMA) crossover. It'll alert signal with an audio or pop up on the chart when 2 periods SMMA cross above/below for Buy/Sell. It easy use. Filter sideways by SMMA's smoothed trend. Helpful for your system trading. You can customize period of SMMA for crossing alert signal. You can ON/OFF audio alert signal on the chart, Notifications alert on mobile, Email message alert when Buy/Sell SMMA cross alert sign
      Valentines
      Victor Golovkov
      Valentines trend is an easy-to-use indicator that hides a powerful calculation math-system "under the hood". Attach the indicator to the chart and set the parameters. Period - period for tracking changes in quotes Amount of Bars - number of last bars to track You do not need to select any numerical parameters. The indicator will do everything for you automatically . Each signal is generated on the current bar, and in order not to miss it, use the built-in alerts and notifications system . The in
      Sarangani Venom
      Sherwin Dennis Tava Ruiz
      sarangani venom is 100% profitable, easy to use indicator, a chart without indicator is stressful and will lead you to many losses, this indicator is pleasing to the eye that will gives you more confident to trade when there is signal, your computer will gives sound and the spider will animate, it can be used to all time frame and to all currency, you have many options, when the candlestick touches to upper line it is buy, when it touches to lower line it is sell, when the rope is pull to buy ar
      Market Session Pro MT4
      Kambiz Shahriarynasab
      5 (1)
      The  Market Sessions Indicator for MT5 helps you  predict market turnarounds  by detecting major supply and demand areas. These pivot points tend to occur after a new session has started and the previous one is still open. It is also used to gauge how many points or pips the market moves on average during a session. This helps us to place better our take profits and stop losses. The indicator works on all forex pairs, gold, silver, commodities, stocks, indices and any other instrument that your
      The trader uses the Trend for Neuro indicator to determine the market situation. This is a trending algorithm that is convenient to download, install and use. The algorithm with acceptable accuracy generates input signals and output levels. Strategy for trend trading, filtering and all the necessary functions built into one tool! By launching the indicator, the user will see only two types of arrows that can change color to blue during an uptrend, to red during a downtrend there is no uncertaint
      Super Reversal Pattern
      Parfait Mujinga Ndalika
      Super Reversal Pattern Indicator Unlock the power of advanced pattern recognition with our Super Reversal Pattern Indicator. Designed for traders seeking precision and reliability, this indicator identifies one of the most effective reversal patterns in technical analysis, offering a significant edge in your trading strategy. Key Features: Non-Repainting Accuracy: Enjoy the confidence of non-repainting technology. Once a Super Reversal Pattern is detected, it remains static, providing consis
      Indicatore di determinazione ANTICIPATA dell'inizio di una nuova tendenza. Inoltre, l'indicatore determina la direzione globale della tendenza in base al numero di punti: se sono presenti più punti verdi (parametro Calcolo del trend globale) - il trend è in rialzo; se ci sono più punti rossi, il trend è in ribasso. L'indicatore non ridisegna sulla prima candela. L'indicatore può essere utilizzato come sistema di trading indipendente e come aggiunta a qualsiasi altro sistema di trading. L'
      Advanced Bollinger Bands Scanner is a multi symbol multi timeframe Bollinger bands dashboard that monitors and analyzes the Bollinger Bands indicator from one chart. This panel monitors the Bollinger bands indicator in up to 28 configurable instruments and 9 timeframes for price overbought/oversold, price consolidation (Bollinger bands squeeze), and consolidation breakout (squeeze break)  with a deep scan feature to scan all market watch symbols (up to 1000 instruments!). Download Demo here  
      SystemBinaryM1
      Andrey Spiridonov
      SystemBinaryM1 - a professional indicator for trading short-term binary options, is a complete, self-contained author's strategy for working in the binary options market. The unique algorithm for analyzing the foreign exchange market is based on the calculation of reference points on three different time periods M15, M5. M1. Thus, the indicator simultaneously analyzes the long-term, medium-term and short-term price behavior before issuing a signal. The indicator is set in the usual way and work
      移動平均線クロス、ボリンジャーと移動平均線のクロス、移動平均線の角度でサイン表示 MT5インジケータ こちらに サイト とがあります。 このインジケータは3つのパターンでサインを表示(切り替え可能)します。 ①   移動平均線のクロス ②   ボリンジャーバンドと短期移動平均線とのクロス ③   ボリンジャーバンドと短期移動平均線とのクロスと、中期移動平均線と長期移動平均線の角度 移動平均線のクロス 指定した短期移動平均線と長期移動平均線のゴールデンクロスでは買いサイン、デットクロスでは売りサインを表示します。 ディフォルトでは短期は5,長期は20となっています。 もちろん変更可能になります。 移動平均線の種類をEMA(指数平滑移動平均線)やSMMA(平滑化移動平均)などに変更可能で適する価格も変更可能になります。 ボリンジャーバンドと短期移動平均線のクロス ボリンジャーバンド(以降BB)と短期移動平均線のクロスでサインを表示します。 ディフォルトではBB+1σと5MAのゴールデンクロスで買いサイン、BB-1σと5MAのデットクロスで売りサインでサインを表示します。 BBの期間や
      Double signal buy sell EURJPY EURUSD Your welcome! The indicator works for the EURJPY and EURUSD pairs, on the H1 timeframe. Entry rules: Buy when the second white arrow appears in a row. Sell ​​when the second consecutive yellow arrow forms. Take profit when the price hits the support or resistance line. Take profit when the price hits the support or resistance line. Please note the images below. A demo download is indicated beforehand. If the indicator does not appear, read
      Gli utenti di questo prodotto hanno anche acquistato
      Gann Made Easy
      Oleg Rodin
      4.85 (80)
      Gann Made Easy è un sistema di trading Forex professionale e facile da usare che si basa sui migliori principi del trading utilizzando la teoria di mr. WD Gann. L'indicatore fornisce segnali ACQUISTA e VENDI accurati, inclusi i livelli di Stop Loss e Take Profit. Puoi fare trading anche in movimento utilizzando le notifiche PUSH. Vi prego di contattarmi dopo l'acquisto! Condividerò i miei consigli di trading con te e fantastici indicatori bonus gratuitamente! Probabilmente hai già sentito parlar
      TPSpro RFI Levels
      Roman Podpora
      4.82 (22)
      Inverti il primo livello di impulso (RFI)       istruire       Russia       -        ESP   Raccomandazione di utilizzare   l'indicatore -   TPSpro   Trend Edizione Professional -Versione   MT5 La cosa più importante nel comercio son è la cosa più importante in futuro. La cosa più importante è la cosa più importante. Funzioni principali: La maggior parte delle zone sono attivate da venditori e compradores! Indicador mostra tutti i livelli/zone dei primi impulsi corretti per acquisti e vendite. LO
      Gold Stuff
      Vasiliy Strukov
      4.89 (237)
      Gold Stuff è un indicatore di tendenza progettato specificamente per l'oro e può essere utilizzato anche su qualsiasi strumento finanziario. L'indicatore non ridisegna e non è in ritardo. Periodo consigliato H1. Su di esso l'indicatore funziona in modo completamente automatico Expert Advisor EA Gold Stuff. Lo trovi nel mio profilo. I risultati in tempo reale possono essere visualizzati qui.  Puoi ottenere una copia gratuita del nostro indicatore Strong Support e Trend Scanner, per favore scri
      Atomic Analyst
      Issam Kassas
      5 (2)
      Innanzitutto, vale la pena sottolineare che questo indicatore di trading non è repaint, non è ridisegno e non presenta ritardi, il che lo rende ideale sia per il trading manuale che per quello automatico. Manuale utente: impostazioni, input e strategia. L'Analista Atomico è un indicatore di azione del prezzo PA che utilizza la forza e il momentum del prezzo per trovare un miglior vantaggio sul mercato. Dotato di filtri avanzati che aiutano a rimuovere rumori e segnali falsi, e aumentare il pote
      Enigmera
      Ivan Stefanov
      5 (3)
      ENIGMERA: Il cuore del mercato https://www.enigmera.com Introduzione Questo indicatore e sistema di trading rappresenta un approccio straordinario ai mercati finanziari. ENIGMERA utilizza i cicli frattali per calcolare con precisione i livelli di supporto e resistenza. Mostra l'autentica fase di accumulazione e fornisce direzione e obiettivi.  Un sistema che funziona sia in un trend che in una correzione.  Come funziona? ENIGMERA è composto da tre linee: la linea di supporto/resistenza, la
      TPSproTREND PrO
      Roman Podpora
      4.79 (19)
      TPSpro TREND PRO   è un indicatore di tendenza che analizza automaticamente il mercato, fornisce informazioni sulla tendenza e sui rispettivi cambiamenti e fornisce segnali per entrare nelle operazioni senza ridisegnare. L'indicatore utilizza ciascuna candela e la analizza separatamente. Si riferisce a vari shock al rialzo o al ribasso. Punto di ingresso preciso per il trading di valute, criptovalute, metalli, azioni e indici! Versione MT5                   Descrizione completa dell'indicatore
      Trend Punch
      Mohamed Hassan
      4.95 (19)
      This indicator is unstoppable when combined with our other indicator called  Support & Resistance . After purchase, send us a message and you will get it   for  FREE as a BONUS! Introducing Trend Punch , the revolutionary forex trend indicator that will transform the way you trade! Trend Punch is uniquely designed to provide precise buy and sell arrows during strong market trends, making your trading decisions clearer and more confident. Whether you're trading major currency pairs or exotic sym
      Attualmente 20% di sconto! La soluzione migliore per ogni principiante o trader esperto! Questo software per cruscotti funziona su 28 coppie di valute. Si basa su 2 dei nostri indicatori principali (Advanced Currency Strength 28 e Advanced Currency Impulse). Offre un'ottima panoramica dell'intero mercato Forex. Mostra i valori di forza delle valute avanzate, la velocità di movimento delle valute e i segnali per 28 coppie Forex in tutti i (9) timeframe. Immaginate come migliorerà il vostro t
      Scalper Inside PRO
      Alexey Minkov
      4.73 (56)
      An exclusive indicator that utilizes an innovative algorithm to swiftly and accurately determine the market trend. The indicator automatically calculates opening, closing, and profit levels, providing detailed trading statistics. With these features, you can choose the most appropriate trading instrument for the current market conditions. Additionally, you can easily integrate your own arrow indicators into Scalper Inside Pro to quickly evaluate their statistics and profitability. Scalper Inside
      ATTUALMENTE SCONTATO DEL 26% La soluzione migliore per ogni principiante o trader esperto! Questo indicatore è uno strumento di trading unico, di alta qualità e conveniente perché abbiamo incorporato una serie di caratteristiche proprietarie e una nuova formula. Con un solo grafico è possibile leggere la forza delle valute per 28 coppie Forex! Immaginate come migliorerà il vostro trading perché sarete in grado di individuare l'esatto punto di innesco di una nuova tendenza o di un'opportunit
      ATTUALMENTE SCONTATO DEL 31%! La soluzione migliore per ogni principiante o trader esperto! Questo indicatore è uno strumento di trading unico, di alta qualità e conveniente perché abbiamo incorporato una serie di caratteristiche proprietarie e una formula segreta. Con un solo grafico fornisce avvisi per tutte le 28 coppie di valute. Immaginate come migliorerà il vostro trading perché sarete in grado di individuare l'esatto punto di innesco di una nuova tendenza o opportunità di scalping!
      - Real price is 80$ - 40% Discount ( It is 49$ now ) Contact me for instruction, add group and any questions! Related EA Product: Bitcoin Expert Introduction The breakout and retest strategy is traded support and resistance levels. it involves price breaking through a previous level.  The break and retest strategy is designed to help traders do two main things, the first is to avoid false breakouts. Many false breakouts start with a candlestick that breaks out of a level but ends with an immedi
      Trend Screener
      STE S.S.COMPANY
      4.8 (87)
      Indicatore di tendenza, soluzione unica rivoluzionaria per il trading di tendenze e il filtraggio con tutte le importanti funzionalità di tendenza integrate in un unico strumento! È un indicatore multi-timeframe e multi-valuta al 100% non ridipingibile che può essere utilizzato su tutti i simboli/strumenti: forex, materie prime, criptovalute, indici e azioni. OFFERTA A TEMPO LIMITATO: l'indicatore di screening di supporto e resistenza è disponibile a soli 50$ e a vita. (Prezzo originale 250$) (o
      FX Volume
      Daniel Stein
      4.58 (33)
      Ricevi il tuo aggiornamento quotidiano sul mercato con dettagli e schermate tramite il nostro Morning Briefing qui su mql5 e su Telegram ! FX Volume è il PRIMO e UNICO indicatore di volume che fornisce una visione REALE del sentiment del mercato dal punto di vista del broker. Fornisce informazioni straordinarie su come gli operatori di mercato istituzionali, come i broker, sono posizionati sul mercato Forex, molto più velocemente dei rapporti COT. Vedere queste informazioni direttamente sul vo
      Currency Strength Exotics
      Bernhard Schweigert
      4.87 (30)
      ATTUALMENTE SCONTATO DEL 20%! La soluzione migliore per qualsiasi principiante o trader esperto! Questo indicatore è specializzato nel mostrare la forza della valuta per qualsiasi simbolo come coppie esotiche, materie prime, indici o futures. È il primo nel suo genere, qualsiasi simbolo può essere aggiunto alla nona riga per mostrare la vera forza della valuta di Oro, Argento, Petrolio, DAX, US30, MXN, TRY, CNH ecc. Si tratta di uno strumento di trading unico, di alta qualità e conveniente
      NextCandlePredictor No Repaint
      Martin Alejandro Bamonte
      1 (1)
      Indicatore NextCandlePredictor NextCandlePredictor, un indicatore di segnale con allerta che non ridisegna, non cambia colore, non si muove, non scompare e non ha ritardi. Ti aiuterà a identificare la direzione delle prossime candele in qualsiasi timeframe. Altamente raccomandato per i mercati ad alta volatilità come New York, Londra o anche la sovrapposizione di entrambi. Caratteristiche Principali: Versatilità nei Timeframe: Fornisce segnali rapidi e precisi in qualsiasi timeframe, da M1 a H1
      L'indicatore ** Chart Patterns All-in-One ** è progettato per aiutare i trader a visualizzare vari modelli grafici comunemente utilizzati nell'analisi tecnica. Questi modelli forniscono indicazioni sul comportamento potenziale del mercato, ma la loro redditività non è garantita o implicata dall'indicatore stesso. L'indicatore serve come strumento per valutare i modelli all'interno della propria strategia di trading. **Per il Bonus**, sentiti libero di inviarmi un messaggio o lasciare un comme
      This indicator is based on the Gann Signal indicator and acts as a market scanner. All you need to do is fill in the selected currency pairs in the settings and that’s it. Next, the indicator itself will view all these currency pairs and time frames from M5 to D1 simultaneously. When a new signal appears, the indicator will give you an Alert and also draw the letter N where this new signal will be.
      Currency Strength Wizard è un indicatore molto potente che ti fornisce una soluzione all-in-one per un trading di successo. L'indicatore calcola la potenza di questa o quella coppia forex utilizzando i dati di tutte le valute su più intervalli di tempo. Questi dati sono rappresentati in una forma di indice di valuta facile da usare e linee elettriche di valuta che puoi utilizzare per vedere il potere di questa o quella valuta. Tutto ciò di cui hai bisogno è collegare l'indicatore al grafico che
      Gold Channel is a volatility-based indicator, developed with a specific timing algorithm for the XAUUSD pair, which consists of finding possible corrections in the market. This indicator shows two outer lines, an inner line (retracement line) and an arrow sign, where the theory of the channel is to help identify overbought and oversold conditions in the market. The market price will generally fall between the boundaries of the channel. If prices touch or move outside the channel it is a tra
      FX Power MT4 NG
      Daniel Stein
      5 (12)
      Ricevi il tuo aggiornamento quotidiano sul mercato con dettagli e schermate tramite il nostro Morning Briefing qui su mql5 e su Telegram ! FX Power MT4 NG è la nuova generazione del nostro popolare misuratore di forza delle valute, FX Power. Cosa offre questo misuratore di forza di nuova generazione? Tutto ciò che avete amato dell'FX Power originale IN PIÙ Analisi della forza di ORO/XAU Risultati di calcolo ancora più precisi Periodi di analisi configurabili individualmente Limite di calcolo pe
      TakePropips Donchian Trend Pro
      Eric John Pajarillaga Aldana
      4.44 (16)
      TakePropips Donchian Trend Pro   (MT4) è uno strumento potente ed efficace che rileva automaticamente la direzione del trend utilizzando il canale Donchian e ti fornisce segnali di trading di entrata e uscita! Questo indicatore multifunzione include uno scanner di tendenza, segnali di trading, pannello statistico, screener, sessioni di trading e dashboard della cronologia degli avvisi. È progettato per fornirti segnali di trading e farti risparmiare ore analizzando i grafici! È possibile scarica
      Innanzitutto, vale la pena sottolineare che questo Strumento di Trading è un Indicatore Non-Ridipingente, Non-Ridisegnante e Non-Laggante, il che lo rende ideale per il trading professionale. Corso online, manuale utente e demo. L'Indicatore Smart Price Action Concepts è uno strumento molto potente sia per i nuovi che per i trader esperti. Racchiude più di 20 utili indicatori in uno solo, combinando idee di trading avanzate come l'Analisi del Trader del Circolo Interno e le Strategie di Trading
      Advanced Supply Demand
      Bernhard Schweigert
      4.91 (294)
      CURRENTLY 26% OFF !! Best Solution for any Newbie or Expert Trader! This indicator is a unique, high quality and affordable trading tool because we have incorporated a number of proprietary features and a new formula. With this update, you will be able to show double timeframe zones. You will not only be able to show a higher TF but to show both, the chart TF, PLUS the higher TF: SHOWING NESTED ZONES. All Supply Demand traders will love it. :) Important Information Revealed Maximize the potenti
      PRO Renko System
      Oleg Rodin
      5 (25)
      PRO Renko System è un sistema di trading altamente accurato appositamente progettato per il trading di grafici RENKO. Questo è un sistema universale che può essere applicato a vari strumenti di trading. Il sistema neutralizza efficacemente il cosiddetto rumore di mercato che consente di accedere a segnali di inversione accurati. L'indicatore è molto facile da usare e ha un solo parametro responsabile della generazione del segnale. Puoi facilmente adattare lo strumento a qualsiasi strumento
      Il dashboard di avviso RSI / TDI ti consente di monitorare gli RSI contemporaneamente (selezionabili da te) su ogni coppia principale scambiata. Puoi usarlo in due modi: 1. Seleziona più intervalli di tempo e il trattino ti mostrerà quando ci sono più intervalli di tempo estesi oltre le normali condizioni di trading. Un ottimo indicatore del fatto che il prezzo ha spinto al massimo di recente poiché ha raggiunto un livello di ipercomprato o ipervenduto su più intervalli di tempo, quindi u
      Trend Pulse
      Mohamed Hassan
      5 (4)
      Please contact me after purchase to immediately get your PDF strategy + documentation for Trend Pulse !  Introducing Trend Pulse , a unique and robust indicator capable of detecting bullish, bearish, and even ranging trends! Trend Pulse uses a special algorithm to filter out market noise with real precision. If the current symbol is moving sideways, Trend Pulse will send you a ranging signal, letting you know that it's not a good time to enter a trade. This excellent system makes Trend Pulse
      Market Reversal Alerts
      LEE SAMSON
      4.19 (113)
      Il profitto dalla struttura del mercato cambia quando il prezzo si inverte e si ritira. L'indicatore di avviso di inversione della struttura del mercato identifica quando una tendenza o un movimento di prezzo si sta avvicinando all'esaurimento e pronto a invertire. Ti avvisa dei cambiamenti nella struttura del mercato che in genere si verificano quando stanno per verificarsi un'inversione o un forte pullback. L'indicatore identifica inizialmente i breakout e lo slancio del prezzo, ogni volta
      Order Block Hunter
      Noha Mohamed Fathy Younes Badr
      5 (4)
      Order block hunter indicator is the best indicator for  hunt the order blocks that area where there has been a large concentration of limit orders waiting to be executed Order blocks are identified on a chart by observing previous price action and looking for areas where the price experienced significant movement or sudden changes in direction .This indicator does that for you by using very complicated codes and helps you to take the best areas To buy and sell because it make marks at the best a
      Disegna automaticamente i livelli di supporto e resistenza PIÙ i gap delle candele di propulsione sul vostro grafico, in modo da poter vedere dove il prezzo potrebbe dirigersi successivamente e/o potenzialmente invertire. Questo indicatore è stato progettato per essere utilizzato come parte della metodologia di trading di posizione insegnata sul mio sito web (The Market Structure Trader) e visualizza informazioni chiave per il targeting e le potenziali entrate. L'indicatore presenta 2 funzi
      Altri dall’autore
      ** All Symbols x All Timeframes scan just by pressing scanner button ** *** Contact me  to send you instruction and add you in "123 scanner group" for sharing or seeing experiences with other users. After 17 years of experience in the markets and programming, Winner indicator is ready. I would like to share with you! Introduction The 123 Pattern Scanner indicator with a special enhanced algorithm is a very repetitive common pattern finder with a high success rate . Interestingly, this Winner in
      Market Structure
      Reza Aghajanpour
      4.85 (26)
      ** All Symbols x All Timeframes scan just by pressing scanner button ** *** Contact me  to send you instruction and add you in "Market Structure group" for sharing or seeing experiences with other users. Introduction: Market structure is important for both new and professional traders since it can influence the liquidity and price action of a market (Breakout and Retest). It’s also one of the most commonly used techniques to understand trends, identify potential reversal points, and get a feel f
      The 1 2 3 Pattern Scanner
      Reza Aghajanpour
      4.79 (53)
      ** All Symbols x All Timeframes scan just by pressing scanner button ** After 17 years of experience in the markets and programming, Winner indicator is ready. I would like to share with you! *** Contact me  to send you instruction  and add you in "123 scanner group" for sharing or seeing experiences with other users. Introduction The 123 Pattern Scanner indicator with a special enhanced algorithm is a very repetitive common pattern finder with a high success rate . Interestingly, this Winner in
      Market Structure MT5
      Reza Aghajanpour
      5 (3)
      **   All Symbols   x   All Timeframes   scan just by pressing scanner button ** *** Contact me  to send you instruction and add you in "Market Structure group" for sharing or seeing experiences with other users. Introduction: Market structure is important for both new and professional traders since it can influence the liquidity and price action of a market. It’s also one of the most commonly used techniques to understand trends, identify potential reversal points, and get a feel for current mar
      **   All Symbols   x   All Timeframes   scan just by pressing scanner button ** *** Contact me  to send you instruction and add you in "Trend Reversal group" for sharing or seeing experiences with other users. Introduction: Trendlines are the most famous technical analysis in trading . Trendlines continually form on the charts of markets across all the different timeframes providing huge opportunities for traders to jump in and profit on the action. In the other hand,  The trendline reversal str
      QM Pattern Scanner MT5
      Reza Aghajanpour
      5 (3)
      Contact me  to send you instruction and add you in group. QM (Quasimodo) Pattern is based on Read The Market(RTM) concepts. The purpose of this model is to face the big players of the market (financial institutions and banks), As you know in financial markets, big traders try to fool small traders, but RTM prevent traders from getting trapped. This style is formed in terms of price candles and presented according to market supply and demand areas and no price oscillator is used in it. RTM con
      QM Pattern Scanner MT4
      Reza Aghajanpour
      4.75 (4)
      Contact me  to send you instruction and add you in group. QM (Quasimodo) Pattern is based on Read The Market(RTM) concepts. The purpose of this model is to face the big players of the market (financial institutions and banks), As you know in financial markets, big traders try to fool small traders, but RTM prevent traders from getting trapped. This style is formed in terms of price candles and presented according to market supply and demand areas and no price oscillator is used in it. RTM con
      M W Scanner
      Reza Aghajanpour
      5 (9)
      **   All Symbols   x   All Timeframes   scan just by pressing scanner button ** *** Contact me  to send you instruction and add you in "M W Scanner group" for sharing or seeing experiences with other users. Introduction: Double Top(M) and Double Bottom(W) is a very repetitive common type of price reversal patterns. Double Top resembles M pattern and indicates bearish reversal whereas Double Bottom resembles W pattern and indicates a bullish reversal that they have  high win  rate. The M W Scanne
      Swing Scanner
      Reza Aghajanpour
      4.6 (20)
      ** All Symbols x All Time frames scan just by pressing scanner button ** *** Contact me  to send you instruction and add you in "Swing scanner group" for sharing or seeing experiences with other users. Introduction: Swing Scanner is the indicator designed to detect swings in the direction of the trend and possible reversal swings. The indicator studies several price and time vectors to track the aggregate trend direction and detects situations in which the market is oversold or overbought and r
      ABCD Pattern Scanner
      Reza Aghajanpour
      5 (19)
      ** All Symbols x All Timeframes scan just by pressing scanner button ** *** Contact me  to send you instruction and add you in "ABCD scanner group" for sharing or seeing experiences with other users. Introduction This indicator scans AB=CD retracement patterns in all charts. The ABCD is the basic foundation for all harmonic patterns and highly repetitive with a high success rate . The ABCD Scanner indicator is a scanner reversal ABCD pattern that helps you identify when the price is about to ch
      Trend Reversal MT4
      Reza Aghajanpour
      5 (5)
      **   All Symbols   x   All Timeframes   scan just by pressing scanner button ** *** Contact me  to send you instruction and add you in "Trend Reversal group" for sharing or seeing experiences with other users. Introduction: Trendlines are the most famous technical analysis in trading . Trend lines continually form on the charts of markets across all the different timeframes providing huge opportunities for traders to jump in and profit on the action. In the other hand,  The trend line reversal s
      Head and Shoulder MT4
      Reza Aghajanpour
      5 (4)
      **   All Symbols   x   All Timeframes   scan just by pressing scanner button ** *** Contact me  to send you instruction and add you in "Head & Shoulders Scanner group" for sharing or seeing experiences with other users. Introduction: Head and Shoulders   Pattern  is a very repetitive common type of price reversal patterns. The pattern appears on all time frames and can be used by all types of traders and investors.   The  Head and Shoulders  Scanner indicator  Scans All charts just by pressing o
      ** All Symbols x All Time frames scan just by pressing scanner button ** *** Contact me  to send you instruction and add you in "Harmonic Scanner group" for sharing or seeing experiences with other users. Introduction Harmonic Patterns are best used to predict turning point. Harmonic Patterns give you high win rate and high opportunities for trade in during one day. This indicator detects the best and successful patterns based on Harmonic Trading concepts . The   Harmonic Patterns   Scanner   Sc
      Harmonic Pattern Scanner
      Reza Aghajanpour
      4.67 (15)
      ** All Symbols x All Time frames scan just by pressing scanner button ** *** Contact me  to send you instruction and add you in "Harmonic Scanner group" for sharing or seeing experiences with other users. Introduction Harmonic Patterns are best used to predict turning point. Harmonic Patterns give you high win rate and high opportunities for trade in during one day. This indicator detects the best and successful patterns base on Harmonic Trading books . The Harmonic Patterns Scanner Scans All ch
      AI Next Level
      Reza Aghajanpour
      5 (1)
      The next generation G P T AI model quickly gained significant attention with its broad range of capabilities and versatility, We used its expertise in assisting prediction prices in formulating and applying improved trading strategies. Our AI core is capable of extracting data insights from financial news, Sentiment Analysis , specific formula, Oscillators and indicators status and other unstructured data sources. This information can then be used in conjunction with other datasets to make our
      Swing Scanner MT5
      Reza Aghajanpour
      5 (5)
      **   All Symbols   x   All Time frames   scan just by pressing scanner button ** *** Contact me  to send you instruction and add you in "Swing scanner group" for sharing or seeing experiences with other users. Introduction: Swing Scanner   is the indicator designed to detect swings in the direction of the trend and possible reversal swings. The indicator studies several price and time vectors to track the aggregate trend direction and detects situations in which the market is oversold or overbou
      RSI Divergences Scanner MT5
      Reza Aghajanpour
      4.7 (10)
      ** All Symbols x All Timeframes scan just by pressing scanner button ** ***Contact me to send you instruction and add you in "RSI scanner group" for sharing or seeing experiences with other users. Introduction RSI divergence is a main technique used to determine trend reversing when it’s time to sell or buy because prices are likely to drop or pick in the charts. The RSI Divergence indicator can help you locate the top and bottom of the market. This indicator finds Regular divergence for pullba
      All Divergence Scanner MT4
      Reza Aghajanpour
      4.93 (15)
      ** All Symbols x All Timeframes scan just by pressing scanner button ** *** Contact me  to send you instruction and add you in "All Divergences scanner group" for sharing or seeing experiences with other users. Introduction Divergence is a main technique used to determine trend reversing when it’s time to sell or buy because prices are likely to drop or pick in the charts. All Divergence indicator can help you locate the top and bottom of the market. This indicator finds Regular divergences for
      M W Scanner MT5
      Reza Aghajanpour
      5 (4)
      **   All Symbols   x   All Timeframes   scan just by pressing scanner button ** *** Contact me  to send you instruction and add you in "M W Scanner group" for sharing or seeing experiences with other users. Introduction: Double Top(M) and Double Bottom(W) is a very repetitive common type of price reversal patterns. Double Top resembles M pattern and indicates bearish reversal whereas Double Bottom resembles W pattern and indicates a bullish reversal that they have  high win  rate. The M W Scanne
      Wolfe Wave Scanner MT5
      Reza Aghajanpour
      5 (3)
      **  All Symbols  x  All Timeframes  scan just by pressing scanner button ** *** Contact me  to send you instruction and add you in "Wolfe Wave Scanner group" for sharing or seeing experiences with other users. Introduction: A Wolfe Wave is created with five-wave patterns in price. It shows supply and demand and a fight towards a balance price. T hese waves of price actions can help traders identify the boundaries of   the trend . Also  It helps forecast how the price will move in the near futu
      **   All Symbols   x   All Timeframes   scan just by pressing scanner button ** *** Contact me  to send you instruction and add you in "Head & Shoulders Scanner group" for sharing or seeing experiences with other users. Introduction: Head and Shoulders   Pattern  is a very repetitive common type of price reversal patterns.   The pattern appears on all time frames and can be used by all types of traders and investors.   The  Head and Shoulders  Scanner indicator  Scans All charts just by pressing
      Wolfe Wave Scanner MT4
      Reza Aghajanpour
      4.56 (9)
      **  All Symbols  x  All Timeframes  scan just by pressing scanner button ** *** Contact me  to send you instruction and add you in "Wolfe Wave Scanner group" for sharing or seeing experiences with other users. Introduction: A Wolfe Wave is created with five-wave patterns in price. It shows supply and demand and a fight towards a balance price. T hese waves of price actions can help traders identify the boundaries of   the trend . Also  It helps forecast how the price will move in the near future
      MACD Divergences Scanner MT5
      Reza Aghajanpour
      4.25 (4)
      ** All Symbols x All Time frames scan just by pressing scanner button ** *** Contact me  to send you instruction and add you in "Divergence group" for sharing or seeing experiences with other users. Introduction MACD divergence is a main technique used to determine trend reversing when it’s time to sell or buy because prices are likely to drop or pick in the charts. The MACD Divergence indicator can help you locate the top and bottom of the market. This indicator finds Regular divergence for pul
      ABCD Pattern Scanner MT5
      Reza Aghajanpour
      5 (8)
      ** All Symbols x All Timeframes scan just by pressing scanner button ** *** Contact me  to send you instruction and add you in "ABCD scanner group" for sharing or seeing experiences with other users. Introduction This indicator scans AB=CD retracement patterns in all charts. The ABCD is the basic foundation for all harmonic patterns and highly repetitive with a high success rate . The ABCD Scanner indicator is a scanner reversal ABCD pattern that helps you identify when the price is about to cha
      Introduction RSI divergence is a main technique used to determine trend reversing when it’s time to sell or buy because prices are likely to drop or pick in the charts. The RSI Divergence indicator can help you locate the top and bottom of the market. This indicator finds Regular divergence for pullback the market and also finds hidden RSI Divergence to show continuing trend. This indicator shows divergence on the RSI that is a strong hint for an excellent entry point and finds immediately with
      FREE
      EA Gold Avatar
      Reza Aghajanpour
      5 (4)
      Gold Avatar is a Fully Automated for Trading XAUUSD/Gold. It will be 300$, only the first 4 sales are 199$. ** New Update = Version 3 ** Live signal monitoring: myfxbook.com/portfolio/gold-avatar/10941196 Contact me immediately after the purchase to send you instruction and add you in group. Default Settings for XAUUSD M15 FEATURES: Easy-to-use, just add EA on chart without any setting. News Filter and Auto GMT Time are  supported XAUUSD - M15 Sets are provided  Limited number of Buyers
      You can find full version here: Harmonic Pattern Scanner MT4 Harmonic Pattern Scanner MT5 Introduction Harmonic Patterns are best used to predict turning point. Harmonic Patterns give you high win rate and high opportunities for trade in during one day. This indicator detects the best and successful patterns base on   Harmonic Trading   books by   Mr. Scott M.. Main Features Detect the best and     most successful patterns : Gartley, Bat, Crab, Butterfly, Cypher, Shark, Alt_Bat, Deep_Crab Easy-
      FREE
      Market Heartbeat
      Reza Aghajanpour
      5 (7)
      Market Heartbeat in your hand! Introduction The Market Heartbeat indicator with a special enhanced algorithm (volume, money flow, cycle of market and a secret value) is a very repetitive trend finder with a high success rate . Interestingly, this Winner indicator indicates that the trend has changed its direction or the end of a trend retracement or even appears at the range market. The Market Heartbeat can use in scalping trading or trend trading. It finds immediately with alarm, notification a
      This is diamond! Contact me  to send you instruction and add you in group. Diamond Pattern is based on Read The Market(RTM) concepts. The purpose of this model is to face the big players of the market (financial institutions and banks), As you know in financial markets, big traders try to fool small traders, but RTM prevent traders from getting trapped. This style is formed in terms of price candles and presented according to market supply and demand areas and no price oscillator is used in it
      **   All Symbols   x   All Timeframes   scan just by pressing scanner button ** *** Contact me  to send you instruction and add you in "Channel Scanner group" for sharing or seeing experiences with other users. Introduction: The Channel pattern is described as the area located between two trend lines. This area is used for a measure of a trading range. In this case, the upper trend line connects price highs while the lower trend line connects price lows. Also when it comes to breakout points, it
      Filtro:
      Mashal Khan
      129
      Mashal Khan 2024.09.04 11:37 
       

      A very nice indicator, especially for bigger time frames, 1H and above, accurtaely indicate reversal and break of structures. highly recommended for day and swing traders.

      Reza Aghajanpour
      85952
      Risposta dello sviluppatore Reza Aghajanpour 2024.09.04 12:50
      I am so glad and It is my pride.
      Enjoy your trading. 🌹⛱️🏖️🥇😍
      asahi0808
      170
      asahi0808 2024.01.07 05:42 
       

      L'utente non ha lasciato alcun commento sulla valutazione.

      Reza Aghajanpour
      85952
      Risposta dello sviluppatore Reza Aghajanpour 2024.09.04 12:51
      I am so glad and It is my pride.
      Enjoy your trading. 🌹⛱️🏖️🥇😍
      Jack Hudson
      260
      Jack Hudson 2023.12.06 17:48 
       

      Really loving this. Gives divergence signals in real time allowing you to enter or wait for your TP confirmations/confluence.

      Reza Aghajanpour
      85952
      Risposta dello sviluppatore Reza Aghajanpour 2023.12.07 02:43
      I am so glad and It is my pride.
      Enjoy your trading. 🌹⛱️🏖️🥇😍
      james272
      144
      james272 2023.04.14 00:36 
       

      L'utente non ha lasciato alcun commento sulla valutazione.

      Reza Aghajanpour
      85952
      Risposta dello sviluppatore Reza Aghajanpour 2023.11.03 15:34
      Please contact me to send you instruction and add you in group to have profitable trades. 🙏🌹
      davevicens
      321
      davevicens 2023.01.03 16:31 
       

      First operation divergence 5 min and profit achieved. It gives good results. Very accurate!!!! Great Work

      Reza Aghajanpour
      85952
      Risposta dello sviluppatore Reza Aghajanpour 2023.01.03 17:16
      I am so glad and It is my pride.
      Enjoy your trading. 🌹⛱️🏖️🥇😍
      ACastilla
      499
      ACastilla 2022.12.29 18:13 
       

      Please send me the instructions.Regards

      Schneider Waldemar
      28
      Schneider Waldemar 2022.09.24 14:45 
       

      TOP, sehr nützlich und Überschaubar!

      Reza Aghajanpour
      85952
      Risposta dello sviluppatore Reza Aghajanpour 2022.09.24 15:34
      I am so glad and It is my pride.
      Enjoy your trading. 🌹⛱️🏖️🥇😍
      suresh2425
      236
      suresh2425 2022.09.24 07:01 
       

      Scanning is Average. Cons: Eod analysis not possible. No dashboard.

      Don Croome
      146
      Don Croome 2022.08.25 06:34 
       

      Another great product from Reza. A real time saver. Works well. Simple, easy to set so as not to overload your phone alerts with setups. Cheers

      Reza Aghajanpour
      85952
      Risposta dello sviluppatore Reza Aghajanpour 2022.08.25 06:36
      Thank you for your awesome feedback. It is my pride.😍🌹🙏
      ⭐⭐⭐⭐⭐
      Christian Alexander Foehl
      617
      Christian Alexander Foehl 2022.08.13 12:44 
       

      Great work finally an indicator that reliably scans all charts in all timeframes for divergences, very useful in trading.

      Reza Aghajanpour
      85952
      Risposta dello sviluppatore Reza Aghajanpour 2022.08.13 13:04
      Thank you for your awesome feedback. It is my pride.😍🌹🙏
      ⭐⭐⭐⭐⭐
      Shahid Khan uk
      82
      Shahid Khan uk 2022.08.01 16:45 
       

      not working,,gives false signals

      Reza Aghajanpour
      85952
      Risposta dello sviluppatore Reza Aghajanpour 2022.11.21 05:36
      Please contact me to send you instruction and add you in group. 🙏🌹
      elkonsis
      240
      elkonsis 2022.07.27 22:09 
       

      Very good indicator, fits my job perfectly. Especially scanning is very useful for me. In addition, the developer is very relevant and provides fast turnaround.

      Reza Aghajanpour
      85952
      Risposta dello sviluppatore Reza Aghajanpour 2022.07.27 22:15
      I am so glad and It is my pride.
      Enjoy your trading. 🌹⛱️🏖️🥇😍
      Roczaye
      126
      Roczaye 2022.07.03 19:54 
       

      I'm loving all your indicators thank you. Just make it available for MT5 too please

      Reza Aghajanpour
      85952
      Risposta dello sviluppatore Reza Aghajanpour 2022.07.03 20:09
      Thank you for your positive feedback. 🌹🙏
      Enjoy your trading. 🌹⛱️🏖️🥇
      LeosTrader
      113
      LeosTrader 2022.06.26 18:19 
       

      L'utente non ha lasciato alcun commento sulla valutazione.

      Reza Aghajanpour
      85952
      Risposta dello sviluppatore Reza Aghajanpour 2022.06.28 14:49
      It is my pride. Enjoy your trading. 🌹⛱️🏖️🥇
      Lambrate
      94
      Lambrate 2022.06.23 09:47 
       

      it works, rsi divergence is a killer with good SL and a great Money Managment

      Reza Aghajanpour
      85952
      Risposta dello sviluppatore Reza Aghajanpour 2022.06.28 14:47
      I am so glad and It is my pride.
      Enjoy your trading. 🌹⛱️🏖️🥇😍
      samsnz
      94
      samsnz 2022.03.27 16:56 
       

      good indicator, creator's support is very good, development is ongoing and good, creator responds to feedback. I have all the indicators of Reza. Still trying to figure out how to work with them but indi's seem to have good potential.

      Reza Aghajanpour
      85952
      Risposta dello sviluppatore Reza Aghajanpour 2022.03.27 17:37
      Thank you for your positive feedback.🌹🌹🙏
      janneman888
      64
      janneman888 2022.03.15 10:19 
       

      Very good indicator with solid results. Thanks for the author for updating it as well.

      Reza Aghajanpour
      85952
      Risposta dello sviluppatore Reza Aghajanpour 2022.03.15 11:37
      Thank you for your review. Of course, I will be here to you have more win trade. 🌹🙏🌹
      Kyogo
      2339
      Kyogo 2022.02.22 14:13 
       

      Great work and support by author. Constantly improving and adding value.

      Reza Aghajanpour
      85952
      Risposta dello sviluppatore Reza Aghajanpour 2022.02.22 14:34
      Thank you for your positive feedback.🙏🌹
      Rispondi alla recensione
      Versione 1.17 2024.08.03
      - Improved algorithm
      Versione 1.16 2023.05.21
      - Added "Breakout" method
      Versione 1.15 2023.05.05
      - Added color option for divergence lines in input setting
      Versione 1.14 2023.02.23
      -Added new option : Selective Time Frames for scan in input setting
      Versione 1.13 2022.09.08
      - Fixed a little bug
      Versione 1.12 2022.04.01
      - Added Email-Alert
      Versione 1.11 2022.03.29
      - Fixed a bug
      Versione 1.10 2022.03.29
      Added chart view option(white,Black,Don't change)
      Versione 1.9 2022.03.27
      - Add Name indicator option, "Name in chart" at input part for a user request.
      Versione 1.8 2022.03.09
      - Add pattern name in alarm and notification based on users ask
      Versione 1.7 2022.02.25
      - Improved Push notification with Stop Loss/Entry Point/Take Profits
      Versione 1.6 2022.02.22
      - Scan just your market watch,
      Please download new version.
      Versione 1.5 2022.02.08
      - Add "Market watch or just currency pairs" button for scan
      Versione 1.4 2022.02.07
      - Add Stop loss/Entry Point/Take Profit Levels
      Please download new version
      Versione 1.3 2022.02.02
      Improved view
      Versione 1.2 2022.02.01
      - Fixed bug, Please download this vesion
      Versione 1.1 2022.02.01
      enhanced default input