UPD1 X00 Levels MT5
- Indicatori
- Vitaliy Kuznetsov
- Versione: 2.70
- Aggiornato: 8 dicembre 2023
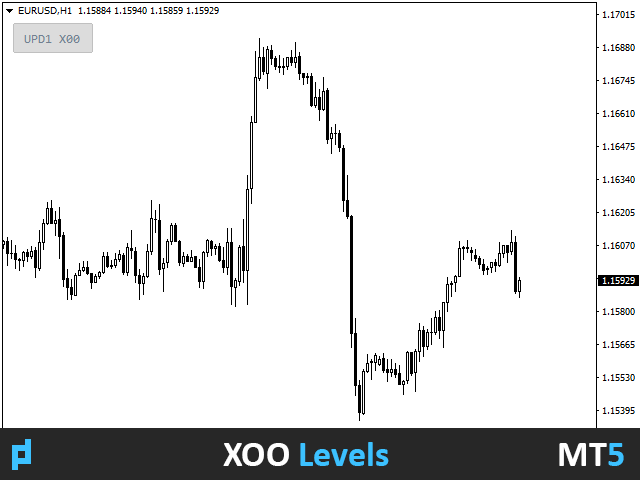
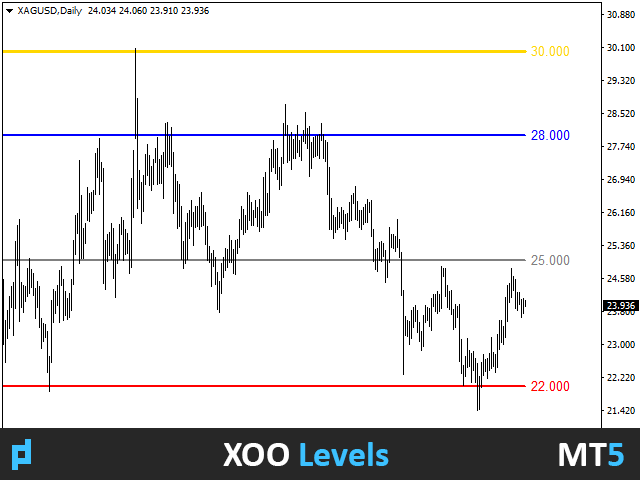
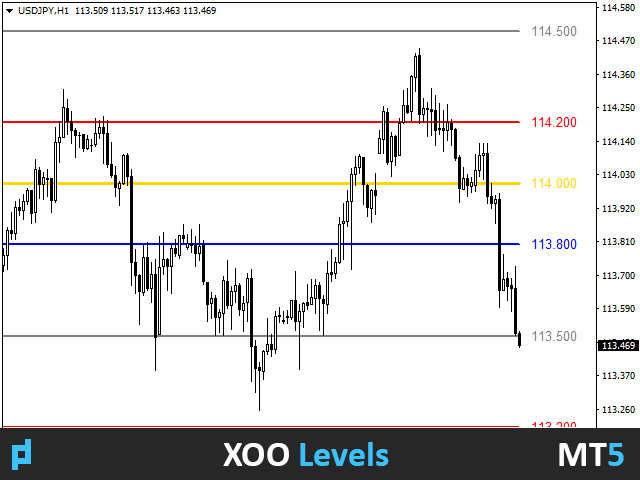
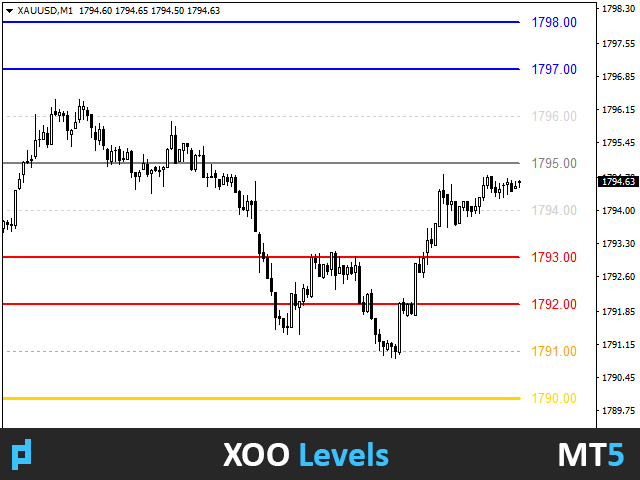
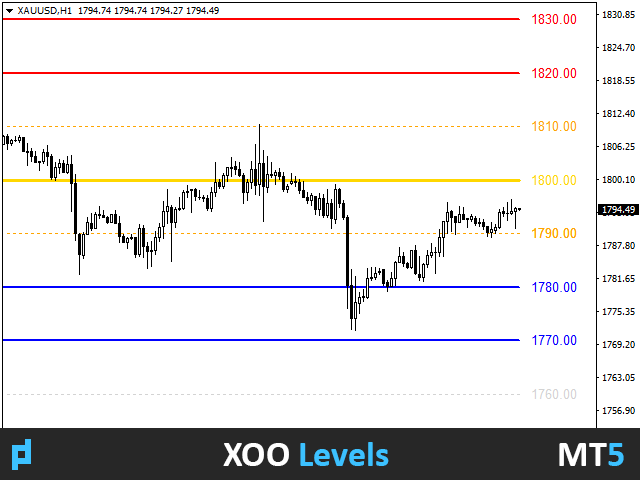
L'indicatore mostra livelli circolari sul grafico.
Sono anche chiamati livelli psicologici, bancari o dei principali operatori.
A questi livelli si verifica una vera e propria lotta tra tori e orsi, l'accumulo di molti ordini, che porta a un aumento della volatilità.
L'indicatore si adatta automaticamente a qualsiasi strumento e timeframe.
Se il livello 80 viene rotto e poi testato, acquistare. Se il livello 20 viene rotto e poi testato, vendere. L'obiettivo è 00.
Attenzione. A causa dei forti livelli di supporto e resistenza, il prezzo potrebbe non raggiungere il livello 00.
Parametri di ingresso.
Bars Count - lunghezza delle righe.
Show 00 Levels - per visualizzare o meno i livelli 00.
Show 10, 90 Levels.
Show 20, 80 Levels.
Show 30, 70 Levels.
Show 40, 60 Levels.
Show 50 Levels.
N Lines - parametro che limita il numero di livelli sul grafico.
Distance 00 Levels - distanza tra i livelli (automaticamente o manualmente).
Line Position - linee davanti o dietro il grafico.
Visual Button - visualizzazione dei pulsanti (on/off).
Corner - angolo di attacco del pulsante.
X indent - rientro orizzontale in pixel.
Y indent - rientro verticale in pixel.
Label Visual - visualizza la didascalia del livello con i numeri.
Label Font Size - dimensione del carattere.
Label Shift Bars - rientro della didascalia in barre.
Label Tooltip - visualizza la scritta sotto il cursore sopra il livello.
Label Name - etichetta completa o breve del livello.
Levels Style - stile di disegno delle linee.
Levels Width - larghezza.
Levels Color - colore.
Alert - abilita/disabilita l'avviso.
Alert Work Time - tempo di lavoro dell'avviso 00:00-23:59 (modificabile).
Alert Pop Up - finestra a comparsa.
Alert Push - avviso nell'applicazione.
Alert Email - notifica per posta elettronica.
Alert Sound - abilita o disabilita il suono.
Alert Sound Name - il file audio.
Object ID - prefisso al nome dell'oggetto.

Es un excelente indicador, preparado de forma profesional, se le puede configurar los niveles y esas cosas son detalles que hacen que este indicador sea muy bueno