• Panoramica
  • Recensioni (7)
  • Commenti (9)
  • Novità

Multi Chart Crosshairs MT5

5

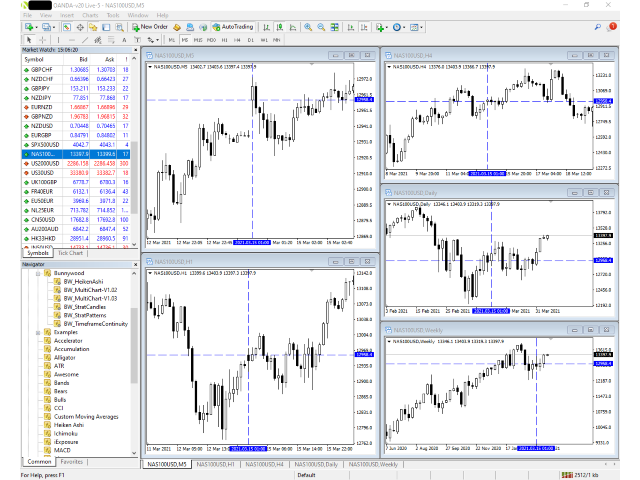
Questo indicatore è progettato per rendere le revisioni di molti grafici su scale temporali diverse più rapide e più facili da eseguire.

  • Tieni traccia di tempo e prezzo su più grafici
  • Cambia simbolo su un grafico e anche tutti gli altri grafici dello stesso simbolo verranno modificati.
  • Facile da usare, veloce da padroneggiare

L'indicatore consente di identificare il prezzo e l'ora in cui si trova il puntatore del mouse sul grafico corrente, su tutti gli altri grafici aperti sullo stesso simbolo. Ciò consente di visualizzare rapidamente le informazioni su più grafici, mentre normalmente è necessario dedicare un po' di tempo all'identificazione della stessa posizione.

Puoi anche scegliere di tenere traccia solo del tempo in tutti i grafici aperti. Ciò consente di navigare facilmente durante la caccia alla divergenza.

Se cambi il Simbolo in un grafico, tutti gli altri grafici dello stesso simbolo passeranno al nuovo Simbolo, mantenendo le loro impostazioni temporali.

Come usare

Quando rivedo un grafico, mi piace osservare diversi intervalli di tempo per identificare tendenze e livelli di trading. Ho creato questo strumento per aiutare in questo, e anche per il backtest visivo, in cui sto esaminando diversi grafici per un periodo prolungato.

Lo strumento aggiunge un mirino allo schermo che segue il puntatore del mouse. Si attiva quando il tasto CTRL o MAIUSC è premuto, quindi non è sempre presente, ma è quando lo desideri.

Una volta attivato, puoi puntare su qualsiasi grafico in cui desideri tracciare e su qualsiasi altro grafico con lo stesso simbolo, il mirino mostrerà lo stesso orario e lo stesso prezzo anche su quel grafico. I grafici in altre finestre faranno scorrere automaticamente il display in modo che la combinazione tempo/prezzo sia al centro del display.

Puoi aggiungere elementi di disegno al grafico senza influenzare i mirini che rimangono visibili fino a quando non premi il tasto ESC. Una volta premuto, il tasto ESC nasconde nuovamente il mirino fino a quando non ne avrai bisogno di nuovo.

Dimostrazione

Si prega di rivedere il video che mostra l'indicatore in uso.


Spero che lo trovi utile quanto me.

Grazie per il vostro interesse!


Recensioni 7
mm0079
127
mm0079 2024.01.15 18:46 
 

Works as promised. I only could not change the colour input for crosshair (on mac) but thats all.

Forexezek
48
Forexezek 2023.11.14 10:51 
 

Hello! I bought the indicator. Very good! However, when I'm not using it, it would be nice if MT5's built-in crosshairs would work again to press the middle mouse button. It's deleting this feature for some reason. Could you modify it like this? Please

Sorry, but I didn't see that you already corrected it and wrote an answer. Thank you very much!

Could there possibly be a setting to set the crosshairs in the background/foreground? 100% perfect indicator after the repair! You are a perfect seller!

Igazi
151
Igazi 2023.05.26 19:05 
 

WOW! What an amazing indicator! Worth the purchase!

Prodotti consigliati
Trading Utility for Forex Currency Pairs Only not for Gold  Functions Auto Lot Calculation based on Risk Auto stoploss  Auto TakeProfit Breakeven Auto Close Half % Close in percentage with respect to the PIPs Pending Orders BuyLimit Sell Limit with distances BuyStop Sell Stop    with distances Trading Informations Risk in percentage For Multiple trades Combine Takeprofit and Combine Stoplosses
Multicurrency and multitimeframe modification of the Stochastic Oscillator. You can specify any desired currencies and timeframes in the parameters. The panel displays the current values and intersections of the lines — Signal and Main (stochastics crossover). Also, the indicator can send notifications when crossing overbought and oversold levels. By clicking on a cell with a period, this symbol and period will be opened. This is MTF Scanner. The key to hide the dashboard from the chart is "D"
PipFinite Trend PRO MT5
Karlo Wilson Vendiola
4.87 (664)
Breakthrough Solution For Trend Trading And Filtering With All Important Features Built Inside One Tool! Trend PRO's smart algorithm detects the trend, filters out market noise and gives entry signals with exit levels. The new features with enhanced rules for statistical calculation improved the overall performance of this indicator. Important Information Revealed Maximize the potential of Trend Pro, please visit www.mql5.com/en/blogs/post/713938 The Powerful Expert Advisor Version Automa
L'indicatore costruisce le quotazioni attuali, che possono essere confrontate con quelle storiche e su questa base fanno una previsione del movimento dei prezzi. L'indicatore ha un campo di testo per una rapida navigazione fino alla data desiderata. Opzioni: Simbolo - selezione del simbolo che visualizzerà l'indicatore; SymbolPeriod - selezione del periodo da cui l'indicatore prenderà i dati; IndicatorColor - colore dell'indicatore; HorisontalShift - spostamento delle virgolette d
Owl Smart Levels MT5
Sergey Ermolov
4.47 (36)
Versione MT4  |  FAQ L' indicatore Owl Smart Levels è un sistema di trading completo all'interno dell'unico indicatore che include strumenti di analisi di mercato popolari come i frattali avanzati di Bill Williams , Valable ZigZag che costruisce la corretta struttura a onde del mercato, e i livelli di Fibonacci che segnano i livelli esatti di entrata nel mercato e luoghi per prendere profitti. Descrizione dettagliata della strategia Istruzioni per lavorare con l'indicatore Consulente-assistente
Noize Absorption Index - is the manual trading system that measures the difference of pressure between bears forces and bulls forces. Green line - is a noize free index that showing curent situation. Zero value of index shows totally choppy/flat market.Values above zero level shows how powerfull bullish wave is and values below zero measures bearish forces.Up arrow appears on bearish market when it's ready to reverse, dn arrow appears on weak bullish market, as a result of reverse expectation.
Your Trend Friend
Luigi Nunes Labigalini
The trend is your friend! Look at the color of the indicator and trade on that direction. It does not  repaint. After each candle is closed, that's the color of the trend. You can focus on shorter faster trends or major trends, just test what's most suitable for the symbol and timeframe you trade. Simply change the "Length" parameter and the indicator will automatically adapt. You can also change the color, thickness and style of the lines. Download and give it a try! There are big movements
This indicator has been developed to identify and display these trends quickly and easily, allowing you to see instantly, those currency pairs which are trending, and those which are not – and in all timeframes, with just one click. The 28 currency pairs are displayed as a fan as they sweep from strong to weak and back again, and this is why we call it the ‘currency array’. All 28 pairs are arrayed before you, giving an instant visual description of those pairs that are trending strongly, those
Orbit Rage Final 2
BILLY ARANDUQUE ABCEDE
Note : i only sell this EA on MQL5, any other sellers is fake. Orbit Rage Final, a cutting-edge trading strategy meticulously designed around the bull/bear candle approach and divergence analysis. This powerful tool is engineered to empower you to shape the life you desire. To embark on this transformative journey, simply download and seamlessly integrate it into your MetaTrader 4 platform by placing it in the experts advisors folder. Orbit Rage Final revolutionizes trading by offering a risk-f
HMA Trend Professional MT5
Pavel Zamoshnikov
4.4 (5)
Improved version of the free HMA Trend indicator (for MetaTrader 4) with statistical analysis. HMA Trend is a trend indicator based on the Hull Moving Average (HMA) with two periods. HMA with a slow period identifies the trend, while HMA with a fast period determines the short-term movements and signals in the trend direction. The main differences from the free version: Ability to predict the probability of a trend reversal using analysis of history data. Plotting statistical charts for analyz
Volality Index Scalper
Lesedi Oliver Seilane
Volality Index scalper indicator  Meant for Volality pairs such as Volality 10, 25, 50, 75 and 100 The indicator works on all timeframes from the 1 minute to the monthly timeframe the indicator is non repaint the indicator has 3 entry settings 1 color change on zero cross 2 color change on slope change 3 color change on signal line cross Orange line is your sell signal Blue line is your buy signal.
Inguz
Maxim Kuznetsov
Ing (inguz,ingwar) - the 23rd rune of the elder Futhark ᛝ, Unicode+16DD. Add some runic magic to your trading strategies. The correct marking of the daily chart will indicate to you the successful moments for counter-trend trading. Simple to use, has high efficiency in volatile areas. Be careful in lateral movements. Signals ᛝ are generated when the main lines of construction intersect. Red arrow down - recommended sales Blue up arrow - recommended purchases rare purple arrows indicate
Questo indicatore ti mostrerà i valori TP e SL (in quella valuta) che hai già impostato per ogni ordine sui grafici (chiuso alla riga della transazione/ordine) che ti aiuteranno molto a stimare il tuo profitto e la tua perdita per ogni ordine. E ti mostra anche i valori PIP. il formato mostrato è "Valori valutari dei nostri profitti o perdite / valori PIP". Il valore TP sarà mostrato in colore verde e il valore SL sarà mostrato in colore rosso. Per qualsiasi domanda o ulteriori informazioni,
The Riko Trend indicator is a revolutionary trend trading and filtering solution with all the important features of a trend tool built into one tool! The Riko Trend indicator is good for any trader, suitable for any trader for both forex and binary options. You don’t need to configure anything, everything is perfected by time and experience, it works great during a flat and in a trend. The Riko Trend indicator is a technical analysis tool for financial markets that reflects the current price
Was: $249  Now: $99   Market Profile defines a number of day types that can help the trader to determine market behaviour. A key feature is the Value Area, representing the range of price action where 70% of trading took place. Understanding the Value Area can give traders valuable insight into market direction and establish the higher odds trade. It is an excellent addition to any system you may be using. Inspired by Jim Dalton’s book “Mind Over Markets”, this indicator is designed to suit the
Be notified of every color change of Heiken Ashi (HA) candles. The indicator will trigger past and new signals every time that HA candles change their colors. ( Note : this tool is based on the code of Heiken Ashi indicator developed by MetaQuotes Software Corp.) Features The signals are triggered at closing of last bar/opening of a new bar; Any kind of alerts can be enabled: Dialog Box, Email message, SMS notifications for smartphones and tablets, and Sound alerts; By default, up arrows are p
US30NinjaMT5
Satyaseelan Shankarananda Moodley
US30 Ninja is a 5 minute scalping indicator that will let know you when there is a trade set up (buy or sell). Once the indicator gives the trade direction, you can open a trade and use a 30 pip stop loss and a 30 pip to 50 pip take profit. Please trade at own own risk. This indicator has been created solely for the US30 market and may not yield positive results on any other pair. 
PZ Trend Trading MT5
PZ TRADING SLU
3.67 (3)
Trend Trading is an indicator designed to profit as much as possible from trends taking place in the market, by timing pullbacks and breakouts. It finds trading opportunities by analyzing what the price is doing during established trends. [ Installation Guide | Update Guide | Troubleshooting | FAQ | All Products ] Trade financial markets with confidence and efficiency Profit from established trends without getting whipsawed Recognize profitable pullbacks, breakouts and early reversals The ind
Il livello Premium è un indicatore unico con una precisione superiore all'80% delle previsioni corrette! Questo indicatore è stato testato dai migliori Specialisti di Trading per più di due mesi! L'indicatore dell'autore che non troverai da nessun'altra parte! Dagli screenshot puoi vedere di persona la precisione di questo strumento! 1 è ottimo per il trading di opzioni binarie con un tempo di scadenza di 1 candela. 2 funziona su tutte le coppie di valute, azioni, materie prime, cript
Cumulative delta indicator As most traders believe, the price moves under the pressure of market buying or selling. When someone redeems an offer standing in the cup, the deal is a "buy". If someone pours into the bid standing in the cup - the deal goes with the direction of "sale". The delta is the difference between purchases and sales. A cumulative delta - the difference between the cumulative sum of purchases and sales for a certain period of time. It allows you to see who is currently contr
Laguerre SuperTrend Clouds   adds an Adaptive Laguerre averaging algorithm and alerts to the widely popular SuperTrend indicator. As the name suggests,   Laguerre SuperTrend Clouds (LSC)   is a trending indicator which works best in trendy (not choppy) markets. The SuperTrend is an extremely popular indicator for intraday and daily trading, and can be used on any timeframe. Incorporating Laguerre's equation to this can facilitate more robust trend detection and smoother filters. The LSC uses the
Robust median Renko style indicator for creating custom charts resembling Median Renko, Mean Renko, Turbo Renko and Better Renko candles as well as vanilla Renko with wicks plus Point-O charts. This all in one package provides all of the signals needed by day traders, scalpers, and even long-term traders. Main characteristics The indicator is an overlay on the main chart so it is possible to utilize one-click trading and order manipulation directly on the custom charts. Visual order placement
Una delle sequenze numeriche è chiamata "Sequenza di incendi boschivi". È stata riconosciuta come una delle nuove sequenze più belle. La sua caratteristica principale è che questa sequenza evita andamenti lineari, anche quelli più brevi. È questa proprietà che ha costituito la base di questo indicatore. Quando si analizza una serie temporale finanziaria, questo indicatore cerca di rifiutare tutte le possibili opzioni di tendenza. E solo se fallisce, riconosce la presenza di una tendenza e dà il
This indicator is used to compare the relative strength of the trade on the chart against the other several selected symbols. By comparing the price movement of each traded variety based on the same base day, several trend lines of different directions can be seen, reflecting the strong and weak relationship between the several different traded varieties, so that we can have a clearer understanding of the market trend. For example, you can apply this indicator on a EurUSD chart and compare it
Fibonacci and RSI Demo version MQL5
Carlos Daniel Vazquez Rosas
4 (1)
Fibonacci and RSI. Demo versión only works with GBPUSD. For full version, please, visit visit https://www.mql5.com/en/market/product/52101 The indicator is a combination of the Fibonacci and RSI indicators. Every time the price touches one of the fibonacci levels and the rsi condition is met, an audible alert and a text alert are generated. Parameters number_of_candles : It is the number of candles that will be calculated. If you put 100, the indicator will give you the maximum and min
FREE
The Jackson Auto Candlestick Pattern . It a powerful price action tool which auto detect and alert a hided powerful candlestick patterns . It came with few different chart skins. You can use this indicator alone to make profit, but it powerful when you combine it with trendlines, You can download The Jackson Auto Trendlines for free Link : UCRW695l9Wgg2ucnnf5DL5Vw  List of Candlestick Pattern it detect   1. Bullish & Bearish Engulfing's 2. Top and Bottom Tweezer 3. Bullish and Bearish Harams 4.
PipFinite Energy Beam MT5
Karlo Wilson Vendiola
5 (1)
Pipfinite creates unique, high quality and affordable trading tools. Our tools may or may not work for you, so we strongly suggest to try the Demo Version for MT4 first. Please test the indicator prior to purchasing to determine if it works for you. We want your good reviews, so hurry up and test it for free...we hope you will find it useful. Combo Energy Beam with Swing Control Strategy: Confirm swing pullback signals Watch Video: (Click Here) Energy Beam with Trend Laser Strategy: Confirm Tr
Dynamic Trading Panel Discover precision in trading with our innovative trading panel: Equity-Based Lot Sizing : Automatically calculate lot sizes based on a user-set percentage of your account equity. Tailor your trades to your risk comfort zone. Intuitive Risk Management : If no stop loss is set, the position is opened using the set percentage as margin. If a stop loss is chosen, your potential loss is capped at the user-defined percentage, safeguarding your equity. Visual SL/TP Setting : Simp
Show Pips for MT5
Roman Podpora
4.59 (17)
This information indicator will be useful for those who always want to be aware of the current situation on the account. - More useful indicators The indicator displays data such as profit in points, percentage and currency, as well as the spread for the current pair and the time until the bar closes on the current timeframe. There are several options for placing the information line on the chart: - To the right of the price (runs behind the price); - As a comment (in the upper left corner
FREE
Description ABC Trend Detector Pro  is an indicator that identifies impulses and trends in the market and displays their presence on the price chart. Found patterns are drawn as colored connecting lines between their highs and lows. Above / below each extreme, the value of the range (the number of pips) of the trend is displayed. Recommendations You can use this indicator to determine the trend and, accordingly, to determine the direction of opening a position or closing an opposite posit
Gli utenti di questo prodotto hanno anche acquistato
Atomic Analyst MT5
Issam Kassas
3.64 (11)
Innanzitutto, vale la pena sottolineare che questo indicatore di trading non è repaint, non è ridisegno e non presenta ritardi, il che lo rende ideale sia per il trading manuale che per quello automatico. L'Analista Atomico è un indicatore di azione del prezzo PA che utilizza la forza e il momentum del prezzo per trovare un miglior vantaggio sul mercato. Dotato di filtri avanzati che aiutano a rimuovere rumori e segnali falsi, e aumentare il potenziale di trading. Utilizzando più strati di in
Innanzitutto è importante sottolineare che questo sistema di trading è un indicatore Non-Repainting, Non-Redrawing e Non-Lagging, il che lo rende ideale sia per il trading manuale che per quello automatico. Il "Sistema di Trading Smart Trend MT5" è una soluzione completa pensata sia per i trader principianti che per quelli esperti. Combina oltre 10 indicatori premium e offre più di 7 robuste strategie di trading, rendendolo una scelta versatile per diverse condizioni di mercato. Strategia di Tre
Quantum Trend Sniper
Bogdan Ion Puscasu
5 (37)
Presentazione       Quantum Trend Sniper Indicator   , l'innovativo indicatore MQL5 che sta trasformando il modo in cui identifichi e scambi le inversioni di tendenza! Sviluppato da un team di trader esperti con un'esperienza di trading di oltre 13 anni,       Indicatore Quantum Trend Sniper       è progettato per spingere il tuo viaggio di trading verso nuove vette con il suo modo innovativo di identificare le inversioni di tendenza con una precisione estremamente elevata. *** Acquista Quant
Trend Screener Pro MT5
STE S.S.COMPANY
4.89 (61)
Indicatore di tendenza, soluzione unica rivoluzionaria per il trading di tendenze e il filtraggio con tutte le importanti funzionalità di tendenza integrate in un unico strumento! È un indicatore multi-timeframe e multi-valuta al 100% non ridipingibile che può essere utilizzato su tutti i simboli/strumenti: forex, materie prime, criptovalute, indici e azioni. Trend Screener è un indicatore di tendenza che segue un indicatore efficiente che fornisce segnali di tendenza a freccia con punti nel gra
RelicusRoad Pro MT5
Relicus LLC
4.81 (21)
Ora $ 147 (aumentando a $ 499 dopo alcuni aggiornamenti) - account illimitati (PC o MAC) Manuale utente di RelicusRoad + Video di formazione + Accesso al gruppo Discord privato + Stato VIP UN NUOVO MODO DI GUARDARE IL MERCATO RelicusRoad è l'indicatore di trading più potente al mondo per forex, futures, criptovalute, azioni e indici, fornendo ai trader tutte le informazioni e gli strumenti di cui hanno bisogno per rimanere redditizi. Forniamo analisi tecniche e piani di trading per aiutar
FX Volume MT5
Daniel Stein
4.94 (17)
Ricevi il tuo aggiornamento quotidiano sul mercato con dettagli e schermate tramite il nostro Morning Briefing qui su mql5 e su Telegram ! FX Volume è il PRIMO e UNICO indicatore di volume che fornisce una visione REALE del sentiment del mercato dal punto di vista del broker. Fornisce informazioni straordinarie su come gli operatori di mercato istituzionali, come i broker, sono posizionati sul mercato Forex, molto più velocemente dei rapporti COT. Vedere queste informazioni direttamente sul vo
FX Power MT5 NG
Daniel Stein
5 (4)
Ricevi il tuo aggiornamento quotidiano sul mercato con dettagli e schermate tramite il nostro Morning Briefing qui su mql5 e su Telegram ! FX Power MT5 NG è la nuova generazione del nostro popolare misuratore di forza delle valute, FX Power. Cosa offre questo misuratore di forza di nuova generazione? Tutto ciò che avete amato dell'FX Power originale IN PIÙ Analisi della forza di ORO/XAU Risultati di calcolo ancora più precisi Periodi di analisi configurabili individualmente Limite di calcolo pe
Innanzitutto, vale la pena sottolineare che questo Strumento di Trading è un Indicatore Non-Ridipingente, Non-Ridisegnante e Non-Laggante, il che lo rende ideale per il trading professionale. L'Indicatore Smart Price Action Concepts è uno strumento molto potente sia per i nuovi che per i trader esperti. Racchiude più di 20 utili indicatori in uno solo, combinando idee di trading avanzate come l'Analisi del Trader del Circolo Interno e le Strategie di Trading dei Concetti del Denaro Intelligen
Advanced Supply Demand MT5
Bernhard Schweigert
4.53 (15)
La migliore soluzione per qualsiasi principiante o trader esperto! Questo indicatore è uno strumento di trading unico, di alta qualità e conveniente perché abbiamo incorporato una serie di funzionalità proprietarie e una nuova formula. Con questo aggiornamento, sarai in grado di mostrare fusi orari doppi. Non solo potrai mostrare una TF più alta, ma anche entrambe, la TF del grafico, PIÙ la TF più alta: SHOWING NESTED ZONES. Tutti i trader di domanda di offerta lo adoreranno. :) Informazioni imp
Volume by Price MT5
Brian Collard
5 (3)
The Volume by Price Indicator for MetaTrader 5 features Volume Profile and Market Profile TPO (Time Price Opportunity). Get valuable insights out of currencies, equities and commodities data. Gain an edge trading financial markets. Volume and TPO histogram bar and line charts. Volume Footprint charts. TPO letter and block marker charts including split structures. Versatile segmentation and compositing methods. Static, dynamic and flexible ranges with relative and/or absolute visualizations. Lay
XQ Indicator MetaTrader 5
Marzena Maria Szmit
5 (1)
Step into the realm of Forex trading with confidence and precision using XQ, a cutting-edge Forex indicator designed to elevate your trading game to unprecedented heights. Whether you're a seasoned trader or just stepping into the world of currency exchange, XQ Forex Indicator empowers you with the insights and signals needed to make informed trading decisions. The signal conditions are a combination of three indicators, and XQ Forex Indicator only display  medium and long-term trends . The ind
AW Trend Predictor MT5
AW Trading Software Limited
4.76 (54)
La combinazione di trend e livelli di rottura in un unico sistema. Un algoritmo di indicatore avanzato filtra il rumore del mercato, determina la tendenza, i punti di ingresso e i possibili livelli di uscita. I segnali indicatori sono registrati in un modulo statistico, che permette di selezionare gli strumenti più adatti, mostrando l'efficacia dello storico dei segnali. L'indicatore calcola i segni Take Profit e Stop Loss. Manuale e istruzioni ->   QUI   / versione MT4 ->   QUI Come fare tradi
Top indicator for MT5   providing accurate signals to enter a trade without repainting! It can be applied to any financial assets:   forex, cryptocurrencies, metals, stocks, indices .  Watch  the video  (6:22) with an example of processing only one signal that paid off the indicator! MT4 version is here It will provide pretty accurate trading signals and tell you when it's best to open a trade and close it. Most traders improve their trading results during the first trading week with the help of
Presentazione       Quantum Breakout PRO   , l'innovativo indicatore MQL5 che sta trasformando il modo in cui scambi le zone di breakout! Sviluppato da un team di trader esperti con un'esperienza di trading di oltre 13 anni,       Quantum Breakout PRO       è progettato per spingere il tuo viaggio di trading a nuovi livelli con la sua strategia innovativa e dinamica della zona di breakout. Quantum Breakout Indicator ti fornirà frecce di segnalazione sulle zone di breakout con 5 zone target
ICT, SMC, SMART MONEY CONCEPTS, SMART MONEY, Smart Money Concept, Support and Resistance, Trend Analysis, Price Action, Market Structure, Order Blocks, BOS/CHoCH,   Breaker Blocks ,  Momentum Shift,   Supply&Demand Zone/Order Blocks , Strong Imbalance,   HH/LL/HL/LH,    Fair Value Gap, FVG,  Premium  &   Discount   Zones, Fibonacci Retracement, OTE, Buy Side Liquidity, Sell Side Liquidity, BSL/SSL Taken, Equal Highs & Lows, MTF Dashboard, Multiple Time Frame, BigBar, HTF OB, HTF Market Structure
Auto Order Block with break of structure based on ICT and Smart Money Concepts Futures Break of Structure ( BoS )             Order block ( OB )            Higher time frame Order block / Point of Interest ( POI )    shown on current chart           Fair value Gap ( FVG ) / Imbalance   ,  MTF      ( Multi Time Frame )    Volume Imbalance     ,  MTF          vIMB Gap’s Equal High / Low’s     ,  MTF             EQH / EQL Liquidity               Current Day High / Low           HOD /
Il profitto dalla struttura del mercato cambia quando il prezzo si inverte e si ritira. L'indicatore di avviso di inversione della struttura del mercato identifica quando una tendenza o un movimento di prezzo si sta avvicinando all'esaurimento e pronto a invertire. Ti avvisa dei cambiamenti nella struttura del mercato che in genere si verificano quando stanno per verificarsi un'inversione o un forte pullback. L'indicatore identifica inizialmente i breakout e lo slancio del prezzo, ogni volta
TPSproTREND PrO MT5
Roman Podpora
5 (5)
TPSpro TRENDPRO  - is a trend indicator that automatically analyzes the market and provides information about the trend and each of its changes, as well as giving signals for entering trades without redrawing! The indicator uses each candle, analyzing them separately. referring to different impulses - up or down impulse. Exact entry points into transactions for currencies, crypto, metals, stocks, indices!  -  Version MT4                  DETAILED DESCRIPTION        /       TRADING SETUPS       
TrendMaestro5
Stefano Frisetti
nota: questo indicatore e' per METATRADER5, se vuoi la versione per  METATRADER4 questo e' il link:   https://www.mql5.com/it/market/product/108106 TRENDMAESTRO   riconosce un nuovo TREND sul nascere, non sbaglia mai. La sicurezza di identificare un nuovo TREND non ha prezzo. DESCRIZIONE TRENDMAESTRO identifica un nuovo TREND sul nascere, questo indicatore prende in esame la volatilita' i volumi ed il momentum per identificare il momento in cui c'e' un'esplosione di uno  opiu' di questi d
Quantum Heiken Ashi PRO MT5
Bogdan Ion Puscasu
4.5 (8)
Ti presentiamo   Quantum Heiken Ashi PRO Progettate per fornire informazioni chiare sulle tendenze del mercato, le candele Heiken Ashi sono rinomate per la loro capacità di filtrare il rumore ed eliminare i falsi segnali. Dì addio alle confuse fluttuazioni dei prezzi e dai il benvenuto a una rappresentazione grafica più fluida e affidabile. Ciò che rende il Quantum Heiken Ashi PRO davvero unico è la sua formula innovativa, che trasforma i dati tradizionali delle candele in barre colorate di faci
IX Power MT5
Daniel Stein
5 (2)
IX Power   porta finalmente l'imbattibile precisione di FX Power ai simboli non-Forex. Determina con precisione l'intensità delle tendenze a breve, medio e lungo termine dei vostri indici preferiti, azioni, materie prime, ETF e persino criptovalute. Potete   analizzare tutto ciò che   il vostro terminale ha da offrire. Provatelo e sperimentate come   il vostro tempismo migliori significativamente   durante il trading. Caratteristiche principali di IX Power Risultati di calcolo precisi al
TrendDecoder Premium MT5
Christophe, Pa Trouillas
5 (1)
Identificare i range e le prossime mosse probabili     |    Ottenere i primi segnali e la forza delle tendenze     |    Ottenere uscite chiare prima dell'inversione     |    Individuare i livelli di Fibo che il prezzo testerà   |  Indicatore non tracciante e non ritardato - ideale per il trading manuale e automatizzato - adatto a tutti gli asset e a tutte le unità temporali 50% di sconto   - per il lancio poi torna a   >>   149 $ Dopo l'acquisto,   contattatemi su questo canale  per le impostazi
Gartley Hunter Multi
Siarhei Vashchylka
5 (5)
Gartley Hunter Multi - An indicator for searching for harmonic patterns simultaneously on dozens of trading instruments and on all classic timeframes: (m1, m5, m15, m30, H1, H4, D1, Wk, Mn). Manual (Be sure to read before purchasing) | Version for MT4 Advantages 1. Patterns: Gartley, Butterfly, Shark, Crab. Bat, Alternate Bat, Deep Crab, Cypher 2. Simultaneous search for patterns on dozens of trading instruments and on all classic timeframes 3. Search for patterns of all possible sizes. Fr
TrendLine PRO MT5
Evgenii Aksenov
4.78 (49)
The Trend Line PRO indicator is an independent trading strategy. It shows the trend change, the entry point to the transaction, as well as automatically calculates three levels of Take Profit and Stop Loss protection Trend Line PRO is perfect for all Meta Trader symbols: currencies, metals, cryptocurrencies, stocks and indices Advantages of Trend Line PRO Never redraws its signals The possibility of using it as an independent strategy It has three automatic levels Take Profit and Stop Loss lev
Golden Spikes Detector
Batsirayi L Marango
5 (1)
Golden Spikes Detector This indicator is based on an advanced strategy primarily for trading spikes on Boom and Crash Indices. Complex algorithms were implemented to detect high probability entries only. It alerts on potential Buy and Sell entries. To trade spikes on the Deriv or Binary broker, only take Buy Boom and Sell Cash alerts. It was optimised to be loaded on 5-minute timeframe although multiple timeframe analysis is done in the background. Features ·             Desktop pop up and sound
Matrix Arrow Indicator MT5
Juvenille Emperor Limited
5 (14)
Matrix Arrow Indicator MT5   è un trend unico 10 in 1 che segue un indicatore multi-timeframe al   100% non ridipinto   che può essere utilizzato su tutti i simboli/strumenti:   forex ,   materie prime ,   criptovalute ,   indici ,   azioni .  Matrix Arrow Indicator MT5  determinerà la tendenza attuale nelle sue fasi iniziali, raccogliendo informazioni e dati da un massimo di 10 indicatori standard, che sono: Indice di movimento direzionale medio (ADX) Indice del canale delle materie prime (CCI
Blahtech Supply Demand MT5
Blahtech Limited
4.57 (14)
Was: $299  Now: $99   Supply Demand uses previous price action to identify potential imbalances between buyers and sellers. The key is to identify the better odds zones, not just the untouched ones. Blahtech Supply Demand indicator delivers functionality previously unavailable on any trading platform. This 4-in-1 indicator not only highlights the higher probability zones using a multi-criteria strength engine, but also combines it with multi-timeframe trend analysis, previously confirmed swings
Dark Power MT5
Marco Solito
4.84 (56)
Dark Power  is an Indicator for intraday trading. This Indicator is based on   Trend Following  strategy, also adopting the use of an histogram to determine the right power . We can enter in good price with this Indicator, in order to follow the   strong trend   on the current instrument. The histogram is calculated based on the size of the bars and two moving averages calculated on the histogram determine the direction of the signal Key benefits Easily visible take profit/stop loss lines Int
** All Symbols x All Timeframes scan just by pressing scanner button ** ***Contact me after purchase to send you instructions and add you in "123 scanner group" for sharing or seeing experiences with other users. After 15 years of experience in the markets and 3 years of programming, Winner indicator is ready. I would like to share with you! Introduction The 123 Pattern Scanner indicator with a special enhanced algorithm is a very repetitive common pattern finder with a high success rate . Inte
The Smart Liquidity Profile is color-coded based on the importance of the traded activity at specific price levels, allowing traders to identify significant price levels such as support and resistance levels, supply and demand zones, liquidity gaps, consolidation zones, Buy-Side/Sell-Side Liquidity and so on.  Smart Liquidity Profile allows users to choose from a number of different time periods including 'Auto,' 'Fixed Range,' 'Swing High,' 'Swing Low,' 'Session,' 'Day,' 'Week,' 'Month,' 'Quart
Altri dall’autore
TheStrat Levels MT5
Robert Gerald Wood
5 (1)
This indicator draws the prior Highs and Lows for multiple timeframes, and can display potential Take Profit and Stop Loss levels. In Rob Smith's # The Strat  terms, these are potential entry points, or alternatively potential targets for open positions. I like to use them in both ways. On a lower timeframe, say 5 minutes to get a good entry on a daily or weekly level, and then as a potential target. Very small stops required giving an excellent risk/reward ratio. Key Features  - Levels from Ho
TheStrat TFC Monitor MT5
Robert Gerald Wood
5 (1)
Quando fai trading usando   The Strat   , è importante tenere d'occhio più tempi. Questo indicatore mostrerà lo stato giornaliero, settimanale, mensile e trimestrale della candela corrente per ogni periodo di tempo. Un'icona a forma di cerchio mostra che la candela in quel lasso di tempo è attualmente una Inside o Type 1 nella terminologia di TheStrat. Una candela Inside Day sta consolidando l'azione dei prezzi e stiamo cercando un breakout dall'intervallo. Un'icona a triangolo, rivolta verso l'
TheStrat Monitor
Robert Gerald Wood
3 (2)
If you've not already learnt about The Strat trading strategy , go google it now. I promise it won't be a waste of your time, and you will likely learn some new tricks whether you use it or not. OK, so now you know what TheStrat is, you will be able to understand what this indicator can do for you. Key Features In short, the Indicator will: Show Timeframe Continuity for all supported timeframes Supports two timeset views, Day trader and Swing trader Show when Full Timeframe Continuity is in pl
Multi Chart Crosshairs
Robert Gerald Wood
5 (2)
This indicator is designed to make reviews of many charts on different timescales quicker, and easier to do. Track Time and Price across multiple charts Change Symbol on one chart and all other charts of the same symbol will be changed too. Easy to use, quick to master The indicator allows you to identify the price and time where the mouse pointer is on the current chart, across all other charts open on the same Symbol. This allows you to quickly see information on multiple charts whereas normal
TheStrat Levels
Robert Gerald Wood
This indicator draws the prior Highs and Lows for multiple timeframes, and can display potential Take Profit and Stop Loss levels. In Rob Smith's # The Strat   terms,   these are potential entry points, or alternatively potential targets for open positions. I like to use them in both ways. On a lower timeframe, say 5 minutes to get a good entry on a daily or weekly level, and then as a potential target. Very small stops required giving an excellent risk/reward ratio. Please watch the DEMO video
TheStrat Candles
Robert Gerald Wood
4.5 (2)
Questo indicatore disegnerà un'etichetta sopra o sotto ogni candela in base a       di Rob Smith       La Stratocaster       man mano che si sviluppano nel tempo sul tuo grafico. Con l'evolversi del prezzo, una candela può passare da uno stato all'altro. Quando la candela si apre per la prima volta, se si trova completamente all'interno del massimo e del minimo delle candele precedenti, inizierà come Tipo 1. Con il passare del tempo, se rompe il massimo o il minimo della candela precedente, v
TheStrat Patterns
Robert Gerald Wood
This indicator will draw patterns based on Rob Smith's The Strat as they emerge in real time on your chart. As price evolves, TheStrat offers 18 distinct price action patterns that can help you get good entries in the market. Each pattern involves two or three candles, and this indicator will draw a bounding box around the candles and name the pattern. The indicator also shows when a potential setup is forming, known by stratters as an Actionable signal. Candles Each candle is defined by i
Chart Drawing Cloner
Robert Gerald Wood
5 (4)
Questo script ti consente di copiare oggetti di disegno di qualsiasi tipo, come linee di tendenza, ritracciamenti di Fibonachi ecc., su uno o più altri grafici. Per impostazione predefinita, lo script copierà tutti gli oggetti del grafico corrente, ovvero il grafico a cui è stato applicato lo script, in qualsiasi altro grafico dello stesso simbolo attualmente caricato. Impostazioni DestinazioneTimeframe Se impostato su un valore diverso da PERIOD_CURRENT, copierà gli oggetti in qualsiasi g
FREE
This indicator will draw a label above or below each candle based on   Rob Smith's   The Strat   as they develop over time on your chart. As price evolves, a candle can switch between three states. When the candle first opens, if it sits completely within the previous candles high and low, then it will start as a Type 1. As time moves on, if it breaks either the high or low of the previous candle, it will be come a type 2, and should the price action be volatile and directionless, it may then
Ho creato questo semplice indicatore mentre stavo imparando a conoscere TheStrat di Rob Smith e l'ho trovato così utile, ho pensato di condividerlo con te. Se lo trovi utile, guarda gli altri indicatori che ho pubblicato su MQL5. L'indicatore disegna semplicemente una singola linea sul grafico che mostra il livello di prezzo selezionato da un periodo di tempo più elevato. Usando le impostazioni hai il pieno controllo sull'intervallo di tempo visualizzato ma, per   impostazione predefinita, calco
FREE
A simple script that can delete all the drawing objects on a chart, or just the objects of a specific type. Settings: DeleteObjectsOfType By default the value will be blank which means ALL drawing objects on the chart will be deleted. If you only wish to delete specific types of drawing object, change this setting to the type of object to delete. For example, Fibonacci Retracement, Text, Label or Trend Line. Please see the demonstration video for more information.
FREE
This script allows you to toggle the "Show Trade Levels" option, but for the current chart only. Normally, you can only change the setting using the Options -> Chart menu for ALL charts, but this script allows you to do it for a SINGLE chart. I'm using it when I take screenshots, because most of the time I'm not trying to show the trades, just some functionality of one of my other tools. Iif you need that functionality, then this script is very helpful! If the script helps you, please let me
FREE
TheStrat FTFC
Robert Gerald Wood
FTFC si riferisce alla Full Timeframe Continuity come definita da   The Strat   di Rob Smith. Questo indicatore disegna due linee sul grafico, una delle più alte tra i livelli di apertura trimestrale, mensile, settimanale, giornaliera o oraria e la seconda tra i più bassi di questi valori. Questo ti dà un canale sopra o sotto il quale è più probabile che il trading sia molto fortemente in una direzione. Tra le righe, l'azione dei prezzi sarà più instabile e potresti utilizzare stop più ampi. Vie
Round Price Levels
Robert Gerald Wood
I mercati amano davvero i numeri tondi e spesso fungono da supporto in un mercato in calo o da resistenza quando il prezzo sale. Questo indicatore è progettato per disegnare livelli di prezzo a valori Round. Lo fa automaticamente, ma hai anche la possibilità di ignorarlo e determinare i livelli che desideri vedere. Un livello rotondo può essere semplice come passaggi di 10, quindi 10, 20, 30 ecc. o se stai lavorando con il Forex, forse vuoi vedere i cambiamenti a 0.1 o 0.01. L'indicatore disegna
Quando fai trading usando   The Strat   , è importante tenere d'occhio più tempi. Questo indicatore mostrerà lo stato giornaliero, settimanale, mensile e trimestrale della candela corrente per ogni periodo di tempo. Un'icona a forma di cerchio mostra che la candela in quel lasso di tempo è attualmente una Inside o Type 1 nella terminologia di TheStrat. Una candela Inside Day sta consolidando l'azione dei prezzi e stiamo cercando un breakout dall'intervallo. Un'icona a triangolo, rivolta verso l'
Active Pivot Levels
Robert Gerald Wood
5 (1)
I livelli pivot sono un livello tecnico consolidato riconosciuto in ogni mercato. Questo indicatore disegnerà gli attuali pivot trimestrali, mensili, settimanali, giornalieri e quadriorari sul grafico, per qualsiasi simbolo. Puoi anche mostrare i livelli di Supporto e Resistenza per ogni periodo e scegliere quale visualizzare dal livello 1 al 4.     Scegli il tipo di Pivot tra: Standard Camarilla DeMark Woodie Fibonacci Si prega di notare che i pivot DeMark hanno un unico livello di supporto e r
ATR Extremes
Robert Gerald Wood
L'Average True Range (ATR) è un indicatore comunemente usato che misura la quantità di movimento del prezzo per una durata prestabilita. Tuttavia, il valore che dà non è definito all'interno di alcun tipo di confine, il che rende quasi impossibile utilizzarlo per qualcosa di diverso dai calcoli di stop loss o take profit. Questo indicatore è il tuo indicatore ATR standard, ma abbiamo introdotto le demarcazioni percentili in modo che tu possa vedere gli estremi. Puoi scegliere tra percentili
Range Exhaustion
Robert Gerald Wood
L'esaurimento dell'intervallo si verifica quando il prezzo raggiunge o supera l'intervallo previsto per il periodo corrente. A questi livelli, il prezzo inizia a perdere slancio rispetto all'inizio del periodo, quindi è un buon punto per assicurarsi di non assumere nuove posizioni. Questo indicatore ti mostrerà dove è probabile che ciò accada sul tuo grafico, mostrando i livelli per periodi giornalieri, settimanali e mensili. Quando vedi che il prezzo supera questi livelli di esaurimento, ti sta
TheStrat FTFC MT5
Robert Gerald Wood
FTFC si riferisce alla Full Timeframe Continuity come definita da   The Strat   di Rob Smith. Questo indicatore disegna due linee sul grafico, una delle più alte tra i livelli di apertura trimestrale, mensile, settimanale, giornaliera o oraria e la seconda tra i più bassi di questi valori. Questo ti dà un canale sopra o sotto il quale è più probabile che il trading sia molto fortemente in una direzione. Tra le righe, l'azione dei prezzi sarà più instabile e potresti utilizzare stop più ampi. Vie
This indicator will draw patterns based on   Rob Smith's   The Strat   as they emerge in real time on your chart. As price evolves,   TheStrat   offers 18 distinct price action patterns that can help you get good entries in the market. Each pattern involves two or three candles, and this indicator will draw a bounding box around the candles and name the pattern. The indicator also shows when a potential setup is forming, known by stratters as an Actionable signal. Candles Each candle is de
TheStrat Monitor MT5
Robert Gerald Wood
5 (1)
Se non hai già imparato a conoscere   la strategia di trading di The Strat   , vai su Google ora. Ti prometto che non sarà una perdita di tempo e probabilmente imparerai alcuni nuovi trucchi, che tu lo usi o meno. OK, quindi ora sai cos'è TheStrat, sarai in grado di capire cosa può fare questo indicatore per te. Caratteristiche principali In breve, l'indicatore: Mostra la continuità del periodo di tempo per tutti i periodi di tempo supportati Supporta due viste timeset, Day trader e Swing trad
I livelli pivot sono un livello tecnico consolidato riconosciuto in ogni mercato. Questo indicatore disegnerà gli attuali pivot trimestrali, mensili, settimanali, giornalieri e quadriorari sul grafico, per qualsiasi simbolo. Puoi anche mostrare i livelli di Supporto e Resistenza per ogni periodo e scegliere quale visualizzare dal livello 1 al 4.     Scegli il tipo di Pivot tra: Standard Camarilla DeMark Woodie Fibonacci Si prega di notare che i pivot DeMark hanno un unico livello di supporto e r
I mercati amano davvero i numeri tondi e spesso fungono da supporto in un mercato in calo o da resistenza quando il prezzo sale. Questo indicatore è progettato per disegnare livelli di prezzo a valori Round. Lo fa automaticamente, ma hai anche la possibilità di ignorarlo e determinare i livelli che desideri vedere. Un livello rotondo può essere semplice come passaggi di 10, quindi 10, 20, 30 ecc. o se stai lavorando con il Forex, forse vuoi vedere i cambiamenti a 0.1 o 0.01. L'indicatore disegna
ATR Extremes MT5
Robert Gerald Wood
L'Average True Range (ATR) è un indicatore comunemente usato che misura la quantità di movimento del prezzo in una determinata durata. Tuttavia, il valore che fornisce non è definito all'interno di alcun tipo di confine, il che rende quasi impossibile utilizzarlo per qualcosa di diverso dai calcoli di stop loss o take profit. Questo indicatore è il tuo indicatore ATR standard, ma abbiamo introdotto demarcazioni percentili in modo da poter vedere gli estremi. Puoi scegliere tra percentili e qualc
L'esaurimento dell'intervallo si verifica quando il prezzo raggiunge o supera l'intervallo previsto per il periodo corrente. A questi livelli, il prezzo inizia a perdere slancio rispetto all'inizio del periodo, quindi è un buon punto per assicurarsi di non assumere nuove posizioni. Questo indicatore ti mostrerà dove è probabile che ciò accada sul tuo grafico, mostrando i livelli per periodi giornalieri, settimanali e mensili. Quando vedi che il prezzo supera questi livelli di esaurimento, ti sta
Filtro:
mm0079
127
mm0079 2024.01.15 18:46 
 

Works as promised. I only could not change the colour input for crosshair (on mac) but thats all.

Forexezek
48
Forexezek 2023.11.14 10:51 
 

Hello! I bought the indicator. Very good! However, when I'm not using it, it would be nice if MT5's built-in crosshairs would work again to press the middle mouse button. It's deleting this feature for some reason. Could you modify it like this? Please

Sorry, but I didn't see that you already corrected it and wrote an answer. Thank you very much!

Could there possibly be a setting to set the crosshairs in the background/foreground? 100% perfect indicator after the repair! You are a perfect seller!

Robert Gerald Wood
4246
Risposta dello sviluppatore Robert Gerald Wood 2023.11.16 14:55
Hello, many thanks for the review, and thank you for spotting the bug. I have just published a fix and you should be able to download the new version now.
The ability to configure the crosshairs as in the background is also available now.
Igazi
151
Igazi 2023.05.26 19:05 
 

WOW! What an amazing indicator! Worth the purchase!

nabil84
129
nabil84 2023.03.08 09:54 
 

The Best Tool to track time across multiple charts and Instruments ( As per now its the only one available on the Market for MT5 to get the job done) .Highly Recommended for Traders who want to track specific timing on different instrument.

hvralpha
61
hvralpha 2022.07.03 16:42 
 

This is a fantastic indicator and it works well as advertised. Sinc your crosshairs and quickly change chart symbols. I bought it and could not be happier. Makes my extensive analysis and changing symbols very easy.

Robert Gerald Wood
4246
Risposta dello sviluppatore Robert Gerald Wood 2022.07.04 11:35
So glad you're happy, thank you for the review :)
Mike Louw
197
Mike Louw 2022.06.30 16:04 
 

Just purchased it and works very well. Does what I want it to do.

Robert Gerald Wood
4246
Risposta dello sviluppatore Robert Gerald Wood 2022.06.30 16:55
Thanks for the review, glad you are happy with it 😊
Get Fit
54
Get Fit 2021.07.22 00:14 
 

I love this indicator. Great for how I trade using multiple time frame analysis. Great indicator. Thank you so much!!!!!

Robert Gerald Wood
4246
Risposta dello sviluppatore Robert Gerald Wood 2022.04.01 11:59
Thank you!
Rispondi alla recensione
Versione 2.0 2023.11.16
Added a configuration parameter so you can choose to have the crosshair lines drawn in the background.
By default, it is set to false so the crosshairs are drawn in the foreground as they were in the previous versions.
Be aware, if your chart has the candles displayed as always on top, then the crosshairs will always be drawn behind the candles.
Versione 1.90 2023.11.14
Fixed issue with the built-in crosshairs not working after using this indicator. Now, once you press the ESC key the built-in crosshairs works again.
Versione 1.80 2023.03.07
Performance improvements for instances where many charts are loaded.
Versione 1.70 2023.03.05
Added ability to track Time across all charts, not just the current charts symbol. This is controlled by the new setting TrackTimeOnly which defaults to false so existing users are unaffected unless they turn the option on.