Market Reversal Alerts Dashboard MT5
- Indicatori
- LEE SAMSON
- Versione: 2.10
- Aggiornato: 5 agosto 2021
- Attivazioni: 10
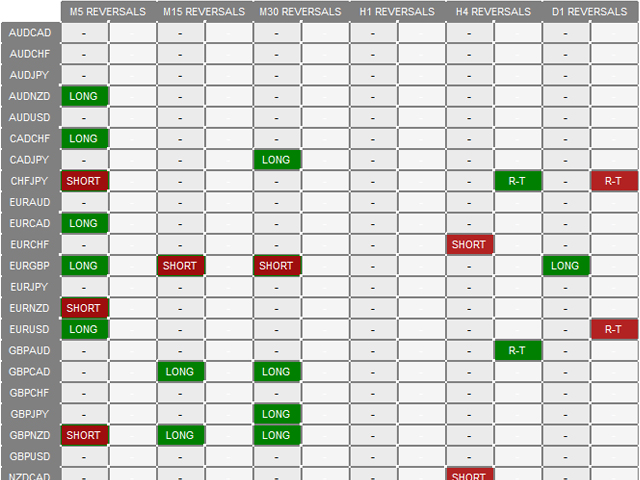
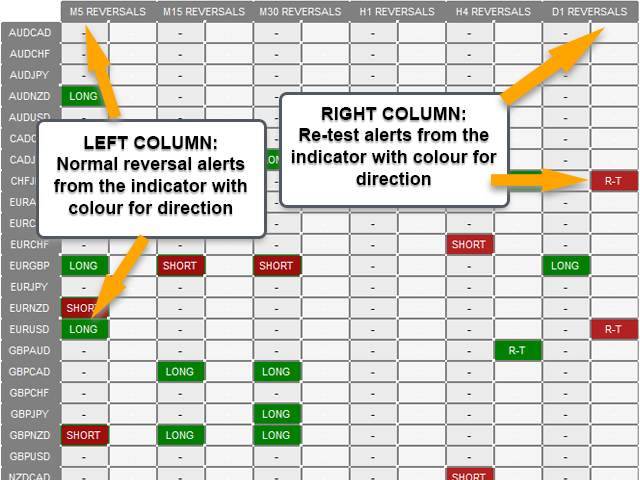
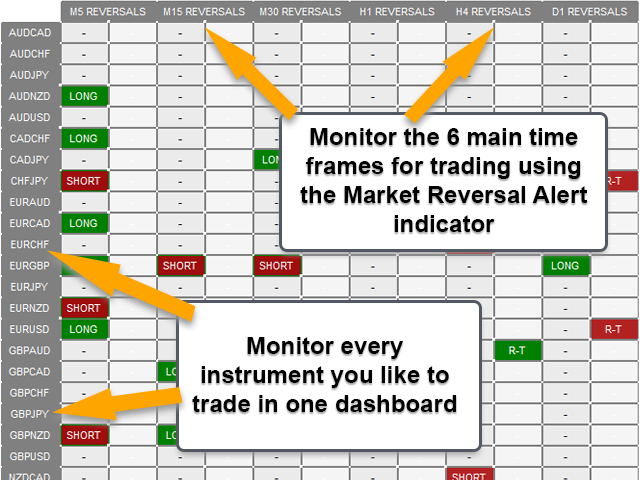
Questa dashboard è uno strumento di avviso da utilizzare con l'indicatore di inversione della struttura del mercato. Il suo scopo principale è avvisarti di opportunità di inversione su intervalli di tempo specifici e anche di ripetere i test degli avvisi (conferma) come fa l'indicatore. Il dashboard è progettato per essere posizionato su un grafico da solo e funzionare in background per inviarti avvisi sulle coppie e sui tempi scelti. È stato sviluppato dopo che molte persone hanno richiesto un trattino per monitorare più coppie e intervalli di tempo contemporaneamente piuttosto che avere l'indicatore di inversione del mercato in esecuzione su più grafici in un MT4. Avvisa sugli intervalli di tempo M5, M15, M30, H1, H4 e D1. Tempi più alti funzionano naturalmente meglio come con qualsiasi cosa nel trading.
L'indicatore che ho creato per disegnare i rettangoli e avvisare sui cambiamenti della struttura del mercato su una coppia specifica esegue il dashboard.
La dashboard ti consente semplicemente di monitorare più coppie e intervalli di tempo e ricevere avvisi con un grafico aperto.
QUESTO DASHBOARD È PROGETTATO COME AGGIUNTA PER L'INDICATORE DI INVERSIONE DELLA STRUTTURA DEL MERCATO. FUNZIONA IN INDIPENDENZA E AVVISO A MODELLI E SEGNALI FORNITI DALL'INDICATORE DI AVVISO DI INVERSIONE DEL MERCATO.
Ottieni la versione MT5 dell'indicatore di avvisi di inversione di mercato qui: https://www.mql5.com/en/market/product/46295
La versione MT4 di questa dashboard è qui: https://www.mql5.com/en/market/product/62751/
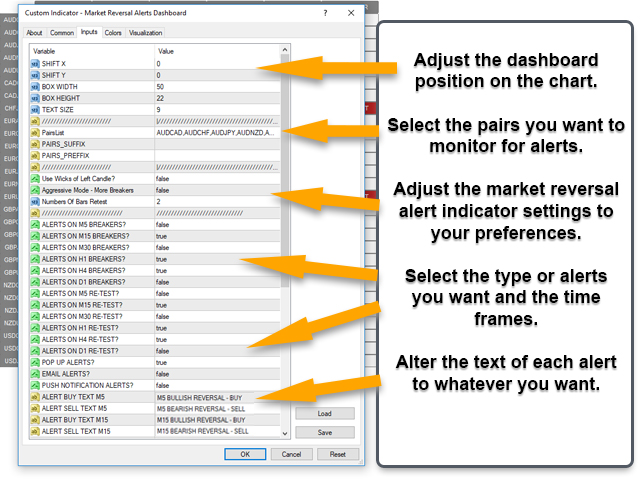
Ingressi/impostazioni indicatore:
Regola le dimensioni e la posizione del cruscotto.
Seleziona le coppie da mostrare e il suffisso o prefisso del tuo broker, se necessario.
Regolazioni per la messa a punto dell'indicatore di inversione di mercato, inclusi stoppini a sinistra, modalità aggressiva e impostazioni della distanza di nuovo test.
Seleziona per quali intervalli di tempo desideri ricevere gli avvisi.
Seleziona per quali intervalli di tempo desideri ricevere gli avvisi di nuovo test.
Preferenza di avviso, scegli tra pop-up, e-mail o notifiche push.
Regola il testo per ogni avviso come richiesto.
Informazioni sull'indicatore di avviso di inversione di mercato:
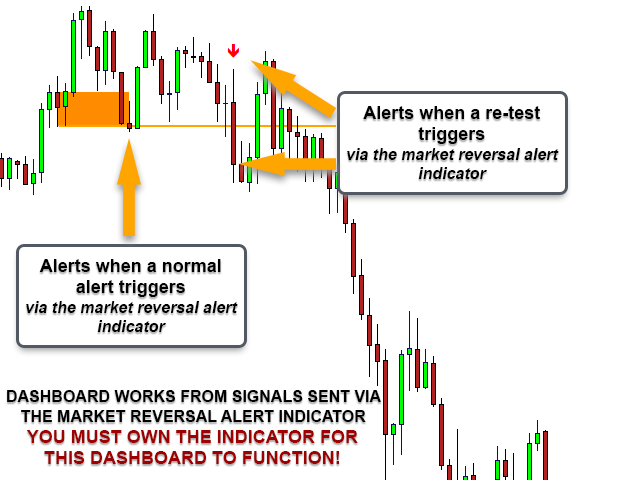
La struttura del mercato è ampiamente utilizzata da molti trader per una serie di strategie diverse. C'è una grande quantità di informazioni sul web sulla struttura del mercato, ma fondamentalmente l'indicatore è progettato per darti avvisi tempestivi quando stanno potenzialmente avvenendo dei cambiamenti. L'indicatore disegna rettangoli sulle candele di colore opposto a una tendenza o movimento. Queste candele tendono a supportare un movimento continuo in una direzione fino a quando il prezzo non chiude sopra/sotto di esso nella direzione opposta.
Quindi la premessa di base dell'indicatore è che quando si riceve un avviso dopo un movimento al ribasso è possibile che si sia formato un minimo e stia per verificarsi un cambiamento nella struttura del mercato (inversione/ritorno - a breve oa lungo termine). Ovviamente non tutti gli avvisi funzioneranno e se il prezzo continua nella stessa direzione (in questo caso verso il basso) e si chiude al di sotto del minimo più recente, l'indicatore rimuove l'avviso dal grafico e continua a disegnare una nuova struttura.


Awesome Dashboard, works perfect in combination with the Market Reversal Indicator. Very good quality and functionality as you are used to from Lee 👍