Heiken Ashi Smoothed Alert MT5
- Indicatori
- Jan Flodin
- Versione: 1.0
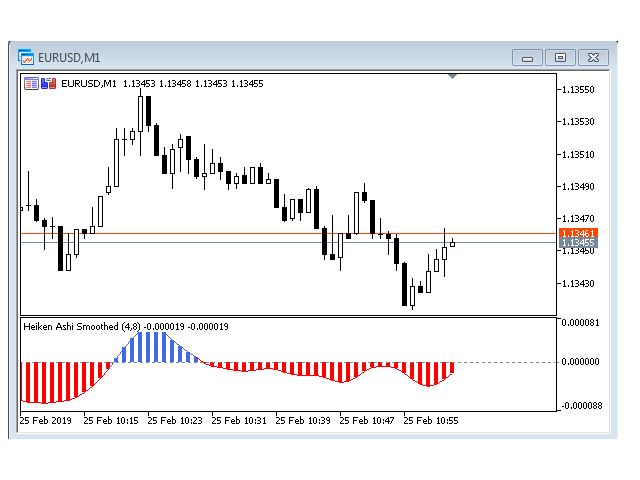
Questo indicatore può inviare avvisi quando si verifica un cambiamento di colore Heiken Ashi Smoothed. Combinato con le tue regole e tecniche, questo indicatore ti permetterà di creare (o migliorare) il tuo potente sistema.
Caratteristiche
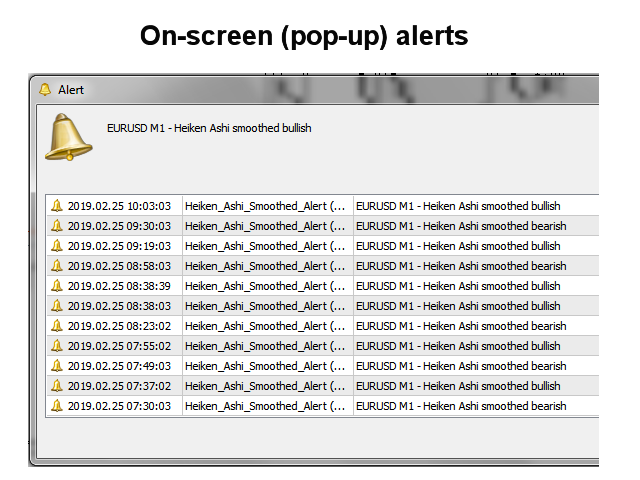
- Può inviare tutti i tipi di avvisi.
- Possibilità di ritardare l'avviso di una o più barre per confermare il cambio colore (tendenza).
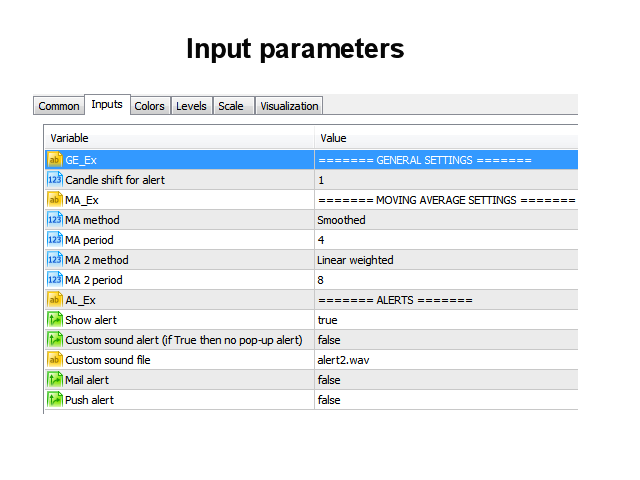
Parametri di input
- Spostamento candela per avviso: l'impostazione predefinita è 1. Impostandolo su 0 ti avviserà del cambiamento di colore sulla candela corrente. Questo dovrebbe essere considerato come un segnale in sospeso (non confermato).
- Metodo MA: l'impostazione predefinita è Smoothed (SMMA).
- Periodo MA: il valore predefinito è 4.
- Metodo MA 2: l'impostazione predefinita è Linear Weighted (LWMA).
- Periodo MA 2: il valore predefinito è 8.
- Avvisi: imposta su "vero" per ogni tipo di avviso che desideri ricevere.


Hi, can you add doji spotter with alert to this indicator?