• Panoramica
  • Recensioni (3)
  • Commenti
  • Novità

MultiTimeFrameZZ

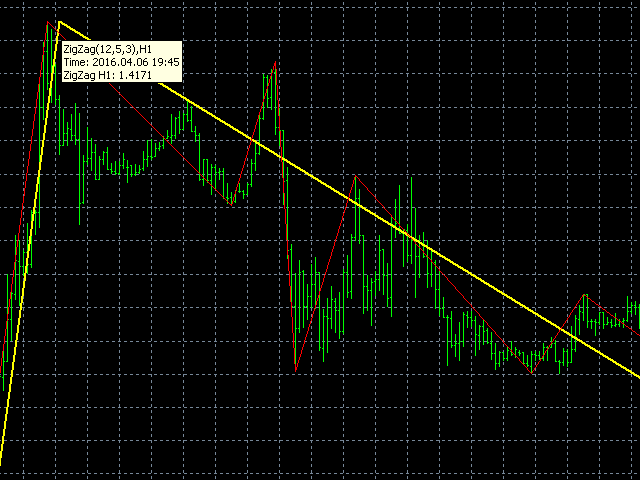
The indicator displays ZigZag lines from a higher timeframe (see the example in the screenshot). The red thin line is the current timeframe's ZigZag, while a thicker yellow line is the higher timeframe's one. The indicator is repainted as the data is updated.


Parameters

  • Depth, Dev, Back - ZigZag parameters;
  • BarsCount - amount of processed bars (reduces the initial download time and decreases the load when using in an EA);
  • TimeFrame - indicator timeframe (cannot be lower than the current one).
Prodotti consigliati
The Level Moving Averages Message indicator ( see the description and video ) does not draw the Moving Average line in the chart window but marks the Moving Average level on all time frames in accordance with the specified parameters. The level move frequency corresponds to the TimeFrame parameter value specified. The advantage of this indicator lies in the fact that it offers the possibility of monitoring the interaction between the price and the MA of a higher time frame on a lower one (e.g.,
TrendPlus
Sivakumar Subbaiya
4.38 (13)
Trend Plus   Trendplus  Indicator   Time Frame: Suitable for any time frame.  Purpose: Trend Prediction. Blue and red candle indicate the buy and sell call respectively. Buy: When the blue candle is formed buy call is initiated. close the buy trades when the next red candle will formed.   Sell: When the Red candle is formed Sell call is initiated. close the Sell trades when the next blue candle will formed.   Happy trade!!
FREE
The indicator detects and displays М. Gartley's Butterfly pattern. The pattern is plotted by the extreme values of the ZigZag indicator (included in the resources, no need to install). After detecting the pattern, the indicator notifies of that by the pop-up window, a mobile notification and an email. The pattern and wave parameters are displayed on the screenshots. The default parameters are used for demonstration purposes only in order to increase the amount of detected patterns. Parameters
User friendly indicator.  This indicator will help you catch the trend an fast as possible. Indicator developed based on moving averages. User can select which type of moving averages they want to use. Indicator draws an arrow when the moving average crosses. The moving average cross over arrow can be filtered with RSI, OsMA, and Parabolic Sar. There are options for selecting specific criteria for the filters.  Such as period of Rsi and Rsi levels. OsMA and Parabolic Sar criteria can also be sel
Nice Trade Point
Muhammed Emin Ugur
This    Nice Trade Point     indicator is designed for signal trading. This indicator generates trend signals. It uses many algorithms and indicators to generate this signal. It tries to generate a signal from the points with the highest trend potential. This indicator is a complete trading product. This indicator does not need any additional indicators. The indicator certainly does not repaint. The point at which the signal is given does not change.     Features and Suggestions Time
SFT Full MACD
Artem Kuzmin
5 (1)
A classic indicator with advanced features for more accurate display of the market situation. All settings of all moving averages are available, such as the moving average type and the priced used in its calculation. It is also possible to change the appearance of the indicator - line or histogram. Additional parameters provide the ability of fine tuning. Distinctive features Does not redraw. Additional parameters for fine tuning. Displayed as a line or as a histogram. Works on all timeframes
FREE
RSX Signal 2 AM
Andriy Matviyevs'kyy
The indicator displays the signals of the RSX oscillator on the price chart. (To display these signals in a separate window, along with the oscillator, another indicator is used -  RSX Osc 4 AM ). It is optimal to use the indicator signals as signals to open a trade when the price overcomes the maximum or minimum of the bar at which the signal was given. An opposite signal cancels the previous signal. Settings: Data period for indicator calculation - data period for indicator calculation; Data
FREE
TSO Moving Average Slope
Dionisis Nikolopoulos
3.67 (3)
The Moving Average Slope (MAS) subtracts the moving average level n-periods ago from the current moving average level. This way, the trend of the moving average can be drawn on the moving average line. Features Observe uptrends and downtrends at a glance. The indicator is non-repainting. Returns buffer values for the trend of the moving average to be used as part of an EA. (see below) Inputs Moving Average Period : The period of the moving average (MA). Slope Period : Number of periods betwe
FREE
HMA Trend
Pavel Zamoshnikov
4.6 (80)
A trend indicator based on the Hull Moving Average (HMA) with two periods. The Hull Moving Average is an improved variant of the moving average, which shows the moment of trend reversal quite accurately. It is often used as a signal filter. Combination of two types of Hull Moving Averages makes a better use of these advantages: HMA with a slow period identifies the trend, while HMA with a fast period determines the short-term movements and signals in the trend direction. Features The movement
FREE
TIbors Timer
Tibor Hartmut Sturm
Indikator zur klaren Anzeige im Metatrader Dieser Indikator wurde von mir Entwickelt damit die Anzeige der relevanten Parameter klar und deutlich im Chart auf einen Blick zu sehen ist.  Er dient zur Information und ist ohne Gewähr.  Folgende Parameter werden angezeigt: -   Der  Aktuelle Kurs - Das Aktuelle Handelspaar - Die Restzeit zur nächsten Kerzenbildung / Zum Abschluss der Aktuellen Kerze - Die Kontonummer des Handelskontos - Die Frei Verfügbare Margin - Die Margin auf 1 Lot - Der Akt
FREE
FREE FOR A LIMITED TIME ONLY!!! The Ultimate Indicator For Trading Trend This indicator clearly shows you the strength of the market in one direction or the other, which means that you can trade knowing you are either with or against the market. When used in conjunction with the +3R principles you are sure to have some serious results. The +3R Principles Routine - This is when you trade and how often  Rules - This is the rule you follow  Risk:Reward - This is the percentage amount of your accoun
FREE
Least Square MA
Illia Zhavarankau
Least Square MA   Description: The Least Square Moving Average indicator allows you to assess the direction of the market movement and its possible reversals. The indicator is a line that is displayed in the price window. Input parameters: LSMA_Period - the period for calculating the moving average using the least squares method; Prediction - the number of candles used to construct the predicted moving average using the least squares method, provided that its rate (falling or growing remains); D
The MTF MA Trend indicator is an advanced model of the moving average indicator. With this indicator, you can follow the moving averge inductor in the multi time frame from a single graphical display. This indicator shows 7 different time zones on a single graphical display. This display is designed in oscillator style. It is also a new generation trend indicator. Features It can work in 7 different time zones. different color settings can be made for each time zone. each time zone has a level
Le medie mobili cambiano in movimento. L'indicatore seleziona automaticamente il periodo per calcolare le medie mobili. Maggiore è il movimento direzionale, maggiore è il periodo di media. Quando la tendenza rallenta, il periodo delle medie mobili diminuisce e diventano più veloci. Ciò consente una risposta più rapida al cambiamento di tendenza.  L'indicatore funziona bene in una tendenza o in un punto di inversione di tendenza. In verde indicatore può essere usato al contrario, ad esempio qu
FREE
MTF Kijun
Kristmundur Roman Zakharii
4 (1)
The indicator plots higher timeframe Kijun-sen (of Ichimoku ) on lower timeframes. To change timeframes, in the timeframe field enter the number: M1    PERIOD_M1 1 1 minute. M5    PERIOD_M5 5 5 minutes. M15  PERIOD_M15 15 15 minutes. M30  PERIOD_M30 30 30 minutes. H1    PERIOD_H1 60 1 hour. H4    PERIOD_H4 240 4 hour. D1    PERIOD_D1 1440 Daily. W1   PERIOD_W1 10080 Weekly. MN1  PERIOD_MN1 43200 Monthly. By default, the Kijun is shifted 3 periods forward but if you wish to have it exactly
Support and Resistance Channels
Hossam Mohamed Abdelsalam Ahmed Abdelsalam
Support and Resistance technical indicator for mt4 that identifies the Strong support and resistance levels based on  Zigzag indicator with full control of Zigzag indicator setting , selectable Timeframes  as well as  SRL lines formats . Inputs: - Time frame. ----------------- Zigzag setting: ------------------ - Depth. - Deviation. - Backstep. -------------------- Peaks and valleys setting: - Min peaks gap in Points. // to be considered as a new level. - Peak sensitivity. // min no. of peaks
This indicator is the undisputed leader among the indicators. And for this statement there is a good reason. The indicator builds a very high quality channel in which it generates signals to enter! What is the ideal strategy for the trader, since the trader always hesitates when choosing a strategy for the job. That is, this indicator will allow you to solve the dilemma of choosing a job by trend or to the channel, since it combines these two basic concepts. Working with the indicator is very
The indicator detects and displays Shark harmonic pattern (see the screenshot). The pattern is plotted by the extreme values of the ZigZag indicator (included in the resources, no need to install). After detecting the pattern, the indicator notifies of that by a pop-up window, a mobile notification and an email. The indicator highlights the process of the pattern formation and not just the complete pattern. In the former case, it is displayed in the contour triangles. After the pattern is comple
Geo Fractals
Georgij Komarov
5 (1)
This is professional fractals indicator able to work "on several screens" while on a single chart. The product has been developed for scalpers and those relying on "accurate" entries. The indicator shows fractals from six timeframes and displays the distance between the price and a new emerging fractal on lower timeframes showing the price behavior more clearly and making its analysis more accurate on reversal points. The indicator displays fractals from the D1, H4, H1, M15, M5 and M1 timeframes
Power Real Trend
Oliver Ojeda Ojeda
Power Real Trend es un indicador que no repinta y que muestra la dirección real que tiene el mercado, ofreciendo una clara manera de confirmar entradas.  Es un indicador que para su constitución se realizan múltiples operaciones para formar los distintos rangos que se utilizan para su creación. Tiene un manejo muy sencillo dando sólo tres posibles valores (1,0,-1) altamente visual y de muy sencilla comprensión. La parte superior del mismo es la zona más sensible y la inferior corresponde a la te
ADX Pointer
Dominik Mandok
ADX Pointer is an indicator which is based on "Average Directional Index" and draws three numbers in chart window depending on the value of ADX. In ADX Pointer you can set "ADX_Period" which is of course period of Average Directional Index and you can also set 3 levels. When ADX value exceed first level ("ADX_Level1") in chart window appears number "1", when ADX exceed second level ("ADX_Level2") appears "2" and when ADX exceed third level ("ADX_Level3") appears "3". Simple. ADX Pointer works on
This indicator prepared by using 1311,2840 days moving average and Calculates the Envelopes.    This system can be used for 15M time frame.     This system is for Long term and profitable.    Signals are shown as arrows. as an optional,    you can set a voice alarm or email notification    You can fins our other products from link : https://www.mql5.com/en/users/drbastem/seller    Also, you can ask all your questins from email : haskayafx@gmail.com or mobile : +90 530 867 5076 or @MehmetBastem
SuperTrend V
Muhammad Hassaan
5 (1)
*This is TradingView indicator converted to mql4* The SuperTrend V indicator is a popular technical analysis tool used to identify trends and potential trend reversals in financial markets. It is based on the concept of the SuperTrend indicator but incorporates additional features and variations. The SuperTrend V indicator uses a combination of price action and volatility to determine the trend direction and generate trading signals. Here are the key components and features of the indicator:
FREE
APriceChannel is a modification of the standard Price_Channel indicator. The EA draws 2 levels - the upper level shows the price High for the specified period of time, the lower level shows the price Low for the same period. In addition to the period, you can set vertical offset in points to widen the channel up and down. This prevents false breakouts of current support/resistance levels. Inputs Period - time period in bars - the number of bars to calculate the price High/Low. Offset up and do
FREE
PREVIOUS INDICATOR’S DATA MA CROSSOVER https://www.mql5.com/en/users/earobotkk/seller#products P/S: If you like this indicator, please rate it with 5 stars in the review section, this will increase its popularity so that other users will be benefited from using it. This indicator notifies and draws an arrow on the chart whenever    the MA line has crossed over its previous indicator’s data MA filtered by MA Trend.   It also displays total pips gained from all the entry set-ups. Setting ·   You
FREE
Profit Trade
Aleksey Ivanov
The principle of constructing indicator lines .               Profit Trade  indicator is very effective for trading. Profit Trade  is a deep development of the well-known Donchian channel  indicator. The upper (BlueViolet color) Dup and the lower (IndianRed) Ddn lines of the indicator are constructed in the same way as in the Donchian channel , based on the highest (high of High) and lowest (low of Low) prices for the previous n1 = 20 periods. The middle line (Gold) Dm is constructed in the sam
Hma Vvm Hull
Valerij Mazurenko
Hma Vvm Hull è un indicatore professionale per lavorare in qualsiasi mercato, è particolarmente efficace quando si fa trading di coppie di valute, mostra le prime tendenze per cambiare la tendenza. L'indicatore ha molte impostazioni che ti consentono di usarlo con successo con vari metodi di trading e strategie di trading. È possibile installare più indicatori con parametri diversi su un grafico. Una varietà di avvisi personalizzabili consente al trader di controllare sempre la situazione del m
TwoMA Crosses
Nedyalka Zhelyazkova
TwoMA Crosses indicator displays arrows based on whether the short term moving average crosses above or below the long term moving average. A moving average doesn't predict price direction. Instead, it defines the current direction. Despite this, investors use moving averages to filter out the noise. Traders and investors tend to use the EMA indicator, especially in a highly volatile market because it’s more sensitive to price changes than the SMA. Download for FREE  TwoMA Crosses  EA from th
FREE
FX Flow
Eva Stella Conti
FX Flow   indicator can be used as an anticipator of the next trend, preferably confirmed by Price Action or another oscillator (RSi, Stochastic ..). It takes the money flows of the major currencies USD EUR GBP AUD NZD CAD CHF JPY into account, and processes them. Excellent tool for indices, but also for correlations between currencies. Works on each timeframes.  Blue line: Bull market Yellow line: Bear market Note : if the indicator opens the window, but does not draw lines, load the histo
Forex Indicator HTF Ichimoku for MT4 Ichimoku indicator is   one of the most powerful trend indicators .  H TF means -   H igher Time Frame This indicator is excellent for Trend Traders as well as combination with Price Action entries. HTF Ichimoku  Indicator allows you to attach Ichimoku from Higher time frame to your current chart. Up trend   - red line above blue one (and both lines are above cloud) /   Down trend   - red line below blue one  (and both lines are below cloud) Open BUY orders
Gli utenti di questo prodotto hanno anche acquistato
Gann Made Easy
Oleg Rodin
4.96 (45)
Gann Made Easy è un sistema di trading Forex professionale e facile da usare che si basa sui migliori principi del trading utilizzando la teoria di mr. WD Gann. L'indicatore fornisce segnali ACQUISTA e VENDI accurati, inclusi i livelli di Stop Loss e Take Profit. Puoi fare trading anche in movimento utilizzando le notifiche PUSH. Vi prego di contattarmi dopo l'acquisto! Condividerò i miei consigli di trading con te e fantastici indicatori bonus gratuitamente! Probabilmente hai già sentito parlar
Atomic Analyst
Issam Kassas
5 (1)
Innanzitutto, vale la pena sottolineare che questo indicatore di trading non è repaint, non è ridisegno e non presenta ritardi, il che lo rende ideale sia per il trading manuale che per quello automatico. L'Analista Atomico è un indicatore di azione del prezzo PA che utilizza la forza e il momentum del prezzo per trovare un miglior vantaggio sul mercato. Dotato di filtri avanzati che aiutano a rimuovere rumori e segnali falsi, e aumentare il potenziale di trading. Utilizzando più strati di in
Scalper Vault
Oleg Rodin
5 (27)
Scalper Vault è un sistema di scalping professionale che ti fornisce tutto il necessario per scalping di successo. Questo indicatore è un sistema di trading completo che può essere utilizzato dai trader di forex e opzioni binarie. L'intervallo di tempo consigliato è M5. Il sistema fornisce segnali di freccia accurati nella direzione della tendenza. Ti fornisce anche i segnali più alti e più bassi e i livelli di mercato di Gann. Gli indicatori forniscono tutti i tipi di avvisi, comprese le notifi
TPSproTREND PrO
Roman Podpora
5 (15)
TPSpro TRENDPRO  - is a trend indicator that automatically analyzes the market and provides information about the trend and each of its changes, as well as giving signals for entering trades without redrawing! The indicator uses each candle, analyzing them separately. referring to different impulses - up or down impulse. Exact entry points into transactions for currencies, crypto, metals, stocks, indices!  -  Version MT5               DETAILED DESCRIPTION        /       TRADING SETUPS           
Trend Screener
STE S.S.COMPANY
4.83 (86)
Indicatore di tendenza, soluzione unica rivoluzionaria per il trading di tendenze e il filtraggio con tutte le importanti funzionalità di tendenza integrate in un unico strumento! È un indicatore multi-timeframe e multi-valuta al 100% non ridipingibile che può essere utilizzato su tutti i simboli/strumenti: forex, materie prime, criptovalute, indici e azioni. Trend Screener è un indicatore di tendenza che segue un indicatore efficiente che fornisce segnali di tendenza a freccia con punti nel gra
Presentazione       Quantum Trend Sniper Indicator   , l'innovativo indicatore MQL5 che sta trasformando il modo in cui identifichi e scambi le inversioni di tendenza! Sviluppato da un team di trader esperti con un'esperienza di trading di oltre 13 anni,       Indicatore Quantum Trend Sniper       è progettato per spingere il tuo viaggio di trading verso nuove vette con il suo modo innovativo di identificare le inversioni di tendenza con una precisione estremamente elevata. *** Acquista Quant
Innanzitutto, vale la pena sottolineare che questo Strumento di Trading è un Indicatore Non-Ridipingente, Non-Ridisegnante e Non-Laggante, il che lo rende ideale per il trading professionale. L'Indicatore Smart Price Action Concepts è uno strumento molto potente sia per i nuovi che per i trader esperti. Racchiude più di 20 utili indicatori in uno solo, combinando idee di trading avanzate come l'Analisi del Trader del Circolo Interno e le Strategie di Trading dei Concetti del Denaro Intelligen
ATTUALMENTE SCONTATO DEL 26% La soluzione migliore per ogni principiante o trader esperto! Questo indicatore è uno strumento di trading unico, di alta qualità e conveniente perché abbiamo incorporato una serie di caratteristiche proprietarie e una nuova formula. Con un solo grafico è possibile leggere la forza delle valute per 28 coppie Forex! Immaginate come migliorerà il vostro trading perché sarete in grado di individuare l'esatto punto di innesco di una nuova tendenza o di un'opportunit
TPSpro RFI Levels
Roman Podpora
5 (13)
A key element in trading is zones or levels from which decisions to buy or sell a trading instrument are made. Despite attempts by major players to conceal their presence in the market, they inevitably leave traces. Our task was to learn how to identify these traces and interpret them correctly. Reversal First Impulse levels (RFI)   -  Version MT5                INSTRUCTIONS                 RUS                 ENG                                       R ecommended to use with an indicator   -  
Advanced Supply Demand
Bernhard Schweigert
4.92 (310)
CURRENTLY 26% OFF !! Best Solution for any Newbie or Expert Trader! This indicator is a unique, high quality and affordable trading tool because we have incorporated a number of proprietary features and a new formula. With this update, you will be able to show double timeframe zones. You will not only be able to show a higher TF but to show both, the chart TF, PLUS the higher TF: SHOWING NESTED ZONES. All Supply Demand traders will love it. :) Important Information Revealed Maximize the potenti
Entry Points Pro
Yury Orlov
4.7 (224)
Indicatore top per MT5 che fornisce segnali accurati per entrare in un trade senza riverniciare! Può essere applicato a qualsiasi attività finanziaria: forex, criptovalute, metalli, azioni, indici.  La versione MT5 è qui Fornirà segnali di trading piuttosto precisi e ti dirà quando è meglio aprire un trade e chiuderlo. Guarda il video (6:22) con un esempio di elaborazione di un solo segnale che ha ripagato l'indicatore! La maggior parte dei trader migliora i propri risultati di trading
Scalper Inside PRO
Alexey Minkov
4.75 (55)
SALE NOW! Limited Time Offer! An exclusive indicator that utilizes an innovative algorithm to swiftly and accurately determine the market trend. The indicator automatically calculates opening, closing, and profit levels, providing detailed trading statistics. With these features, you can choose the most appropriate trading instrument for the current market conditions. Additionally, you can easily integrate your own arrow indicators into Scalper Inside Pro to quickly evaluate their statistics and
Scopri il segreto per il trading Forex di successo con il nostro indicatore MT4 personalizzato! Ti sei mai chiesto come raggiungere il successo nel mercato Forex, guadagnando costantemente profitti minimizzando il rischio? Ecco la risposta che hai cercato! Permettici di presentare il nostro indicatore MT4 proprietario che rivoluzionerà il tuo approccio al trading. Versatilità unica Il nostro indicatore è appositamente progettato per gli utenti che preferiscono le formazioni di candele Ren
TrendMaestro
Stefano Frisetti
5 (2)
nota: questo indicatore e' per METATRADER4, se vuoi la versione per  METATRADER5 questo e' il link:  https://www.mql5.com/it/market/product/108123 TRENDMAESTRO riconosce un nuovo TREND sul nascere, non sbaglia mai. La sicurezza di identificare un nuovo TREND non ha prezzo. DESCRIZIONE TRENDMAESTRO identifica un nuovo TREND sul nascere, questo indicatore prende in esame la volatilita' i volumi ed il momentum per identificare il momento in cui c'e' un'esplosione di uno  opiu' di questi dati
Attualmente 20% di sconto! La soluzione migliore per ogni principiante o trader esperto! Questo software per cruscotti funziona su 28 coppie di valute. Si basa su 2 dei nostri indicatori principali (Advanced Currency Strength 28 e Advanced Currency Impulse). Offre un'ottima panoramica dell'intero mercato Forex. Mostra i valori di forza delle valute avanzate, la velocità di movimento delle valute e i segnali per 28 coppie Forex in tutti i (9) timeframe. Immaginate come migliorerà il vostro t
Presentazione dell'indicatore Miraculous Forex: Libera il potere del trading preciso Sei stanco di cercare il miglior indicatore Forex che fornisca risultati eccezionali su tutti i timeframe? Non cercare oltre! L'indicatore Miraculous Forex è qui per rivoluzionare la tua esperienza di trading e portare i tuoi profitti a nuove vette. Basato su tecnologia all'avanguardia e anni di sviluppo accurato, l'indicatore Miraculous Forex si distingue come l'apice di potenza e precisione nel mercato delle v
Market Reversal Alerts
LEE SAMSON
4.21 (121)
Il profitto dalla struttura del mercato cambia quando il prezzo si inverte e si ritira. L'indicatore di avviso di inversione della struttura del mercato identifica quando una tendenza o un movimento di prezzo si sta avvicinando all'esaurimento e pronto a invertire. Ti avvisa dei cambiamenti nella struttura del mercato che in genere si verificano quando stanno per verificarsi un'inversione o un forte pullback. L'indicatore identifica inizialmente i breakout e lo slancio del prezzo, ogni volta
FX Power MT4 NG
Daniel Stein
5 (8)
Ricevi il tuo aggiornamento quotidiano sul mercato con dettagli e schermate tramite il nostro Morning Briefing qui su mql5 e su Telegram ! FX Power MT4 NG è la nuova generazione del nostro popolare misuratore di forza delle valute, FX Power. Cosa offre questo misuratore di forza di nuova generazione? Tutto ciò che avete amato dell'FX Power originale IN PIÙ Analisi della forza di ORO/XAU Risultati di calcolo ancora più precisi Periodi di analisi configurabili individualmente Limite di calcolo pe
AVVISO DI ACQUISTO E VENDITA MULTIVALUTA e MULTITIMEFRAME. AUTO TAILING STOP E RISCHIO PREMIO TAKEPROFIT! L'INDICATORE SCANSIONA E ANALIZZA IL MERCATO COSÌ NON HAI NULLA DA FARE! SCAMBIA TUTTE LE TUE VALUTE SU 1 TABELLA!   Dopo l'acquisto lascia un commento contattami e ti invierò l'assistente commerciale EA. L'indicatore utilizza diversi oscillatori e filtri allegati per trovare i migliori punti di ingresso CONFERMATI, quindi non devi preoccuparti di questo! Ti avviserà e disegnerà un pu
Quantum Breakout Indicator PRO
Bogdan Ion Puscasu
4.96 (26)
Presentazione       Quantum Breakout PRO   , l'innovativo indicatore MQL5 che sta trasformando il modo in cui scambi le zone di breakout! Sviluppato da un team di trader esperti con un'esperienza di trading di oltre 13 anni,   Quantum Breakout PRO   è progettato per spingere il tuo viaggio di trading a nuovi livelli con la sua strategia innovativa e dinamica della zona di breakout. Quantum Breakout Indicator ti fornirà frecce di segnalazione sulle zone di breakout con 5 zone target di prof
PRO Renko System
Oleg Rodin
5 (24)
PRO Renko System è un sistema di trading altamente accurato appositamente progettato per il trading di grafici RENKO. Questo è un sistema universale che può essere applicato a vari strumenti di trading. Il sistema neutralizza efficacemente il cosiddetto rumore di mercato che consente di accedere a segnali di inversione accurati. L'indicatore è molto facile da usare e ha un solo parametro responsabile della generazione del segnale. Puoi facilmente adattare lo strumento a qualsiasi strumento
TrendDecoder Premium
Christophe, Pa Trouillas
5 (3)
Identificare i range e le prossime mosse probabili   |  Ottenere i primi segnali e la forza delle tendenze   |  Ottenere uscite chiare prima dell'inversione   |  Individuare i livelli di Fibo che il prezzo testerà Indicatore non tracciante e non ritardato - ideale per il trading manuale e automatizzato - adatto a tutti gli asset e a tutte le unità temporali Offerta limitata nel tempo >>   50% OFF Dopo l'acquisto, contattatemi su questo canale  per le impostazioni personalizzate. Versione   MT5 :
Currency Strength Wizard è un indicatore molto potente che ti fornisce una soluzione all-in-one per un trading di successo. L'indicatore calcola la potenza di questa o quella coppia forex utilizzando i dati di tutte le valute su più intervalli di tempo. Questi dati sono rappresentati in una forma di indice di valuta facile da usare e linee elettriche di valuta che puoi utilizzare per vedere il potere di questa o quella valuta. Tutto ciò di cui hai bisogno è collegare l'indicatore al grafico che
Trend Forecasting
Mohamed Hassan
5 (15)
This indicator is unstoppable when combined with our other indicator called Katana. After purchase, send us a message and you could get Katana for FREE as a BONUS After purchase, send us a private message for your instructions.  MT5 version: click here There are limited copies available at $55. Next price is $105. Don't miss this great deal!  The Trend Forecasting indicator is a very unique & easy tool that is able to make prediction about future price movement based on the signal
Advanced Currency IMPULSE with ALERT
Bernhard Schweigert
4.91 (493)
ATTUALMENTE SCONTATO DEL 31%! La soluzione migliore per ogni principiante o trader esperto! Questo indicatore è uno strumento di trading unico, di alta qualità e conveniente perché abbiamo incorporato una serie di caratteristiche proprietarie e una formula segreta. Con un solo grafico fornisce avvisi per tutte le 28 coppie di valute. Immaginate come migliorerà il vostro trading perché sarete in grado di individuare l'esatto punto di innesco di una nuova tendenza o opportunità di scalping!
FX Volume
Daniel Stein
4.6 (35)
Ricevi il tuo aggiornamento quotidiano sul mercato con dettagli e schermate tramite il nostro Morning Briefing qui su mql5 e su Telegram ! FX Volume è il PRIMO e UNICO indicatore di volume che fornisce una visione REALE del sentiment del mercato dal punto di vista del broker. Fornisce informazioni straordinarie su come gli operatori di mercato istituzionali, come i broker, sono posizionati sul mercato Forex, molto più velocemente dei rapporti COT. Vedere queste informazioni direttamente sul vo
Shepherd Harmonic Pattern
Abdullah Alrai
4.68 (59)
Questo indicatore rileverà modelli armonici disegnati sul grafico mediante metodi manuali e automatici. Puoi consultare il manuale dell'utente tramite questo link: Aggiungi la tua recensione e contattaci per ottenerlo. C'è una versione gratuita per provare questo prodotto su MT4. Puoi usarlo per rilevare i modelli di Gartley e Nenstar: https://www.mql5.com/en/market/product/30181 Puoi acquistare la versione completa di MT4 da: https://www.mql5.com/en/market/product/15212 Note L'indicatore ha un
TakePropips Donchian Trend Pro
Eric John Pajarillaga Aldana
4.82 (17)
TakePropips Donchian Trend Pro   (MT4) è uno strumento potente ed efficace che rileva automaticamente la direzione del trend utilizzando il canale Donchian e ti fornisce segnali di trading di entrata e uscita! Questo indicatore multifunzione include uno scanner di tendenza, segnali di trading, pannello statistico, screener, sessioni di trading e dashboard della cronologia degli avvisi. È progettato per fornirti segnali di trading e farti risparmiare ore analizzando i grafici! È possibile scarica
How to use Pair Trading Station Pair Trading Station is recommended for H1 time frame and you can use it for any currency pairs. To generate buy and sell signal, follow few steps below to apply Pair Trading Station to your MetaTrader terminal. When you load Pair Trading Station on your chart, Pair Trading station will assess available historical data in your MetaTrader platforms for each currency pair. On your chart, the amount of historical data available will be displayed for each currency pai
Market Structure Patterns MT4
Samuel Manoel De Souza
5 (15)
Market Structure Patterns   is an indicator based on   smart money concepts   that displays almost all of the   SMC/ICT   elements needed to take your trading decisions to the next level. Take advantage of the   alerts ,   push notifications   and   email messages   to keep informed from when an element is formed on the chart, the price crosses a level and/or enters in a box/zone. Developers can access the values of the elements of the indicator using the   global variables  what allows the aut
Altri dall’autore
UniversalEA
Sergey Deev
4 (6)
The Expert Advisor allows you to build a trading system based on a custom indicator. It performs automated opening/closing of deals based on the signals of an indicator that places values ​​other than 0 and EMPTY_VALUE in the buffer. The EA polls the values ​​of the specified indicator buffers, opens/closes and accompanies trades according to the specified parameters. The Expert Advisor implements the following trade support functions: - installation for the transaction SL and TP; - calculation
The indicator detects and displays М. Gartley's Butterfly pattern. The pattern is plotted by the extreme values of the ZigZag indicator (included in the resources, no need to install). After detecting the pattern, the indicator notifies of that by the pop-up window, a mobile notification and an email. The pattern and wave parameters are displayed on the screenshots. The default parameters are used for demonstration purposes only in order to increase the amount of detected patterns. Parameters
EA Locking Grid
Sergey Deev
5 (2)
Semiautomatic EA for trading based on the averaging and locking strategy. The trader sends signals for opening grids by using the buttons on the chart. The EA opens a market order, places a grid of limit orders in the same direction with lot multiplication according to specified parameters and a locking stop order in the opposite direction with the volume equal to the sum of all the previous ones. Once the price passes the specified breakeven level, the EA places a stop loss at the open price+sp
MACD Divergence
Sergey Deev
2.5 (2)
The indicator detects divergence signals - the divergences between the price peaks and the MACD oscillator values. The signals are displayed as arrows in the additional window and are maintained by the messages in a pop-up window, e-mails and push-notifications. The conditions which formed the signal are displayed by lines on the chart and in the indicator window. Indicator Parameters MacdFast - fast MACD line period MacdSlow - slow MACD line period MacdSignal - MACD signal line period MacdPri
The indicator displays Renko bars on the chart, uses their data to calculate and display the moving average, PriceChannel and generates buy/sell signals. Renko is a non-trivial price display method. Instead of displaying each bar within a time interval, only the bars where the price moved a certain number of points are shown. Renko bars do not depend on a time interval, therefore the indicator works on any timeframe without losing its efficiency. The PriceChannel indicator displays the upper, lo
The indicator displays the data of the Stochastic oscillator from a higher timeframe on the chart. The main and signal lines are displayed in a separate window. The stepped response is not smoothed. The indicator is useful for practicing "manual" forex trading strategies, which use the data from several screens with different timeframes of a single symbol. The indicator uses the settings that are identical to the standard ones, and a drop-down list for selecting the timeframe. Indicator Parame
The indicator displays the data of the candles from a higher timeframe on the chart. Only the candle body (by the open and close prices) is displayed. The candlesticks are colored depending on the difference between the open and close prices. After removing the indicator from the chart, the objects used by it are deleted automatically. Indicator Parameters TimeFrame - time frame (drop-down list) BearColor - bearish candle color (standard dialog) BullColor - bullish candle color (standard dialo
The indicator displays the data of a standard MACD indicator from a higher timeframe. The product features notifications of crossing the zero or signal line by the histogram. Parameters TimeFrame - indicator timeframe (dropdown list) MacdFast - fast line period MacdSlow - slow line period MacdSignal - signal line period MacdPrice - price type (dropdown list) AlertCrossZero - enable notifications of crossing the zero line AlertCrossSignal - enable notifications of crossing the signal line UseNo
The indicator displays the moving average of a higher timeframe on the chart. The indicator parameters TimeFrame - time frame of the moving average (drop-down list) MaPeriod - moving average period MaMethod - moving average method (drop-down list) MaShift - moving average shift MaPrice - moving average price (drop-down list)
MTF ATR
Sergey Deev
The indicator displays the data of the Average True Range (ATR) from a higher timeframe on the chart. It allows you to see the scope of the movement without having to switch to another screen terminal The indicator parameters TimeFrame - time frame of the data (drop-down list) can not be lower than current AtrPeriod - period of the Average True Range indicator a higher timeframe range
MTF ADX
Sergey Deev
5 (1)
The indicator displays the data of the standard ADX indicator from a higher timeframe on the chart. Several indicators with different timeframe settings can be placed on a single chart. The indicator parameters TimeFrame - time frame of the data (drop-down list) can not be lower than current AdxPeriod - period of the indicator for a higher timeframe AdxPrice - prices for the calculation of the indicator data from a higher timeframe
The indicator displays the averaged value of the moving averages of the current and two higher timeframes with the same parameters on the chart. If the moving averages are located one above the other, the resulting one is painted in green, showing an uptrend, in the opposite direction - red color (downtrend), intertwined - yellow color (transitional state) The indicator parameters MaPeriod - moving average period MaMethod - moving average method (drop-down list) MaShift - moving average shift
The indicator displays the price movement on the chart, which is smoothed by the root mean square function. The screenshot shows the moving average with period 20, the smoothed root mean square (red) and simple SMA (yellow). The indicator parameters MAPeriod - Moving average period MaPrice - applied price (drop down list, similar to the standard MovingAverage average) BarsCount - number of processed bars (reduces download time when attaching to the chart and using in programs).
SqrtDev
Sergey Deev
The indicator displays the standard price deviation from the root mean moving average line in the additional window. The screenshot displays the standard indicator (the lower one) and SqrtDev (the upper one). Parameters SqrtPeriod - root mean line and standard deviation period. SqrtPrice - applied price (drop-down list). BarsCount - amount of processed bars (reduces the download time when applying to a chart and using in programs).
The indicator detects and displays the 5-0 harmonic pattern on the chart according to the scheme provided in the screenshot. The pattern is plotted by the extreme values of the ZigZag indicator (included in the resources, does not require additional installation). After detecting the pattern, the indicator notifies of that by the pop-up window, a mobile notification and an email. The indicator highlights not only the complete figure, but also the time of its formation. During the formation the f
The indicator detects and displays the AB=CD harmonic pattern on the chart according to the scheme provided in the screenshot. The pattern is plotted by the extreme values of the ZigZag indicator (included in the resources, does not require additional installation). After detecting the pattern, the indicator notifies of that by the pop-up window, a mobile notification and an email. The indicator highlights not only the complete figure, but also the time of its formation. During the formation the
The indicator detects and displays the White Swan and Black Swan harmonic pattern on the chart according to the scheme provided in the screenshot. The pattern is plotted by the extreme values of the ZigZag indicator (included in the resources, does not require additional installation). After detecting the pattern, the indicator notifies of that by the pop-up window, a mobile notification and an email. The indicator highlights not only the complete figure, but also the time of its formation. Duri
The indicator detects and displays Shark harmonic pattern (see the screenshot). The pattern is plotted by the extreme values of the ZigZag indicator (included in the resources, no need to install). After detecting the pattern, the indicator notifies of that by a pop-up window, a mobile notification and an email. The indicator highlights the process of the pattern formation and not just the complete pattern. In the former case, it is displayed in the contour triangles. After the pattern is comple
The indicator detects and displays 3 Drives harmonic pattern (see the screenshot). The pattern is plotted by the extreme values of the ZigZag indicator (included in the resources, no need to install). After detecting the pattern, the indicator notifies of that by a pop-up window, a mobile notification and an email. The indicator highlights the process of the pattern formation and not just the complete pattern. In the former case, it is displayed in the contour triangles. After the pattern is com
The indicator detects and displays Cypher harmonic pattern also known as Anti-Butterfly (see the screenshot). The pattern is plotted by the extreme values of the ZigZag indicator (included in the resources, no need to install). After detecting the pattern, the indicator notifies of that by a pop-up window, a mobile notification and an email. The indicator highlights the process of the pattern formation and not just the complete pattern. In the former case, it is displayed in the contour triangle
RenkoMaSignals
Sergey Deev
1 (1)
The indicator displays Renko bars on the chart, plots two moving averages by them and generates buy/sell signals based on the conditions displayed in the screenshots and described below: the buy signal is formed if the fast moving average is above the slow moving average, from 4 to 10 consecutive bullish Renko bars are displayed, followed by no more than 2 bearish and one bullish Renko bars; the sell signal is formed if the fast moving average is below the slow moving average, from 4 to 10 conse
RenkoMacdSignals
Sergey Deev
1 (1)
The indicator displays renko bars on a chart, use them to plot MACD histogram and provides buy/sell signals: signal of MACD histogram crossing its signal line; signal of MACD histogram crossing the line 0. Renko is a non-trivial price display method. Instead of displaying each bar within a time interval, only the bars where the price moved a certain number of points are shown. Renko bars do not depend on a time interval, therefore the indicator works on any timeframe without losing its efficienc
RenkoMaStoch
Sergey Deev
1 (1)
The indicator displays renko bars on a chart, uses them to plot the fast and slow moving average and Stochastic, as well as it provides buy/sell signals: a buy signal is generated when the fast moving is above the slow one, and the signal line of Stochastic crosses the lower level from bottom up; a sell signal is generated when the fast moving is below the slow one, and the signal line of Stochastic crosses the upper level from top to bottom; Renko is a non-trivial price display method. Instead
The indicator displays Renko bars on the chart and uses them to plot the ZigZag - trend lines connecting the local Lows and Highs of the price movement. Renko - specialized display of the price action, in which the graph is displayed not every bar of the time frame, but only under the condition that the price had passed more than the specified number of points. Renko bars are not bound to a time frame, so the indicator can work on any time frame with the same efficiency. This implementation of t
The indicator displays Renko bars on the chart, uses them to plot the ZigZag - trend lines connecting the local Lows and Highs of the price movement, and highlights them based on the Gartley patterns, showing the potential price reversal points. Renko - specialized display of the price action, in which the graph is displayed not every bar of the time frame, but only under the condition that the price had passed more than the specified number of points. Renko bars are not bound to a time frame, s
The indicator displays renko bars on a chart, uses them to plot the MACD oscillator and determines the divergence conditions (divergences of price movements and oscillator values). The buy/sell signal is formed if the next High/Low price is not confirmed by the oscillator values. The ZigZag indicator is used to evaluate the extremums. Only the last 3 peaks are taken into account (see the screenshot). If peak 1 is higher than peak 2 or peak 3, and at the same time the macd value is lower, then a
The indicator displays renko bars on a chart and uses them to create ZigZag indicator - trend lines connecting local price movement Highs and Lows. The indicator, in turn, is used to create AB=CD displaying potential price reversal points. Renko is a non-trivial price display method. Instead of displaying each bar within a time interval, only the bars where the price moved a certain number of points are shown. Renko bars do not depend on a time interval, therefore the indicator works on any time
The indicator calculates and displays renko bars using MA and PSAR data as well as provides buy/sell signals. Renko is a non-trivial price display method. Instead of displaying each bar within a time interval, only the bars where the price moved a certain number of points are shown. Renko bars do not depend on a time interval, therefore the indicator works on any timeframe without losing its efficiency. Buy signal forms when PSAR readings are moving down, MA is moving up, the price is closing ab
RenkoBandMacd
Sergey Deev
1 (1)
The indicator displays Renko bars on the chart, uses their data to calculate and display the Bollinger Bands, MACD oscillator and generates buy/sell signals. Renko is a non-trivial price display method, in which a bar within a time interval is shown on the chart only if the price has moved a certain number of points. Renko bars do not depend on a time interval, therefore the indicator works on any timeframe without losing its efficiency. When attached to a chart, the indicator checks for presenc
The indicator displays Renko bars on the chart, plots a channel based on that data and generates buy/sell signals. Renko is a non-trivial price display method, in which a bar within a time interval is shown on the chart only if the price has moved a certain number of points. Renko bars do not depend on a time interval, therefore the indicator works on any timeframe without losing its efficiency. The channel is defined as the upper and lower boundaries of the price movement over the specified per
Filtro:
sunnychow
8753
sunnychow 2018.12.16 13:18 
 

L'utente non ha lasciato alcun commento sulla valutazione.

Elpis
259
Elpis 2017.03.06 14:47 
 

L'utente non ha lasciato alcun commento sulla valutazione.

Maksym Mudrakov
29227
Maksym Mudrakov 2016.08.31 07:12 
 

L'utente non ha lasciato alcun commento sulla valutazione.

Rispondi alla recensione
Versione 1.1 2021.11.18
Обновление под новый билд