
Developing a cross-platform grid EA (Last part): Diversification as a way to increase profitability
Introduction
In previous articles within this series, we tried various methods for creating a more or less profitable grid Expert Advisor. We managed to implement the second part of the phrase, "more or less profitable". Issues occurred with the first part. The Expert Advisor was making profit over a long time interval, but the profit was not large enough to justify the use of an order grid or martingale.
Our ultimate goal is to reach 100% profit per year with the maximum balance drawdown no more than 20%. We couldn't achieve this goal.
In this article we will try to implement this ultimate performance. Better yet, if we can surpass these numbers.
Methods to increase EA profitability
If we do not alter the underlying trading system, there are two other possible ways, which might help us increase profitability.
The first method is to decrease the time period, in which the EA parameters are optimized. This can allow us to accurately adjust the EA to the current market cycle and receive the maximum profit.
However, this method has a significant drawback. Past profit does not guarantee future profits. The lower the time interval used for EA testing,
the higher the risk of that a strategy can be destroyed by market changes.
The second method implies multi-currency trading (diversification). Lot size for each financial instrument will be lower than with single-currency trading. With such loss management, even if you hit drawdown or stop loss on any of the instruments, the maximum balance drawdown will be less than with single-currency trading. In addition, profit on other symbols can help in recovering the deposit faster.
Thus, diversification is mainly designed not to increase the trading profit, but to reduce the maximum drawdown. The only exception is when deals on separate instruments are rare enough so that opening of deals on different instruments almost never overlap.
Again, we consider an idealistic option, when only one of the instruments experiences drawdowns, while no issues occur with the rest of the
instruments and they keep earning profit. Can this happen in reality? Note that strong movements of major forex pairs almost always affect
other currency pairs. Will a problem with one of the symbols automatically mean problems with other instruments? In this case, instead of
drawdown reduce we will receive an even greater drawdown.
In order to check whether financial symbols are independent, we need an Expert Advisor which allows trading multiple instruments at once.
Considering a new Expert Advisor
Of course we could use the Expert Advisor form our previous article (Developing a cross-platform grid EA (Part III): Correction-based grid with martingale), which can only trade one symbol. We could run separate tests on different instruments and then compare the optimization results and try to understand how multiple currency trading would affect maximum drawdown.
However, this process would take too much time. The result of such comparison would also be doubtful.
Therefore, for this article I have revised the last EA to enable it to run on multiple symbols simultaneously: it can trade up to 11 instruments at a time:
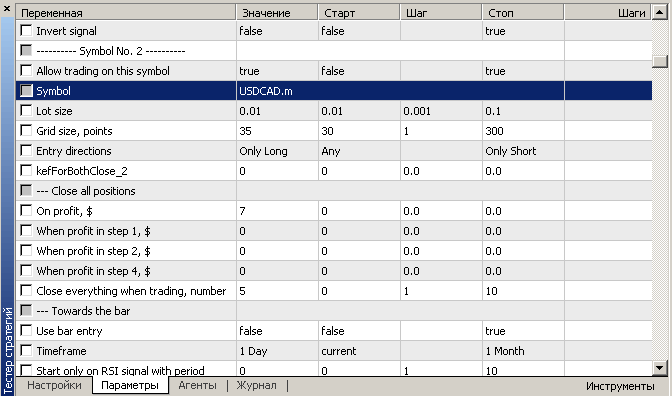
The name of the new Expert Advisor is griderKatMultiAEA. Its source code and compiled versions are attached below.
We will not consider the structure and the source code of the new Expert Advisor. The only difference from the previous Expert Advisor version is that separate input parameters are used for each of the trading symbols. The current version features 11 sets of parameters, while the previous EA had only one set. For each of the sets, you can add a symbol name which you want to use in testing.
Expert Advisor Testing and Optimization
Despite the fact that this is still a cross-platform EA, it can be tested and optimized only in MetaTrader 5.
MetaTrader 4 does not support testing on multiple instruments. Moreover, it does not allow testing one symbol if it differs from the currently launched instrument. Nevertheless, multicurrency Expert Advisors, including the one developed within this article can run in MetaTrader 4.
The working timeframe is again M5. The optimization will be performed in mode Every tick based on real ticks. Testing results are evaluated based on balance and recovery factor.
In the previous article, the EA was tested in a 5-year period. Now let us reduce the testing interval to 1 year. That is the testing period is: from 2018.10.01 to 2019.10.01.
As mentioned above, by reducing the interval we can select the most optimal EA parameters which suit the current price movement nature. But if you reduce the testing interval, make sure to re-optimize EA parameters from time to time. For example, you may re-optimize EA settings every month if optimization is performed on a 1-year period.
Revising the trading system
A lot of time has passed since the publication of the previous article. This time was required to test the grid EA on a real account. During this time, one account deposit was completely lost, the second account is almost lost, while on the third account the EA managed to double the deposit and then lost all the profit.
Due to such discouraging results, I added new rules, which we will follow when optimizing the Expert Advisor within this article.
The lost account and the one which has almost been lost were opened for stock exchange trading. Here the problem does not concern the trading system as a whole, but it concerns the margin level required to maintain open positions.
In practice, it turned out that a large chain of positions is unacceptable for the stock market. Due to a small leverage, which is usually available in the stock market, a substantial amount is frozen on the account when opening and maintaining a position. After the fifth position in the unfavorable direction, the balance is not enough to open new positions. In this case the Expert Advisor is no longer able to trade according to the underlying algorithm. It cannot open new positions and even cannot close exiting positions by stop loss, because the chain has not reached the maximum possible step.
Because of this feature and the fall of Intel shares, the first account was lost. On the second account, which also worked on the stock market, the maximum chain of positions for one instrument was limited to 4. But event this seems to be a lot, and if Nike shares go even higher, it will also be lost, because margin is not enough to open new positions and complete the chain.
What would happen, if margin was enough for the correct operation of the EA? This can be checked on another account; its
signal is available at this link. At first, a profit of $400 was received on this account, but over the last month only $140 of profit was
left. Still it is a profit.
As for a signal in the Forex market, it performed well until a strong movement in one of the instruments began and 100% of profit earned for 15 trading days was lost.
The EA used floating stop-levels when trading this instrument. It means that additional positions for the symbol were opened not in fixed levels but depending in the price behavior. Namely, they were opened at rollbacks. The idea seemed good, but then a movement began with almost no rollbacks, during which the whole profit was lost.
As a result, the following rules have been added to our tests.
- Firstly, trading is only performed in the Forex market, in which large leverage can be used, which means you can open a larger number of positions with a limited balance.
Besides, the maximum number of open positions in the chain is 2. That is, if the price reaches the level at which opening of the 3 positions in the chain is needed, the EA will close all open positions in the chain instead.
Suppose the step is equal to, let's say, 40 points. Then if the price moves 80 points relative to the first position open level, a stop loss will trigger. The stop loss size will be equal to 120 points (80 stop loss points of the first open position and 40 points of the second one).
Of course, it would be better if the chains were limited to one position. However, this would no longer be a grid. Moreover, without a chain of deals our strategy can hardly earn any substantial profit.
- Another new rule: the step between positions must be fixed in points.
Within this trading strategy, we open an additional position only if the price moves a certain number of points opposite to the last open position.
As for the position opening principle, it has also changed.
In the previous article, we tested several methods for opening the first position:
- in the previous day movement direction;
- in the direction or against the movement of a series of unidirectional bars;
- depending on the position of the current price relative to the moving average.
Now, we will test another method: opening of the first position based on the RSI indicator values. If RSI value exceeds 80, open a Short
trade. If RSI falls below 30, open a Long trade. It means that positions are opened against the current trend.
Based on my observations, RSI with the 5-minute timeframe is best suitable for our EA, therefore we will use this timeframe for testing and optimization. Moreover, even the RSI indicator period will be fixed. It will be set to 35. Tests have shown that on any instrument, a period value of more than 35 sharply reduces the number of deals, which is unacceptable for us. If the values are below 35, the number of stop losses increases and trading becomes unprofitable.
Thus, we will optimize the EA using 3 parameters:
- grid size
- entry direction (any direction, only Long, only Short)
- Take Profit level
Testing the new system on separate symbols
We will act as follows:
- firstly, test and optimize on each of the Forex instruments
- based on the results received, select 5 best-performing instruments
- after that we will try to combine the instruments and we'll see if it is possible to increase the EA recovery factor through diversification. That is, whether trading profitability can be increased.
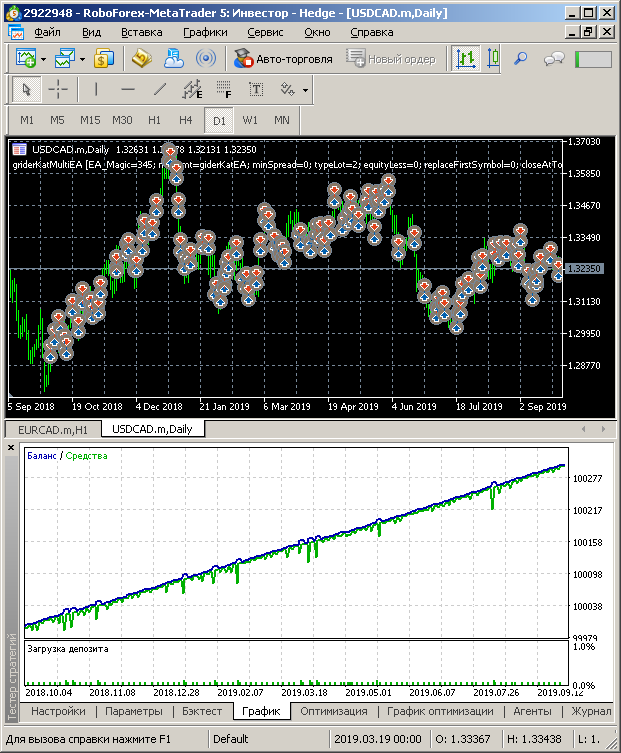
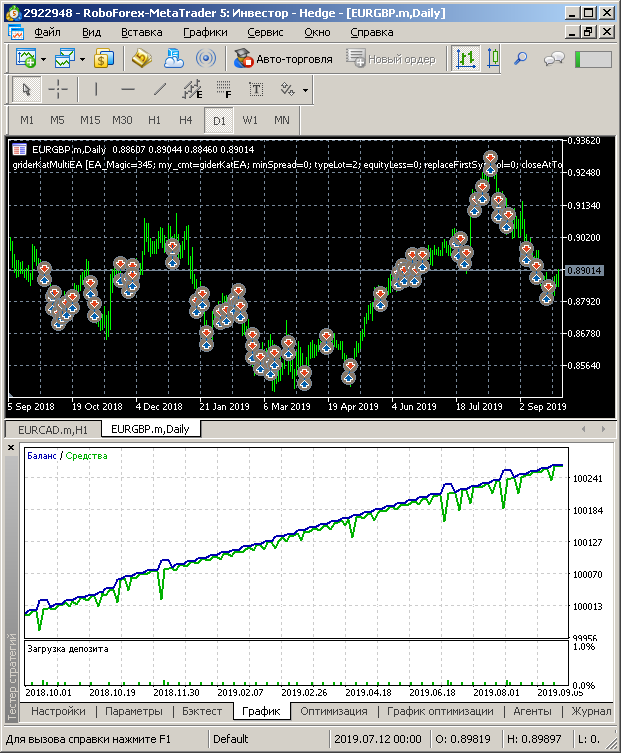
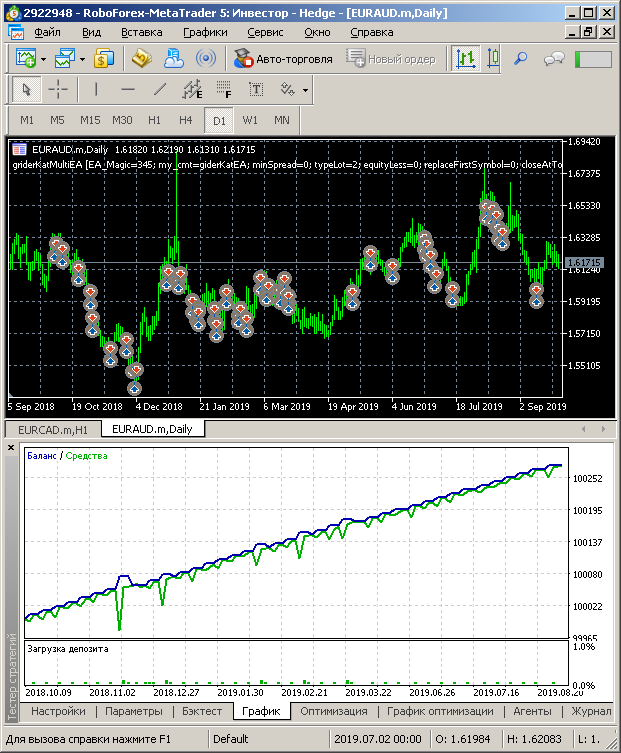
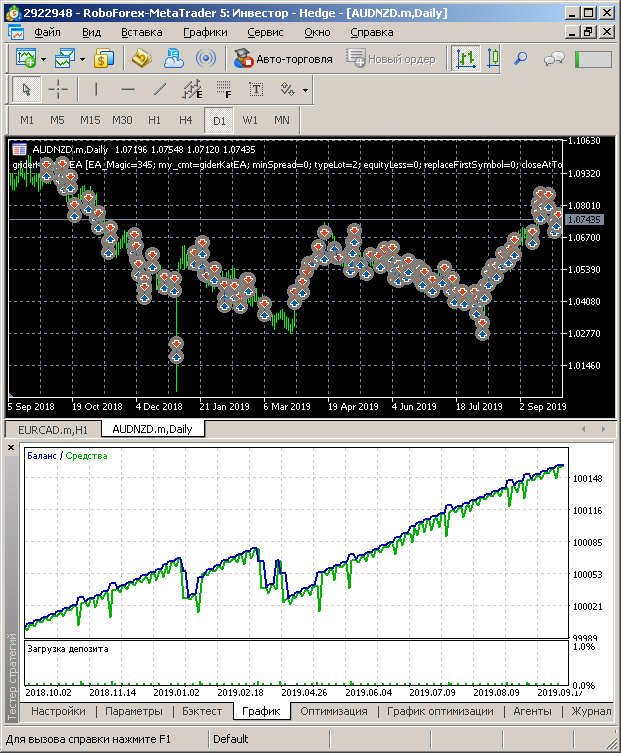
Here are the results. All tests and optimizations have been performed. The following winners were determined based on the obtained results: USDCAD, EURUSD, EURGBP, EURAUD, AUDNZD. Strategy tester reports are attached below. Here is the summary table with testing results:
| Symbol |
Recovery Factor |
Max. drawdown, $ |
Trades |
Entry direction |
|---|---|---|---|---|
| USDCAD |
7.78 |
39 |
104 |
Any |
| EURUSD |
6.05 |
52 |
49 |
Short |
| EURGBP |
5.17 |
51 |
51 |
Long |
| EURAUD |
3.61 |
77 |
42 |
Long |
| AUDNZD | 2.57 | 63 | 75 | Any |
There is no point in providing here balance graphs, except for AUDNZD, since the graphs are very similar with so high recovery factor values.
Nevertheless, I have added them here. Also the screenshots contain a 1-year financial instrument price chart with the D1 timeframe, in
which position open points are shown. Thus, we can view the nature of the price movement during the tested year.
USDCAD, any direction:
EURUSD, Short:

EURGBP, Long:
EURAUD, Long:
AUDNZD, any direction:
Testing the trading system with a set of instruments
Based on the previous tests, the EA performed best on the USDCAD symbol. Its recovery factor was 7.78. It means that with the maximum profit of $100, we earned $778 for a year while trading a fixed lot.
But the drawdown of $100 is equal to 100%. In order to achieve the target drawdown of 20%, we need to reduce the lot by 5 times. In this case, the recovery factor will also decrease by 5 times: 7.78 / 5 = 1.5.
Thus, by reducing the testing interval we managed to exceed the target values: instead of 100% annual profit with a drawdown of 20%, we managed to earn 150%.
But risks are still huge. We entrust the entire deposit to one symbol. If a stop loss is hit in a chain, we will lose a significant part of our profit. Let us continue our research and see how diversification will affect the system.
Optimization will be performed using the selected set of financial instruments. We will test a combination of 5 symbols and see how they interact.
After the tests performed, the best result was obtained when trading the selected five symbols simultaneously:
- Recovery factor: 17.11;
- Maximum drawdown, $: 77;
- Total trades: 324.
The final balance graph when trading 5 symbols at a time:

The recovery factor increased to 17.11. That is, by diversifying the strategy, we increased profitability by almost 2.25 times. This was
achieved with a fixed lot used for all instruments. As can be seen in the above table, the maximum drawdown of the traded symbols differs.
Thus, we can increase position volume for the instruments, which had a lower maximum drawdown. This way profit can be further increased.
Even with the above settings, provided 100% annual profit is enough, diversification helped us decrease trading volumes by 2.25 and thus reduce the risk.
Stock market trading strategy
Is there a way to trade stock market instruments? Earlier, we decided not to trade in the stock market due to a small leverage. However, let us try to adjust the strategy to the stock market.
Changing the lot increase method. The first modification will be as follows: the geometric lot increase principle in the grid
will be replaced with an arithmetic one. This can be done in the
Chain increase parameter in EA settings.
What is the effect of this? Let us consider the example of a grid, which has 10 open positions. The initial grid lot is 0.01:
- geometric increase: 0.01 + 0.01 + 0.02 + 0.04 + 0.08 + 0.16 + 0.32 + 0.64 + 1.28 + 2.56 = 5.44 total lot
- arithmetic old: 0.01 + 0.01 + 0.02 + 0.03 + 0.05 + 0.08 + 0.13 + 0.21 + 0.34 + 0.55 = 1.45 total lot
- arithmetic new: 0.01 + 0.02 + 0.03 + 0.04 + 0.05 + 0.06 + 0.07 + 0.08 + 0.09 + 0.1 = 0.55 total lot.
As you can see, geometric increase generates a much higher total lot, than other types.
"Arithmetic old" refers to a traditional arithmetic progression. It was used in previous EA versions, which were attached in previous articles.
The "arithmetic new" option is used within this EA version, it actually increases the next position volume by adding the initial lot. It has nothing to do with the original arithmetic progression.
Entry direction. If you open a monthly chart of 99% of the major instruments traded on the stock market, you can see with a naked eye that all these instrument charts are growing. Thus, there is no need to experiment with the entry direction. Trend is your best friend! In the stock market, this friend is almost always moving in the Long direction.
All our grids will also open in the Long direction. Without any conditions. If there are no open symbol positions, a Long position with an initial lot size will be opened.
If your broker pays dividends on shares, then opening of only Long positions provides an additional income in the form of dividends. It means
you will not lose money on dividends with short positions.
Testing period. You may notice that markets are not 100% of rime rising. One of the examples is 2008.
It is hard to say how the strategy will react if the stock price falls by 40 or more. Unfortunately my broker does not provide historical data for 2008. But event for the last 4 years stocks were not moving only upwards. There were price corrections. We will see now how the grid can survive in case of corrections. Our testing period is from 2015.10.01 to 2019.10.01.
In addition to the balance graph, a 4-year symbol price chart will be presented further. This chart shows which drawdowns our grid-based system can withstand.
Partial position closure. Further we will use features, which were not mentioned in previous articles within this series.
These include partial closing of farthest positions in the grid by using the profit of near positions.
For example, the price moves against our grid. The grid already has 5 open positions. The first position with the volume of 0.01 lot has a loss
of, let's say, 1 dollar. The volume of the last open position is 0.05 lots. Then the symbol price starts moving in a favorable direction.
Because the nearest position has a much larger volume, than the first one in the grid, its profit can quickly exceed 1 dollar. So, we can close this position with a profit, along with the first open position, which has loss.
As a result of closing these two positions, we will still receive some profit. The desired profit amount is specified in EA settings.
What is the benefit of partial closing?
- If it is not a global price reversal but is a small correction, we can close some of grid positions and obtain profit. It means that we will close the positions with the worst prices and will move the grid closer to the current price. If the price starts moving in the unfavorable direction again, the drawdown will be less, since some of the positions will have been closed.
- In a sideways movement, we can close even more open positions. While the price moves back and forth, we will open new positions with a larger volume in the lower part of the flat movement, and will close them together with farthest positions in the upper part of the side movement, and thus we will reduce the volume of our grid. During a long sideways period, we can close the entire grid even if the price does not eventually go upwards.
- If it is a global reversal, the grid will be closed much later than when used without partial closure. But global price reversals with prolonged drops are not as common, as corrections or sideways movements. Even in this case partial closure can be beneficial, since the grid will be ultimately closed.
Testing results for the stock market
Our trading strategy rules have been outlined. Now it is time to test and optimize it for stock market instruments.
The strategy will be optimized by:
- grid step: 35 - 250 points
- profit size for partial closing: 2 - 9 USD
- profit size for partial closure of boundary positions in the greed: 0.5 - 2 USD.
The strategy was tested on 41 instruments. Only 9 of them, which showed the best results, are considered in this article.
Of all the 41 tested instruments, only 1 was losing with all optimization options. Those who follow stock market updates can guess the instrument. It is General Electric: shares have been steadily falling for quite a long time.
All other symbols showed positive profit during the last 4 years. Moreover, most of the tested instruments showed positive profit with any EA settings. In other word, none of the settings combinations resulted in loss.
The bad thing is that even the best symbols could hardly show a profit of 150% per year with a maximum drawdown of 100%. Thus, if we reduce lot to keep 20% drawdown, the annual profit will only be 30%.
Here are the best performing financial instruments:
| Symbol |
Recovery factor for 4 years / avg. for 1 year |
Max. drawdown, $ |
Trades |
|---|---|---|---|
| VZ |
5.24 / 1.3 |
50 |
306 |
| MCD |
5.39 / 1.3 |
176 |
522 |
| JPM |
6.41 / 1.6 |
156 |
774 |
| KO |
7.18 / 1.8 |
27 |
197 |
| MSFT |
11.2 / 2.8 |
67 |
429 |
| NKE | 6.37 / 1.6 |
116 | 384 |
| ORCL |
5.52 / 1.3 |
106 | 367 |
| CSCO | 5.48 / 1.3 |
43 | 139 |
| EBAY | 5.15 / 1.3 |
102 | 677 |
As you can see, the average number of trades in 4 years varies from 130 to 780, which makes even less than 1 trade in several days. Results for other symbols are similar. The more trades, the lower the total profit.
This happens very often: the less frequently the EA opens positions, the best results are obtained.
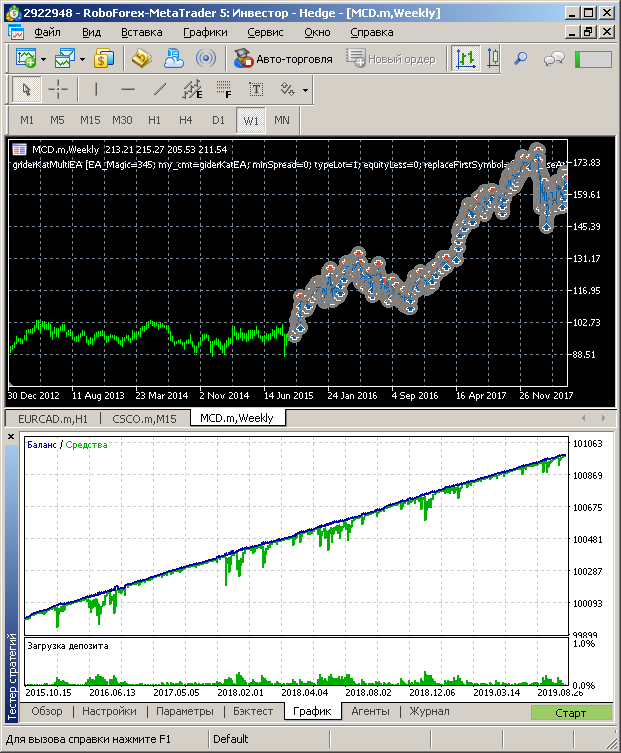
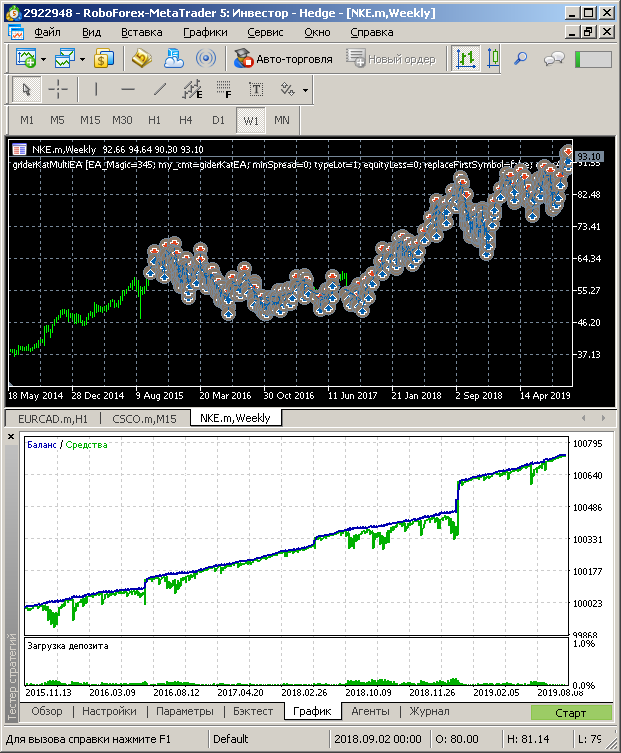
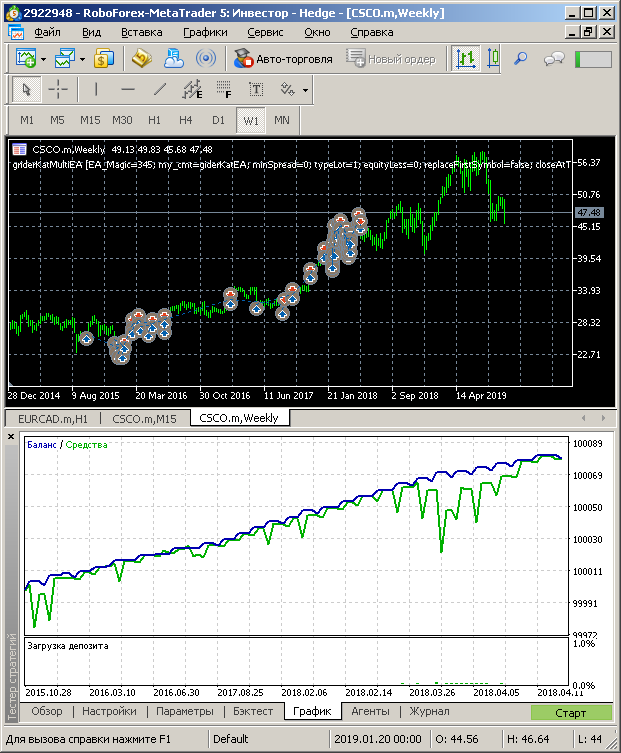
But this is my personal opinion. So, let us view the balance graphs and price movements of the above instruments.
VZ:

MCD:
JPM:

KO:

MSFT:

NKE:
ORCL:

CSCO:
EBAY:
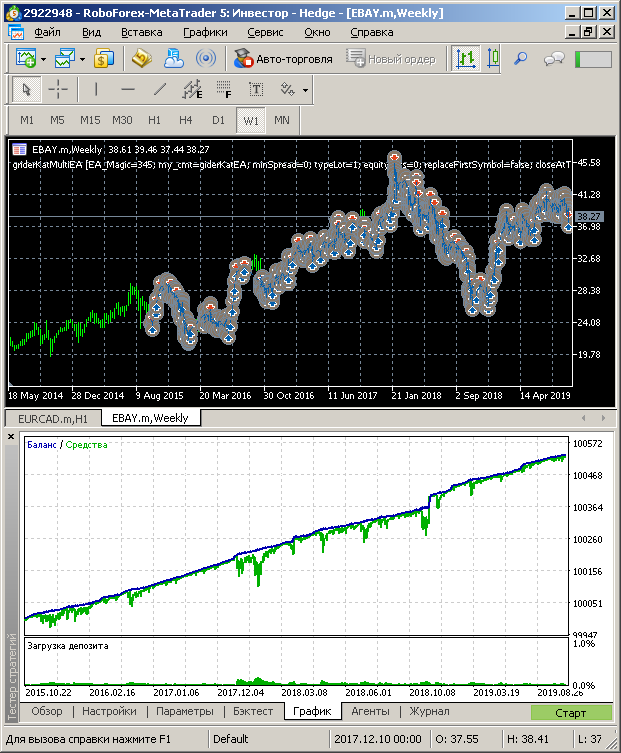
Initial tests were performed in advance, while screenshots were taken immediately before the article publication. That is why you can notice that the recently updated strategy tester refused to perform testing on MSFT and CSCO after May 2018. In earlier tests testing was executed successfully.
However, this is not very important. Let us have a look at price charts of EBAY, KO, MCD and VZ. They have substantial price corrections. However,
this did not affect the balance graph.
Of course, the deposit can be affected in case of deeper drawdowns. That is why it is recommended to withdraw profit from time to time. It is also desirable that you trade one instrument on one account. In this case, even if shares of one of the companies drop significantly or in the event of its bankruptcy, other instruments will not be affected. Even if the deposit is lost, profit of other instruments can cover it.
Diversification with infinite grids
Let us get back to the main purpose of our article. First of all, we are testing the possibilities of diversification.
In the first part of the article, we tested the effect of diversification in case of a small number of steps in a grid. In this case we do not have deep and long equity drawdowns, since drawdowns quickly end with stop loss. In this case the impact of symbols on each other is less, than if we keep drawdown. But the idea of this trading strategy is to withstand possible losses using a grid with an unlimited number of steps.
Diversification opportunities will be tested using 9 instruments simultaneously. The use of these instruments will be optimized. Some of the instruments may correlate strongly; in this case we can increase the general recovery factor by excluding such instruments.
Testing showed, that some of the instruments are worth excluding. But there are only 2 symbols out of 9: ORCL and CSCO. The difference between trading 9 symbols and 7 symbols is not very large, about 0.5 of the recovery factor. Nevertheless, there is difference. The following results are obtained by excluding these symbols:
| Symbols |
Recovery factor for 4 years / avg. for 1 year |
Max. drawdown, $ |
Trades |
|---|---|---|---|
| VZ, MCD, JPM, KO, MSFT, NKE, EBAY |
10.92 / 2.73 |
368 |
3 055 |
This result is quite unexpected for me. I thought stocks were moving in a more synchronous manner. I.e. if any of them experiences drawdown, many others will also have drawdowns. Remember December 2018, when almost all stocks fell. So, drawdowns can overlap and reduce the recovery factor. But in reality, the overall recovery factor is almost the same as that of the best of the tested symbols, MSFT. Risk in this case is lower than when trading one symbol.
Diversification — myth or reality
Is diversification a myth or a reality? Diversification is said to be good. But no one provides any evidence. By running our own experiments, we can see that diversification can be useful for the balance.
However, it should be understood that this is a special case. It means that you shouldn't thoughtlessly use diversification. The ideal solution is to backtest diversification using the symbols which you wish to trade. But, unfortunately, this is not always possible.
In any case, it is always better to open several deals with a small volume on different instruments than to enter a large volume on one
instrument.
Conclusion
We have closed a series of articles concerning grid trading Expert Advisors. Within this article, we have tested grid EAs of different
types. We have tested a small number of positions in a chain, an average number and infinite chains which are only limited by the deposit size.
Each of the variants has its advantages. For example, small chains are more suitable for diversification. A large number of steps allows
making a profit even with very strong unfavorable movements.
Of course, we have not considered all possible options for improving our EA performance.
For example, we could test an option of increasing the timeframe on which the EA trades upon reaching a certain number of open positions.
Trailing might also affect the EA trading.
Additional conditions for opening the first position could also be implemented. Though we used RSI, there are many other options.
As you can see, many more ideas can be implemented. I hope that the materials and ideas in this series were useful and interesting for you.
Translated from Russian by MetaQuotes Ltd.
Original article: https://www.mql5.com/ru/articles/7219
 MQL5 Cookbook: Trading strategy stress testing using custom symbols
 Strategy builder based on Merrill patterns
 Developing Pivot Mean Oscillator: a novel Indicator for the Cumulative Moving Average
- Free trading apps
- Over 8,000 signals for copying
- Economic news for exploring financial markets
You agree to website policy and terms of use