
Universal ZigZag

Contents
- Introduction
- Features of the ZigZag indicator
- Variants of plotting the Zigzag
- Simple ZigZag based on High/Low
- Simple ZigZag based on Close
- Starting to create the Universal ZigZag
- Class for source data
- Class for direction
- Class for plotting
- Merge the three classes
- Variant for the price chart
- Variant for price
- Calling from an expert
- Conclusion
- Attachments
Introduction
ZigZag (Fig. 1) is one of the most popular indicators among the MetaTrader 5 users. To date, a multitude of the ZigZag varieties has been developed. However, some of them are too slow, which makes them unsuitable for creating experts. Others constantly generate errors, which makes them difficult to use even for visual observation. For the indicators that operate fast and without errors, complications still arise when using them in development of an EA or another indicator. This happens because it is not so easy to extract and interpret the ZigZag data.
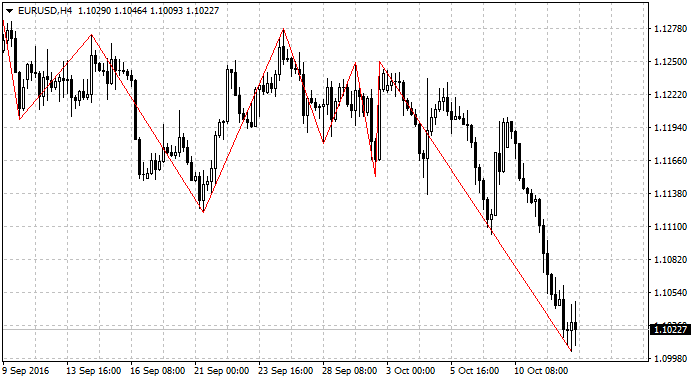
Fig. 1. The ZigZag indicator
This article will consider the requirements for plotting a ZigZag, as well as different methods for plotting it, draw conclusions and obtain a unified algorithm. This algorithm will be used as a basis for creating the universal indicator, which allows to select different ZigZag types via the properties window.
Object Oriented Programming will be used in development of the indicator. Multiple base classes for different stages of plotting the ZigZag will be created, multiple child classes will be created for each stage. Division into base and child classes will be carried out so as to make the creation of different new ZigZag variations as simple as possible.
Apart from plotting the ZigZag itself, the article will also focus on using the resulting indicator for developing other indicators and experts. The task at hand is to make sure that obtaining data from the ZigZag and using it as a part of other algorithms is not as complex and time-consuming.
Features of the ZigZag indicator
The ZigZag (Fig. 1) indicator is a polyline connecting the local price Highs and Lows. Beginners may immediately think: it would be great to buy at bottoms and sell on tops! This idea looks tempting, of course, but alas, the ZigZag looks so tempting in history only. In reality, the situation is somewhat different. It becomes clear that a new top or bottom had formed only several bars after it had actually been formed. Fig. 2 shows a situation when the last segment of the indicator stopped its formation (changing), price reversed and moved in the opposite direction (up).
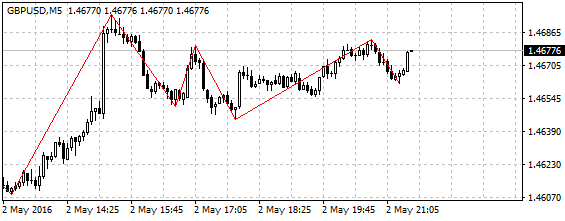
Fig. 2. ZigZag is directed downwards, but the price reversed upwards
However, several bars later the price falls (Fig. 3), and the last segment of the ZigZag continues stretching downwards.
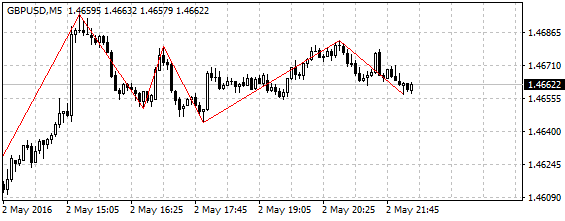
Fig. 3. The price continued to move down and the last ZigZag segment resumed its formation
This time the indicator has reached its minimum, but this can be confirmed only several bars later (Fig. 4).
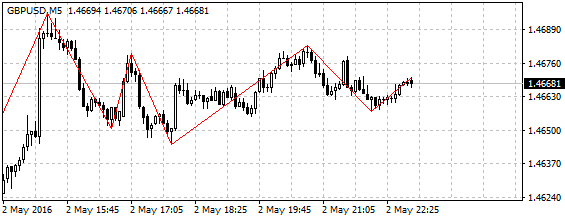
Fig. 4. It has taken ten bars for the ZigZag to draw a new upward segment and for the bottom formation to become known
These peculiarities of the ZigZag are best explained in the Fig. 5. The colored dots indicate the bars where a formation of previous top or bottom became known. The indicator had started plotting new upward segments on the bars with blue dots, and new downward segments on the bars with red dots.
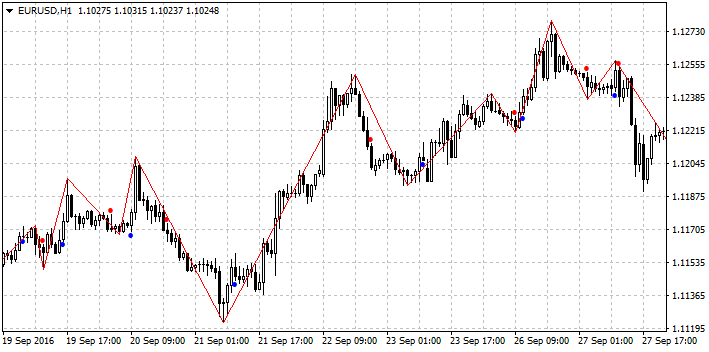
Fig. 5. The red and blue dots indicate the bars where a ZigZag reversal has become known
Despite this peculiarity, the ZigZag does lose its popularity and attractiveness. At the very least, it significantly facilitates the visual analysis of the charts, helps to filter out noise and detect the main trajectory of the price movement. In a more practical application, the indicator may be used for detecting the support/resistance levels or for identifying patterns. And it can be used as a basis for drawing trendlines, just like any other graphical tools for technical analysis, similar to Fibonacci levels, fan, etc. It is impossible to list everything that a sophisticated trader's mind may come up with for using the ZigZag.
Variants of plotting the Zigzag
It is obvious that the ZigZag has two states: it is either directed upwards or downwards. When the line is directed upwards — monitor the price in case a new High appears, and when the line points down — wait for a new Low to emerge. It is also necessary to monitor the fulfillment of conditions that indicate a change in direction. So, in order to plot a ZigZag, it is necessary to:
- Obtain the source data.
- Formulate the conditions for changing the direction of the line.
- Monitor the occurrence of new High and Lows.
The source data can be a single series (for example, Close price of the bar) or two series (for example, High and Low price of the bar). If one data series is used, then it can be not only the Close price, but virtually any indicator, be it oscillator or moving average. When plotting the ZigZag based on indicator data, it is also possible to use two data series: one with the indicator data based on the bar Highs and another based on Lows.
Conditions for change in direction is the most important point that defines the different types of ZigZags. These conditions can vary greatly. For example, such condition may be formation of a High/Low over n bars on the current bar. In other words, if the value of the source series on the current bar is maximum or minimum over the last n bars, then this defines the ZigZag direction. This principle is used in the classic ZigZag indicator. Another method — based on the size of a rollback from the fixed maximum or minimum value. The rollback size can be measured in points (if the source series if the price) or in conventional units (if it is some indicator). Available methods are not limited to those two, it is possible to determine the direction using any indicator — Stochastic, ADX, etc. If the Stochastic is above 50 then the ZigZag is pointing upwards, if it is below 50 — downwards. Now, determine the direction based on ADX: the ZigZag line is directed up if the PDI line is above the MDI line, and down it PDI is below MDI.
Thus, by combining different variants for point 1 and point 2, numerous varieties of the ZigZag can be obtained. After all, nothing prevents from using the RSI data for point 1 and determining direction based on Stochastic, and so on. Point 3 is only necessary for the indicator to look like a zigzag, although the plotting options can be very different.
Since the task here is to obtain a universal indicator, it is necessary to split the algorithm into two parts as carefully as possible: the part identical for all ZigZags (call it common) and the part that depends on the ZigZag type (call it individual). The individual part fills the indicator buffers with the source data: price or indicator data. Another buffer (determining the ZigZag line direction) is filled by 1 or -1 values. These three buffers are passed to the common part, which uses them to plot the indicator itself.
To make it clear, first create a separate indicator that operates based on the High/Low of the bar and that changes its direction based on the High/Low of the n-th bar.
Simple ZigZag based on High/Low
In the MetaEditor create a new indicator (Main Menu — File — New or press Ctrl+N). In the indicator creation Wizard, enter the name "iHighLowZigZag", create one external parameter "period" (int type, with value 12), select the OnCalculate(...,open,high,low,close) event handler, create one buffer with the name of "ZigZag" (Section type, with Red color) and three more buffers with the names "Direction", "LastHighBar" and "LastLowBar" (line type, with color - none).
The "ZigZag" buffer will be used for displaying the zigzag, the remaining buffers are auxiliary. For all auxiliary buffers, change the INDICATOR_DATA type to INDICATOR_CALCULATIONS in the call to the SetIndexBuffer() function inside the OnInit() function. At the top of the file, change the value of the indicator_plots property: set the value to 1. After that, the indicator will only draw a single "ZigZag" buffer, and the indicator will not draw any extra lines, but at the same time, the additional buffers will be available for handling by the iCustom() function.
First, the index of the bar to start the calculation ('start' variable) is determined in the OnCalculate() function, so that the calculation over all bars is performed only when the indicator starts, and so that the further calculations are performed only at each new bar. In addition, initialize the elements of the buffers:
if(prev_calculated==0)
{ // at startup
// initialize the buffer elements
DirectionBuffer[0]=0;
LastHighBarBuffer[0]=0;
LastLowBarBuffer[0]=0;
start=1; // calculation starting from the elements following the initialized ones
}
else
{ // during operation
start=prev_calculated-1;
}
}
Now, the main indicator cycle:
{
As described above, in order to achieve the universality, it is necessary to split the code into calculation of the ZigZag direction and its plotting. This principle will be upheld now as well. First write the code for determining the direction. To determine the direction, use the ArrayMaximum() and ArrayMinimum() functions. If a High or a Low is determined on the calculated bar, the element of the Direction array is assigned the value of 1 or -1. In order to have information about the current direction of the ZigZag on each bar, before calculating the direction, take the value from the previous element of the Direction buffer and assign it to the current element:
// direction from the previous element
DirectionBuffer[i]=DirectionBuffer[i-1];
// calculation of the initial bar for
// the ArrayMaximum() and ArrayMinimum() functions
int ps=i-period+1;
// determine High and Low bars in
// the range of 'period' bars
int hb=ArrayMaximum(high,ps,period);
int lb=ArrayMinimum(low,ps,period);
// if a High or Low is identified
if(hb==i && lb!=i)
{ // High identified
DirectionBuffer[i]=1;
}
else if(lb==i && hb!=i)
{ // Low identified
DirectionBuffer[i]=-1;
}
Note the last part of the code: it identifies the High or Low, checks if there is a High and no Low on the current bar at the same time, or the opposite: if there is a Low but no High. Sometimes there can be very long bars and both directions may be determined on them. In this case, the Direction buffer will contain the previously determined direction.
Generally speaking, within the MetaTrader 5 terminal, it is possible to create a ZigZag that draws vertical segments, which makes it possible to display two changes in the indicator direction on the same bar. However, such ZigZag types will not be considered in this article.
let us continue writing the code in the main loop: the following fragment will be responsible for drawing the ZigZag line. The two other buffers will be treated the same as the Direction buffer:
LastLowBarBuffer[i]=LastLowBarBuffer[i-1];
These two buffers will contain data on the indexes of the bars with latest High or Low of the ZigZag. In addition to the indexes of those bars being directly required for drawing the indicator, those buffers also significantly facilitate the process of calling the ZigZag from an expert. There will be no need to iterate over the bars in a loop in search of the latest top.
Make sure to clear the ZigZag buffer:
This must be done because the full calculation of the indicator is performed not only when it starts, but also during some other events, for example, when history is downloaded. The buffer may have old data remaining, which would distort the appearance of the indicator line.
Now, let us proceed to drawing. Here, the algorithm is split into four branches: beginning of a new upward movement, beginning of a new downward movement, continuation of an upward movement, continuation of a downward movement. To check the direction values, the switch operators are used on the calculated and previous bar:
{
case 1:
switch((int)DirectionBuffer[i-1])
{
case 1:
// continuation of an upward movement
...
break;
case -1:
// beginning of a new upward movement
...
break;
}
break;
case -1:
switch((int)DirectionBuffer[i-1])
{
case -1:
// continuation of a downward movement
...
break;
case 1:
// beginning of a new downward movement
...
break;
}
break;
It remains to write the four code blocks. Two of them will be considered in details: beginning of a new upward movement and continuation of the upward movement. Beginning of a new upward movement takes place when the value in Direction buffer changes from -1 to 1. When that happens, the algorithm draws a new point of the ZigZag and stores the index of the bar, where the new direction has begun:
LastHighBarBuffer[i]=i;
Continuation of a movement is a little more complicated. The algorithm checks if the value on the current bar greater than the previously known High value of the ZigZag. If it is greater, then it is necessary to move the end of the last segment, that is, remove the previously drawn point and place a new one. Here, the algorithm also stores the information on the bar, where the new point has been drawn:
if(high[i]>high[(int)LastHighBarBuffer[i]])
{ // new High
// remove the old ZigZag point
ZigZagBuffer[(int)LastHighBarBuffer[i]]=EMPTY_VALUE;
// place a new point
ZigZagBuffer[i]=high[i];
// index of the bar with the new top
LastHighBarBuffer[i]=i;
}
This is it. Do not forget to close the loop with a closing brace. It remains to test the indicator in the strategy tester's visual mode. The fully operational "iHighLowZigZag" indicator can be found in the attachment.
Simple ZigZag based on Close
Now let us revise the newly created indicator to work based on the Close price. There is no need to start from scratch: save the "iHighLowZigZag" indicator under the name "iCloseZigZag" and replace the calls to the 'high' and 'low' arrays with the call to the 'close' array. This would seemingly complete the work, but testing shows the incorrect operation of the indicator (Fig. 6).
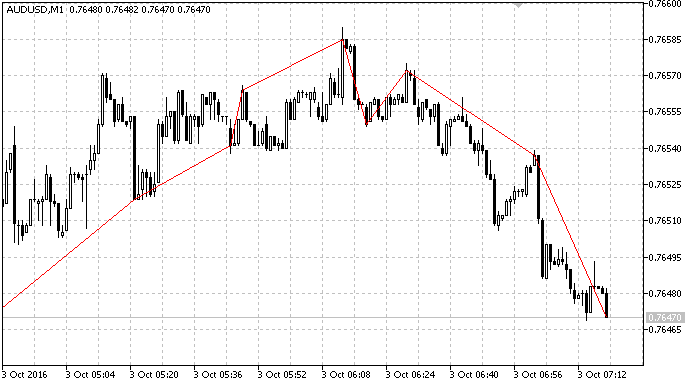
Fig. 6. Incorrect operation of the ZigZag based on 'close', converted from the indicator based on High/Low
Let us see why this happens. If the High price of the current bar formed a top within a certain range of bars, then this bar will remain the top, no matter how the bar Close price changes. If the top was formed by the Close price, then the Close price may change during the formation of the bar, and the High will cease to exist. When determining a new High/Low in the same direction, the condition for deleting the old point is also met — this is where the problem awaits. The new High was canceled, the new point was deleted, but the old one was deleted as well. So, it is necessary to restore the position of the old point. The information on the position of the latest extremums is contained in the buffers: LastHighBarBuffer and LastLowBarBuffer. The two latest points will be restored from them. Add two lines of code into the main loop of the indicator before the switch operator:
ZigZagBuffer[(int)LastLowBarBuffer[i]]=close[(int)LastLowBarBuffer[i]];
After this revision the indicator should work properly. The resulting "iCloseZigZag" indicator can be found in the article attachments.
Starting to create the Universal ZigZag
Universality of the ZigZag will be achieved by separately solving three tasks:- Filling the buffer with the source data. Two buffers will be used. They are needed so that they can be filled with the High and Low prices. In order to obtain a ZigZag based on Close or any other indicator, both buffers must be filled with the same values.
- Filling the Direction buffer based on the analysis of the source data.
- Plotting the ZigZag.
Class for source data
Create the "CSorceData.mqh" include file, add the CSorceData class to it. It will be the parent class. It will contain one virtual 'Calculate' method similar to the OnCalculate() function of the indicator, but with certain changes. Two additional arrays are passed to the method: BufferHigh[] and BufferLow[]. These buffers are filled with data that will be further used for calculating the ZigZag. Since not only the price, but also the values of any other indicator may serve as the source data, it is necessary to control the indicator loading process. To do that, add the CheckHandle() (type bool) virtual method:
{
private:
public:
virtual int Calculate(const int rates_total,
const int prev_calculated,
const datetime &time[],
const double &open[],
const double &high[],
const double &low[],
const double &close[],
const long &tick_volume[],
const long &volume[],
const int &spread[],
double &BufferHigh[],
double &BufferLow[])
{
return(0);
}
virtual bool CheckHandle()
{
return(true);
}
};
Now create multiple child classes. One for the high/low price:
{
private:
public:
int Calculate(const int rates_total,
const int prev_calculated,
const datetime &time[],
const double &open[],
const double &high[],
const double &low[],
const double &close[],
const long &tick_volume[],
const long &volume[],
const int &spread[],
double &BufferHigh[],
double &BufferLow[])
{
int start=0;
if(prev_calculated!=0)
{
start=prev_calculated-1;
}
for(int i=start;i<rates_total;i++)
{
BufferHigh[i]=high[i];
BufferLow[i]=low[i];
}
return(rates_total);
}
};
Another one for the Close price. It will differ only in the code inside the loop:
{
BufferHigh[i]=close[i];
BufferLow[i]=close[i];
}
The name of this class is "CClose:public CSorceData". The CheckHandle() method is not used so far.
We will also create a couple of classes for obtaining data from indicators. Let us select indicators with different number of parameters and different location (on the price chart or in separate subwindow) — RSI and moving average. Let us write our classes for them.
Create a class for RSI, name it "CRSI:public CSorceData". Add a variable for the indicator handle to the private section:
int m_handle;
Add the constructor: the RSI parameters will be passed to it, and the indicator will be loaded within it:
{
m_handle=iRSI(Symbol(),Period(),period,price);
}
Now, the CheckHandle() method:
{
return(m_handle!=INVALID_HANDLE);
}
The Calculate method will not use a cycle, but a simple copying of buffers:
if(prev_calculated==0)
{
to_copy=rates_total;
}
else
{
to_copy=rates_total-prev_calculated;
to_copy++;
}
if(CopyBuffer(m_handle,0,0,to_copy,BufferHigh)<=0)
{
return(0);
}
if(CopyBuffer(m_handle,0,0,to_copy,BufferLow)<=0)
{
return(0);
}
return(rates_total);
Please note: in case of failed copy (call to the CopyBuffer() function) the method returns 0, and in case of a successful copy — rates_total. This is done to allow subsequent recalculation of the indicator in case of a failed copy.
Similarly, create a class named "CMA:public CSorceData" for the moving average. The differences are only in the constructor:
{
m_handle=iMA(Symbol(),Period(),period,shift,method,price);
}
In this case, the Calculate() methods turned out to be completely identical, but other indicators may have certain differences, in particular, with the numbers of buffers. The fully operational "CSorceData.mqh" file can be found in the attachment. Although, it should be noted that it can be regarded as fully operational only tentatively, as it implies further expansion through addition of new child methods for other indicators.
Class for direction
The class will be located in the "CZZDirection.mqh" file, name of the base class — "CZZDirection". The class will contain a virtual Calculate() method. It will be passed the parameters that allow to determine the bars for calculation (rates_total, prev_calculated variables), buffers with the source data and buffer for direction. As mentioned before, the ZigZag direction can be determined using an indicator, so the ability to use indicators will also be added. Add the virtual CheckHandle() method:
{
private:
public:
virtual int Calculate(const int rates_total,
const int prev_calculated,
double &BufferHigh[],
double &BufferLow[],
double &BufferDirection[])
{
return(0);
}
virtual bool CheckHandle()
{
return(true);
}
};
Now let us write a child class for determining the direction, as in the "iHighLowZigZag" indicator. Determining the direction using this method will require the "period" parameter. Therefore, the m_period and constructor with the period parameter will be added to the private section:
{
private:
int m_period;
public:
void CNBars(int period)
{
m_period=period;
}
int Calculate(const int rates_total,
const int prev_calculated,
double &BufferHigh[],
double &BufferLow[],
double &BufferDirection[]
)
{
int start;
if(prev_calculated==0)
{
BufferDirection[0]=0;
start=1;
}
else
{
start=prev_calculated-1;
}
for(int i=start;i<rates_total;i++)
{
BufferDirection[i]=BufferDirection[i-1];
int ps=i-m_period+1;
int hb=ArrayMaximum(BufferHigh,ps,m_period);
int lb=ArrayMinimum(BufferLow,ps,m_period);
if(hb==i && lb!=i)
{ // High identified
BufferDirection[i]=1;
}
else if(lb==i && hb!=i)
{ // Low identified
BufferDirection[i]=-1;
}
}
return(rates_total);
}
Another child class will be created to determine the direction based on the CCI indicator. Position of the CCI above the zero will correspond to the upward direction of the ZigZag, below the zero — downward direction:
{
private:
int m_handle;
public:
void CCCIDir(int period,ENUM_APPLIED_PRICE price)
{
m_handle=iCCI(Symbol(),Period(),period,price);
}
bool CheckHandle()
{
return(m_handle!=INVALID_HANDLE);
}
int Calculate(const int rates_total,
const int prev_calculated,
double &BufferHigh[],
double &BufferLow[],
double &BufferDirection[]
)
{
int start;
if(prev_calculated==0)
{
BufferDirection[0]=0;
start=1;
}
else
{
start=prev_calculated-1;
}
for(int i=start;i<rates_total;i++)
{
BufferDirection[i]=BufferDirection[i-1];
double buf[1];
if(CopyBuffer(m_handle,0,rates_total-i-1,1,buf)<=0)return(0);
if(buf[0]>0)
{
BufferDirection[i]=1;
}
else if(buf[0]<0)
{
BufferDirection[i]=-1;
}
}
return(rates_total);
}
};
The CCI parameters are passed to the constructor of the class, and then it is loaded. The CheckHandle() method is used, which must be called after creating the object. The main loop checks the CCI and fills the BufferDirection buffer.
The "CZZDirection.mqh" file can be found in the attachments.
Class for plotting
There are various options for plotting the ZigZag. It can be drawn with a single line, it can be colored, it can have dots at its peaks, etc. In this article, we will consider only one plotting method, but also create the base and child classes in case of a future development. The class will be located in the "CZZDraw.mqh" file, name of the class — "CZZDraw". The class will contain one virtual Calculate() method with the same parameters as the class for direction. In addition, it will be passed three arrays from the ZigZag: BufferLastHighBar (for index of the latest High), BufferLastLowBar (for index of the latest Low), BufferZigZag (the ZigZag itself).
{
private:
public:
virtual int Calculate(const int rates_total,
const int prev_calculated,
double &BufferHigh[],
double &BufferLow[],
double &BufferDirection[],
double &BufferLastHighBar[],
double &BufferLastLowBar[],
double &BufferZigZag[]
)
{
return(0);
}
};
{
private:
public:
virtual int Calculate(const int rates_total,
const int prev_calculated,
double &BufferHigh[],
double &BufferLow[],
double &BufferDirection[],
double &BufferLastHighBar[],
double &BufferLastLowBar[],
double &BufferZigZag[]
)
{
int start;
if(prev_calculated==0)
{
BufferLastHighBar[0]=0;
BufferLastLowBar[0]=0;
start=1;
}
else
{
start=prev_calculated-1;
}
for(int i=start;i<rates_total;i++)
{
BufferLastHighBar[i]=BufferLastHighBar[i-1];
BufferLastLowBar[i]=BufferLastLowBar[i-1];
BufferZigZag[i]=EMPTY_VALUE;
BufferZigZag[(int)BufferLastHighBar[i]]=BufferHigh[(int)BufferLastHighBar[i]];
BufferZigZag[(int)BufferLastLowBar[i]]=BufferLow[(int)BufferLastLowBar[i]];
switch((int)BufferDirection[i])
{
case 1:
switch((int)BufferDirection[i-1])
{
case 1:
if(BufferHigh[i]>BufferHigh[(int)BufferLastHighBar[i]])
{
BufferZigZag[(int)BufferLastHighBar[i]]=EMPTY_VALUE;
BufferZigZag[i]=BufferHigh[i];
BufferLastHighBar[i]=i;
}
break;
case -1:
BufferZigZag[i]=BufferHigh[i];
BufferLastHighBar[i]=i;
break;
}
break;
case -1:
switch((int)BufferDirection[i-1])
{
case -1:
if(BufferLow[i]<BufferLow[(int)BufferLastLowBar[i]])
{
BufferZigZag[(int)BufferLastLowBar[i]]=EMPTY_VALUE;
BufferZigZag[i]=BufferLow[i];
BufferLastLowBar[i]=i;
}
break;
case 1:
BufferZigZag[i]=BufferLow[i];
BufferLastLowBar[i]=i;
break;
}
break;
}
}
return(rates_total);
}
};
Merge the three classes
Finally, it is necessary to write an indicator using the three classes created above. The class for source data provides the ability to use the price data and data of the RSI indicator, which usually works in a subwindow. The price data can be displayed in a subwindow, but the RSI cannot be displayed on the price chart. So, we will create an indicator for the subwindow.
In the MetaEditor create a new indicator (Main Menu — File — New or press Ctrl+N). In the indicator creation Wizard, enter the name "iUniZigZagSW", create one external parameter "period" (int type, with value 12), select the OnCalculate(...,open,high,low,close) event handler, create the following buffers:
After creating the new indicator, include three files with classes: Name Style Color High Line Green Low Line Green ZigZag Section Red Direction Line none LastHighBar Line none LastLowBar Line none
#include <CZZDirection.mqh>
#include <CZZDraw.mqh>
The indicator should have parameters for selecting the type of the source data and type of determining the direction. Create two enumerations for this purpose:
{
Src_HighLow=0,
Src_Close=1,
Src_RSI=2,
Src_MA=3
};
enum EDirection
{
Dir_NBars=0,
Dir_CCI=1
};
Create two external parameters for these types:
input EDirection DirSelect=Dir_NBars;
The corresponding parameters are required for the RSI and MA source data, as well as for the CCI indicator. Add them:
input ENUM_APPLIED_PRICE RSIPrice = PRICE_CLOSE;
input int MAPeriod = 14;
input int MAShift = 0;
input ENUM_MA_METHOD MAMethod = MODE_SMA;
input ENUM_APPLIED_PRICE MAPrice = PRICE_CLOSE;
input int CCIPeriod = 14;
input ENUM_APPLIED_PRICE CCIPrice = PRICE_TYPICAL;
Additional parameter for determining the direction over n-bars is also needed:
Now something more interesting — three pointers in accordance with the types of the base class (below the external parameters):
CZZDirection * dir;
CZZDraw * zz;
Load the corresponding child classes in the OnInit function, in accordance with the SrcSelect and DirSelect variables. First, the SrcSelect:
{
case Src_HighLow:
src=new CHighLow();
break;
case Src_Close:
src=new CClose();
break;
case Src_RSI:
src=new CRSI(RSIPeriod,RSIPrice);
break;
case Src_MA:
src=new CMA(MAPeriod,MAShift,MAMethod,MAPrice);
break;
}
After loading, check the handle:
{
Alert("Error loading the indicator");
return(INIT_FAILED);
}
After that, the DirSelect:
{
case Dir_NBars:
dir=new CNBars(ZZPeriod);
break;
case Dir_CCI:
dir=new CCCIDir(CCIPeriod,CCIPrice);
break;
}
Checking the handle:
{
Alert("Error loading the indicator 2");
return(INIT_FAILED);
}
Third class:
Delete the objects in the OnDeinit() function:
{
if(CheckPointer(src)==POINTER_DYNAMIC)
{
delete(src);
}
if(CheckPointer(dir)==POINTER_DYNAMIC)
{
delete(dir);
}
if(CheckPointer(zz)==POINTER_DYNAMIC)
{
delete(zz);
}
}
And now, the final touch — the OnCalculate() function. The Calculate() methods of the CSorceData and CZZDirection classes may return 0, therefore check the result. In case of an error (received the value 0), also return 0, so that a full recalculation takes place on the next tick:
rv=src.Calculate(rates_total,
prev_calculated,
time,
open,
high,
low,
close,
tick_volume,
volume,
spread,
HighBuffer,
LowBuffer);
if(rv==0)return(0);
rv=dir.Calculate(rates_total,
prev_calculated,
HighBuffer,
LowBuffer,
DirectionBuffer);
if(rv==0)return(0);
zz.Calculate(rates_total,
prev_calculated,
HighBuffer,
LowBuffer,
DirectionBuffer,
LastHighBarBuffer,
LastLowBarBuffer,
ZigZagBuffer);
return(rates_total);
The "iUniZigZagSW" indicator can be found in the attachments.
Variant for the price chart
The resulting indicator contains all previously created variants, both with the source data corresponding to the price chart, and for the subwindow, so it was created for the subwindow. However, it would be nice to see the ZigZag on the price chart too. In this case, it is necessary to sacrifice the RSI data source. Make a copy of the indicator named "iUniZigZag", change the indicator_separate_window property to indicator_chart_window, remove the Src_RSI variant from the ESorce enumeration, remove the RSI variant from the OnInit() function and obtain the variant for the price chart. The completed "iUniZigZag" indicator can be found in the attachments.
Variant for price
It is possible to create indicators for the MetaTrader terminal, which works based not on strictly defined source data, but on any other indicator located on the chart. When attaching such indicator to the chart or subwindow, set the "Apply to" parameter to "Previous indicator's data" or to "First indicator's data". Let us modify the "iUniZigZagSW" indicator, so that it could be "put" on another indicator. Save the indicator under the name "iUniZigZagPriceSW" and delete everything related to the CSorceData class, change the type of the OnCalculate function, and at the start of the function, write a loop for populating the HighBuffer and LowBuffer buffers with the values of the price array:
const int prev_calculated,
const int begin,
const double &price[]
)
{
int start;
if(prev_calculated==0)
{
start=0;
}
else
{
start=prev_calculated-1;
}
for(int i=start;i<rates_total;i++)
{
HighBuffer[i]=price[i];
LowBuffer[i]=price[i];
}
int rv;
rv=dir.Calculate(rates_total,
prev_calculated,
HighBuffer,
LowBuffer,
DirectionBuffer);
if(rv==0)return(0);
zz.Calculate(rates_total,
prev_calculated,
HighBuffer,
LowBuffer,
DirectionBuffer,
LastHighBarBuffer,
LastLowBarBuffer,
ZigZagBuffer);
return(rates_total);
}
Similarly, it is possible to create a variant the works on the price chart based on the price array. To do this, it is enough to change the indicator_separate_window property to indicator_chart_window in the "iUniZigZagPriceSW" indicator. The "iUniZigZagPriceSW" indicator can be found in the attachment. The iUniZigZagPrice indicator can also be found there, it is the variant for the price chart based on price array.
Calling from an expert
Normally, when calling the ZigZag from an expert, it searches for the last top or bottom in a cycle, iterates over the bars and checks the values in the buffer for plotting the ZigZag. All this together is very slow. The ZigZag developed in this article has additional buffers, which allow to quickly obtain all the required data. The DirectionBuffer buffer contains data on the direction of ZigZag's last segment. The LastHighBarBuffer and LastLowBarBuffer buffers contain the indexes of the bars, where the latest top and bottom had been registered. Knowing the index of the bar when counting from one side and the number of the bars, it is possible to calculate the index of the bar for counting from the other side (the indicator is counting from left to right, and the CopyBuffer () function is counting from right to left). With the index of the bar, it is possible to get the value of the ZigZag on this bar.
The following code can be used to obtain the data from the indicator. Let us experiment with the "iUniZigZagSW" indicator. Load the indicator in the OnInit() function:
DirSelect,
RSIPeriod,
RSIPrice,
MAPeriod,
MAShift,
MAMethod,
MAPrice,
CCIPeriod,
CCIPrice,
ZZPeriod);
// direction
double dir[1];
if(CopyBuffer(handle,3,0,1,dir)<=0)
{
Print("Error obtaining data from the ZigZag");
return;
}
if(dir[0]==1)
{
cs=cs+"Direction Up";
}
if(dir[0]==-1)
{
cs=cs+"Direction Down";
}
Comment(cs,"\n",GetTickCount());
Now get the values of several latest tops/bottoms. If the indicator line is directed upwards, we get the index of the bar with the latest top from the LastHighBarBuffer buffer. Then use it to calculate the index of the bar when counting from right to left. This index can be used to obtain the value of the ZigZagBuffer buffer. We can go further: get the value from the LastLowBarBuffer buffer for the bar, where the ZigZag value had been obtained. This will the index of the bar with the previous bottom. And so on, alternating calls to the LastHighBarBuffer and LastLowBarBuffer buffers allows to collect data on all tops/bottoms of the indicator line. Below is the example of the code for getting two latest points of the ZigZag when it was directed upwards:
{
// index of the bar with the latest top when counting to the left of zero
if(CopyBuffer(handle,4,0,1,lhb)<=0)
{
Print("Error obtaining data from the ZigZag 2");
return;
}
// index of the bar when counting to the right of zero
ind=bars-(int)lhb[0]-1;
// value of the ZigZag at the ind bar
if(CopyBuffer(handle,2,ind,1,zz)<=0)
{
Print("Error obtaining data from the ZigZag 3");
return;
}
//===
// index of the bottom preceding this top
if(CopyBuffer(handle,5,ind,1,llb)<=0)
{
Print("Error obtaining data from the ZigZag 4");
return;
}
// index of the bar when counting to the right of zero
ind=bars-(int)llb[0]-1;
// value of the ZigZag at the ind bar
if(CopyBuffer(handle,2,ind,1,zz1)<=0)
{
Print("Error obtaining data from the ZigZag 5");
return;
}
cs=cs+"\n"+(string)zz1[0]+" "+(string)zz[0];
}
else if(dir[0]==-1)
{
}
The full example can be found in the attached "eUniZigZagSW" expert. The EA outputs a chart comment with the message about the ZigZag direction, as well as two numbers with the values of two latest ZigZag points on second line (Fig. 7). The third line is simply the number returned by the GetTickCount() function, to make it clear that the expert works.
Fig. 7. The top left corner contains messages output by the expert
Of course, data on the latest points of the indicator can be obtained from the LastHighBarBuffer and LastLowBarBuffer buffers by taking their values at the zeroth or the first bar, but the point of this example is to consecutively extract data from any number of ZigZag points.
Calling from another indicator
If one indicator needs to made on the basis of another, in case of the ZigZag, it is easier not to call the indicator using iCustom(), but to make its copy and modify it. This approach may be justified in some cases (in terms of modification speed and simplicity), in some - not (in terms of code reuse and flexibility). The indicators created in this article can be accessed via the iCustom function when developing other indicators.
In itself, the ZigZag on history is no longer what actually happened during the formation of that history. However, there are the LastHighBarBuffer and LastLowBarBuffer buffers, which store the data on the intermediate states of the Zigzag. For clarity, let us create an indicator that draws arrows when the indicator line changes direction (changes in the value of the DirectionBuffer buffer) and which places dots on the bars where the new High/Lows of the ZigZag had been registered (changes in the values of the LastHighBarBuffer and LastLowBarBuffer buffers). The code of this indicator will not be discussed in details, it can be found under the name of "iUniZigZagSWEvents" in the attachments. The indicator appearance is shown in the Fig. 8.
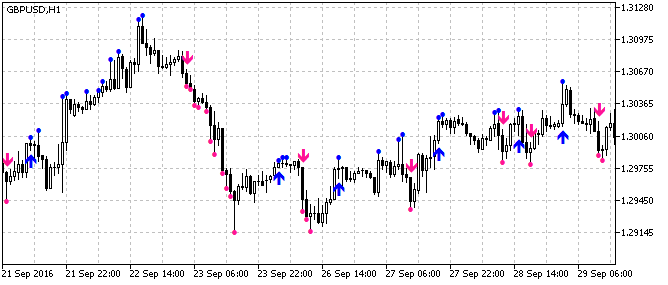
Fig. 8. The iUniZigZagSWEvents indicator
Conclusion
As the article is after all an instructional material and does not provide ready-made and complete solutions, all indicators created in the article have a bare minimum of selection for the source data and types for determining the direction. However, the process of creating indicators is described in great detail, so after understanding the article you will be able to create all the required child classes yourselves. In additions, attempts to get a fully universal indicator arouse difficulties, not so much during the creation stage, as during its further usage. When adding various indicators as the data sources or for determining the direction, it is necessary to add the parameters for those indicators to the properties window. In the end, the number of parameters becomes too large and using such indicator will be very inconvenient. It would be more ergonomic to create separate indicators using the universal classes obtained in the article.
Attachments
- iHighLowZigZag.mq5 — Simple ZigZag based on High/Low.
- iCloseZigZag.mq5 — Simple ZigZag based on Close.
- CSorceData.mqh — Class for selecting the source data.
- CZZDirection.mqh — Class for determining the ZigZag direction.
- CZZDraw.mqh — Class for plotting the ZigZag.
- iUniZigZagSW.mq5 — Universal ZigZag for subwindow.
- iUniZigZag.mq5 — Universal ZigZag for the price chart.
- iUniZigZagPriceSW.mq5 — Universal ZigZag based on price array for the subwindow.
- iUniZigZagPrice.mq5 — Universal ZigZag based on price array for the price chart.
- eUniZigZagSW — example of calling the "iUniZigZagSW" indicator from an expert using the iCustom() function.
- iUniZigZagSWEvents — example of creating another indicator with the call to the "iUniZigZagSW" indicator using the iCustom() function.
Translated from Russian by MetaQuotes Ltd.
Original article: https://www.mql5.com/ru/articles/2774
 Universal Oscillator with a GUI
 Graphical Interfaces X: Text Edit box, Picture Slider and simple controls (build 5)
 80-20 trading strategy
- Free trading apps
- Over 8,000 signals for copying
- Economic news for exploring financial markets
You agree to website policy and terms of use