
LifeHack for trader: "Quiet" optimization or Plotting trade distributions

Table of Contents
- What are distribution charts for?
- Quick start
- 1. Reconstruction of positions from trade history
- 1.1. Position reversal
- 1.2. Calculation of position profit
- 1.3. Position opening time
- 1.4. Intermediate storage of the reconstructed positions
- 2. Google Charts
- 2.1. Histogram ('bar' type)
- 2.2. Pie chart ('corechart' type)
- 2.3. Histogram ('bar' type) + pie chart ('corechart' type) + histogram ('bar' type)
- 3. Running analytics charts from the terminal (for the current trading account)
- 4. Running analytics charts from the strategy tester
- This is the "quiet" optimization without a fuss
- Changes
What are distribution charts for?
During the development of a new trading strategy, there is no knowing of how successful it turns out. A trading robot almost always contains input parameters, underlying the rules that will be used in generation of signals for the market entry. In that case, after writing the trading robot, it remains to simply rely on the strategy tester to find such combinations of input parameters, which would show good backtesting results.
However, this article offers a slightly different look at the process of creating a trading robot. Before running the optimization of input parameters, you can simply look at the distribution of profits and losses depending on the time of entry. After all, many strategies have "favorable" and "unfavorable" moments for entering the market. This article considers plotting distribution charts of position profitability (please note, not deals, but the exactly positions!) depending on their opening times. After studying these charts, it will be possible to look at the strategy from a slightly different point of view.
The charts are plotted by calling the Google Charts. And for their visual representation, the HTML has been selected. Schematically, the distribution charts are displayed on the page as a table:
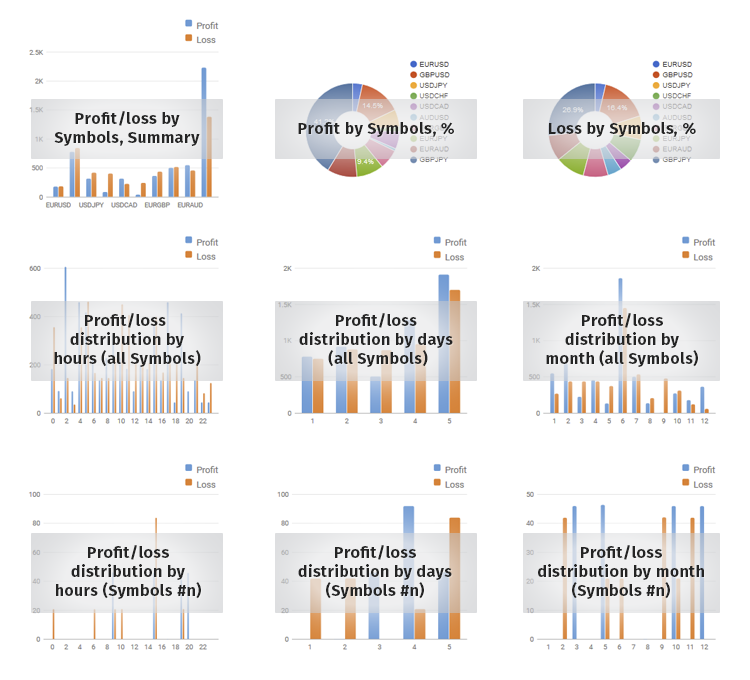
Fig. 1. The appearance of the HTML report
The first two rows are the summary statistics for the entire trading account, the subsequent rows represent the statistics for each symbol in terms of entries by hours, days and months.
Quick start
The "DistributionOfProfits.mqh" file should be placed in the data catalog, in the ...\MQL5\Include\ folder. The "test_report.mq5" script makes a call to plot the charts of analytics stating from the specified "start" date:
//+------------------------------------------------------------------+
//|                                                  test_report.mq5 |
//|                        Copyright 2016, MetaQuotes Software Corp. |
//|                                             https://www.mql5.com |
//+------------------------------------------------------------------+
#property copyright "Copyright 2016, MetaQuotes Software Corp."
#property link      "https://www.mql5.com"
#property version   "1.00"
#property script_show_inputs
//---
input datetime start=D'2010.05.11 12:05:00';
#include <DistributionOfProfits.mqh>
//---
CDistributionOfProfits Analysis;
//+------------------------------------------------------------------+
//| Script program start function                                    |
//+------------------------------------------------------------------+
void OnStart()
  {
//---
   Analysis.AnalysisTradingHistory(start);
   Analysis.ShowDistributionOfProfits();
  }
//+------------------------------------------------------------------+
1. Reconstruction of positions from trade history
What is position reconstruction for? The fact is that this is the only way to know such important parameters of a position, as profit and its opening time. Define the terms:
position profit — the total profit of all deals in a given position;
position opening time — opening time of the first order in this position.
The terminal contains the trade history as history of orders and deals. But what we need is the history of positions. For this, turn to the trade history and focus on the DEAL_POSITION_ID property of a deal and the ORDER_POSITION_ID property of an order. The reason for selecting these properties is the following. In fact, each position has a unique identifier (POSITION_IDENTIFIER), which is specified in each order (ORDER_POSITION_ID) and deal (DEAL_POSITION_ID) that opened, modified or closed the position:

Fig. 2. Connection of POSITION_IDENTIFIER, DEAL_POSITION_ID and ORDER_POSITION_ID
In other words, if the deals with the same DEAL_POSITION_ID are separated from the trade history, the reconstruction of a position can be guaranteed. A situation with position reversal is worth mentioning here. From the documentation on position identifier:
Position reversal changes position's identifier to the ticket of the order that led to the reversal.
This means that if the position changes its identifier after a reversal, it will be a different position. How is identifier assigned to deals in this case? Will the deal, which caused the reversal, belong to the previous or the reversed (new) position? To answer this question a simple example — the position_reversal_v1.mq5 script has been written.
This script performs three trade actions:
- buy 0.01 — open position
- sell 0.02 — reverse position
- close position
The start time should be specified in the input parameters of the script. This parameter will be used to request the trade history. In this example: the script was run on 2016.09.05 at 10:32:59, the input parameter had a small gap with the D'2016.09.05 10:32:00' value selected.
After each action, the script prints the position and its identifier, as well as the deals history and DEAL_POSITION_ID of the deal. Here is the print:
10:32:59.487    position_reversal_v1 (EURUSD,M3)    Buy 0.01, "EURUSD"
10:33:00.156    position_reversal_v1 (EURUSD,M3)    Position EURUSD POSITION_IDENTIFIER #96633525
10:33:00.156    position_reversal_v1 (EURUSD,M3)    Deal EURUSD volume 0.01 DEAL_POSITION_ID #96633525 profit 0.00
10:33:00.156    position_reversal_v1 (EURUSD,M3)
10:33:06.187    position_reversal_v1 (EURUSD,M3)    Sell 0.02, "EURUSD"
10:33:06.871    position_reversal_v1 (EURUSD,M3)    Position EURUSD POSITION_IDENTIFIER #96633564
10:33:06.871    position_reversal_v1 (EURUSD,M3)    Deal EURUSD volume 0.01 DEAL_POSITION_ID #96633525 profit 0.00
10:33:06.871    position_reversal_v1 (EURUSD,M3)    Deal EURUSD volume 0.02 DEAL_POSITION_ID #96633525 profit -0.06
10:33:06.871    position_reversal_v1 (EURUSD,M3)
10:33:12.924    position_reversal_v1 (EURUSD,M3)    PositionClose, "EURUSD"
10:33:13.593    position_reversal_v1 (EURUSD,M3)    Deal EURUSD volume 0.01 DEAL_POSITION_ID #96633525 profit 0.00
10:33:13.593    position_reversal_v1 (EURUSD,M3)    Deal EURUSD volume 0.02 DEAL_POSITION_ID #96633525 profit -0.06
10:33:13.593    position_reversal_v1 (EURUSD,M3)    Deal EURUSD volume 0.01 DEAL_POSITION_ID #96633564 profit -0.10
10:33:13.593    position_reversal_v1 (EURUSD,M3)
The first trade operation — buy 0.01. Its POSITION_IDENTIFIER is equal to 96633525. Also, the trading history contains a deal — it was assigned the DEAL_POSITION_ID of 96633525. For this deal, the DEAL_POSITION_ID matches the POSITION_IDENTIFIER of the position, which means that the deal belongs to the position.
The second operation — sell 0.02. This operation caused the position to reverse: there was a position 'buy 0.01', then script performed 'sell 0.02', which resulted in position 'sell 0.01'. The POSITION_IDENTIFIER of the current position was changed and became 96633564. This means a new position was obtained. And what goes on in the history of deals at that time? The trade history now contains two deals, both with the same DEAL_POSITION_ID, equal to 96633525. At the same time, the second deal has "profit -0.06".
So, the deal that led to the position reversal belongs to the previous position.
The third trade operation — buy 0.01. At this stage, the position is no longer present (as it has been closed), and the trade history contains three deals: the first and second have the same DEAL_POSITION_ID equal to 96633525, but this identifier has been changed to "96633564" in the third deal, and with the added "profit -0.10". That is, the third deal belongs to the second position, resulting from the reversal of the first.
1.2. Calculation of position profit
Based on the information proven in the section 1.1., it is possible to accurately determine the algorithm of profit calculation for each reconstructed position. The total financial result of all deals with the same DEAL_POSITION_ID will be the calculated profit of the position, which has the POSITION_IDENTIFIER equal to the DEAL_POSITION_ID. But as the only relevant trade operations are buy and sell, it is necessary to introduce a restriction on the deal type. Only the following deals from the ENUM_DEAL_TYPE enumeration are to be picked:
ENUM_DEAL_TYPE
ID | Description |
DEAL_TYPE_BUY | Buy |
DEAL_TYPE_SELL | Sell |
The first script was slightly changed and saved under the name of position_reversal_v2.mq5. The position_reversal_v2.mq5 script still includes three trading blocks — buy 0.01, sell 0.02 position closure. The novelty in this script is the PrintProfitPositions() function: it calculates the profit for reconstructed positions. Let us examine this function in more details:
//+------------------------------------------------------------------+
//| Print ptofit positions                                           |
//+------------------------------------------------------------------+
void PrintProfitPositions(void)
  {
//--- structure profit positions;
   struct struct_positions
     {
      long              position_id;
      double            position_profit;
      //--- constructor
                        struct_positions() {position_id=0; position_profit=0.0;}
     };
   struct_positions arr_struct_positions[];
//--- request trade history
   HistorySelect(start,TimeCurrent());
   uint     total    =HistoryDealsTotal();
   ulong    ticket   =0;
   long     deal_id  =0;
   double   profit   =0;
   long     type     =0;
//--- for all deals
   for(uint i=0;i<total;i++)
     {
      //--- try to get deals ticket
      if((ticket=HistoryDealGetTicket(i))>0)
        {
         //--- get deals properties
         deal_id  =HistoryDealGetInteger(ticket,DEAL_POSITION_ID);
         profit   =HistoryDealGetDouble(ticket,DEAL_PROFIT);
         type     =HistoryDealGetInteger(ticket,DEAL_TYPE);
         //--- only buy or sell
         if(type==DEAL_TYPE_BUY || type==DEAL_TYPE_SELL)
           {
            bool seach=false;
            int number=ArraySize(arr_struct_positions);
            for(int j=0;j<number;j++)
              {
               if(arr_struct_positions[j].position_id==deal_id)
                 {
                  arr_struct_positions[j].position_profit+=profit;
                  seach=true;
                  break;
                 }
              }
            if(!seach)
              {
               ArrayResize(arr_struct_positions,number+1);
               arr_struct_positions[number].position_id=deal_id;
               arr_struct_positions[number].position_profit+=profit;
              }
           }
        }
     }
//---
   int number=ArraySize(arr_struct_positions);
   for(int i=0;i<number;i++)
     {
      Print("id ",arr_struct_positions[i].position_id," profit ",arr_struct_positions[i].position_profit);
     }
  }
First, the struct_positions structure is declared:
//--- structure profit positions;
   struct struct_positions
     {
      long              id;
      double            profit;
      //--- constructor
                        struct_positions() {id=0; profit=0.0;}
     };
   struct_positions arr_struct_positions[];
The struct_positions structure contains two fields:
id — position identifier;
profit — position profit.
Right after that the arr_struct_positions[] array of structures is declared.
Below is the block of auxiliary variables for calling the deals history:
//--- request trade history
   HistorySelect(start,TimeCurrent());
   uint     total    =HistoryDealsTotal();
   ulong    ticket   =0;
   long     deal_id  =0;
   double   profit   =0;
   long     type     =0;
Followed by the cycle for calling the history of deals:
//--- for all deals
   for(uint i=0;i<total;i++)
     {
      //--- try to get deals ticket
      if((ticket=HistoryDealGetTicket(i))>0)
        {
...
         //--- only buy or sell
         if(type==DEAL_TYPE_BUY || type==DEAL_TYPE_SELL)
           {
...
           }
        }
     }
At the same time, as mentioned above, do not forget to focus on only the "Buy" and "Sell" deals.
And here is the code that iterates over the arr_struct_positions[] structure. If it finds a match of the position_id field and the DEAL_POSITION_ID of the deal from history of deals, then the profit of the current deal is summed into the corresponding index of the array of structures.
            bool seach=false;
            int number=ArraySize(arr_struct_positions);
            for(int j=0;j<number;j++)
              {
               if(arr_struct_positions[j].id==deal_id)
                 {
                  arr_struct_positions[j].profit+=profit;
                  seach=true;
                  break;
                 }
              }
            if(!seach)
              {
               ArrayResize(arr_struct_positions,number+1);
               arr_struct_positions[number].id=deal_id;
               arr_struct_positions[number].profit+=profit;
              }
If there are no matches of the id and DEAL_POSITION_ID of the deal in the array of structures, then the array of structures in increased by one element, and this new element will be immediately filled with values.
After filling the array of structures, this code iterates over the array and prints the position identifier and its profit:
//---
   int number=ArraySize(arr_struct_positions);
   for(int i=0;i<number;i++)
     {
      Print("id ",arr_struct_positions[i].id," profit ",arr_struct_positions[i].profit);
     }
Make additions to the position_reversal_v1.mq5 script — add output of all orders along with their parameters from the trade history. The script is saved as position_reversal_v3.mq5.
2016.09.06 15:05:34.399 position_reversal_v3 (USDJPY,M1)        Buy 0.01, "EURUSD"
2016.09.06 15:05:35.068 position_reversal_v3 (USDJPY,M1)        Position EURUSD POSITION_IDENTIFIER #96803513
2016.09.06 15:05:35.068 position_reversal_v3 (USDJPY,M1)        Deal EURUSD volume 0.01 DEAL_POSITION_ID #96803513 profit 0.00
2016.09.06 15:05:35.068 position_reversal_v3 (USDJPY,M1)        Order EURUSD initial_volume 0.01 ORDER_POSITION_ID #96803513 ORDER_TICKET 96803513
2016.09.06 15:05:35.068 position_reversal_v3 (USDJPY,M1)
2016.09.06 15:05:41.088 position_reversal_v3 (USDJPY,M1)        Sell 0.02, "EURUSD"
2016.09.06 15:05:41.767 position_reversal_v3 (USDJPY,M1)        Position EURUSD POSITION_IDENTIFIER #96803543
2016.09.06 15:05:41.767 position_reversal_v3 (USDJPY,M1)        Deal EURUSD volume 0.01 DEAL_POSITION_ID #96803513 profit 0.00
2016.09.06 15:05:41.767 position_reversal_v3 (USDJPY,M1)        Deal EURUSD volume 0.02 DEAL_POSITION_ID #96803513 profit -0.08
2016.09.06 15:05:41.767 position_reversal_v3 (USDJPY,M1)        Order EURUSD initial_volume 0.01 ORDER_POSITION_ID #96803513 ORDER_TICKET 96803513
2016.09.06 15:05:41.767 position_reversal_v3 (USDJPY,M1)        Order EURUSD initial_volume 0.02 ORDER_POSITION_ID #96803543 ORDER_TICKET 96803543
2016.09.06 15:05:41.767 position_reversal_v3 (USDJPY,M1)
2016.09.06 15:05:47.785 position_reversal_v3 (USDJPY,M1)        PositionClose, "EURUSD"
2016.09.06 15:05:48.455 position_reversal_v3 (USDJPY,M1)        Deal EURUSD volume 0.01 DEAL_POSITION_ID #96803513 profit 0.00
2016.09.06 15:05:48.455 position_reversal_v3 (USDJPY,M1)        Deal EURUSD volume 0.02 DEAL_POSITION_ID #96803513 profit -0.08
2016.09.06 15:05:48.455 position_reversal_v3 (USDJPY,M1)        Deal EURUSD volume 0.01 DEAL_POSITION_ID #96803543 profit -0.05
2016.09.06 15:05:48.455 position_reversal_v3 (USDJPY,M1)        Order EURUSD initial_volume 0.01 ORDER_POSITION_ID #96803513 ORDER_TICKET 96803513
2016.09.06 15:05:48.455 position_reversal_v3 (USDJPY,M1)        Order EURUSD initial_volume 0.02 ORDER_POSITION_ID #96803543 ORDER_TICKET 96803543
2016.09.06 15:05:48.455 position_reversal_v3 (USDJPY,M1)        Order EURUSD initial_volume 0.01 ORDER_POSITION_ID #96803543 ORDER_TICKET 96803561
This script visualizes the following quote from the help:
Position identifier is a unique number assigned to each re-opened position. It does not change throughout its life cycle and corresponds to the ticket of an order used to open a position.
So, to determine the position opening time, it is sufficient to search the trade history for the order with ticket (ORDER_TICKET) equal to the position identifier (POSITION_IDENTIFIER) and get the time of the found order (ORDER_TIME_DONE).
1.4. Intermediate storage of the reconstructed positions
The reconstructed position will be stored in the struct_positions array of structures:
struct struct_positions
  {
   long              id;
   datetime          time;
   double            loss;
   double            profit;
   string            symbol_name;
   //--- constructor
                     struct_positions() {id=0; time=0; loss=0.0; profit=0.0; symbol_name=NULL;}
  };
where
id — position identifier;
time — position opening time;
loss — position loss, and the data in this field will be written with the "+" sign (this is necessary for a better visual representation of the charts)
profit — position profit
symbol_name — name of the symbol, for which a position had been opened.
Later, when plotting different charts, it is the struct_positions array of structures that will be used as the database of trade history, that is consolidated to positions.
2. Google Charts
The Google Charts service will be used for displaying the analytics. To do that, the charts will be placed in an HTML page. Afterwards, the page will be opened in the browser set by default in the operating system (using the ShellExecuteW function of the Win API).
Two chart types will be used in the article: histogram and pie chart. Let us examine them in detail.
The 'bar' type allows to display the following charts on an HTML page:


Here is the code for the first chart. Save it with the *.html extension (or download the bar.html file at the end of this article) and open this file in a browser:
<html>
  <head>
    <!--Load the AJAX API-->
    <script type="text/javascript" src="https://www.gstatic.com/charts/loader.js"></script>
    <script type="text/javascript">

      google.charts.load('current', {'packages':['bar']});
      google.charts.setOnLoadCallback(drawChart1);
      function drawChart1() {
        var data1 = google.visualization.arrayToDataTable([
          ['Symbol', 'Profit', 'Loss'],
          ['Si-6.16', 82.00, 944.00],
          ['Si-9.16', 56.00, 11.00],
          ['SBRF-9.16', 546.00, 189.00],
        ]);

        var options1 = {
          chart: {
            title: 'Profit/loss by Symbols',
            subtitle: 'Summary',
          },
          bars: 'vertical',
          vAxis: {format: 'decimal'},
          width: 440,
          height: 400,
          colors: ['#5b9bd5', '#ed7d31', '#7570b3']
        };
        var chart = new google.charts.Bar(document.getElementById('chart_div1'));
        chart.draw(data1, options1);
      }

    </script>
  </head>

  <body>
    <!--Div that will hold the pie chart-->
      <div id="chart_div1"></div>
    <br/>
  </body>
</html>
To use the Google Charts, it is necessary to adhere to the code placement rules described below.
The loader and library files should be included in the <head> block:
    <!--Load the AJAX API-->
    <script type="text/javascript" src="https://www.gstatic.com/charts/loader.js"></script>
    <script type="text/javascript">
After that, specify the chart type and the function with the data for drawing (drawChart):
      google.charts.load('current', {'packages':['bar']});
      google.charts.setOnLoadCallback(drawChart1);
The drawChart1() function contains three blocks itself:
- "var data1" — block of data used as the basis for plotting the chart
- "var options1" — block of options that specify the chart parameters
- block that points to the container for displaying the chart:
      function drawChart1() {
        var data1 = google.visualization.arrayToDataTable([
          ['Symbol', 'Profit', 'Loss'],
          ['Si-6.16', 82.00, 944.00],
          ['Si-9.16', 56.00, 11.00],
          ['SBRF-9.16', 546.00, 189.00],
        ]);

        var options1 = {
          chart: {
            title: 'Profit/loss by Symbols',
            subtitle: 'Summary',
          },
          bars: 'vertical',
          vAxis: {format: 'decimal'},
          width: 440,
          height: 400,
          colors: ['#5b9bd5', '#ed7d31', '#7570b3']
        };
        var chart = new google.charts.Bar(document.getElementById('chart_div1'));
        chart.draw(data1, options1);
      }
in this case, presence or absence of the last comma in line
['SBRF-9.16', 546.00, 189.00],does not affect the performance of the HTML page code, and this greatly simplifies the algorithm for creating the data block. Please note: since the plotted chart is of the 'bar' type, specify this type as:
var chart = new google.charts.Bar(document.getElementById('chart_div1'));The container itself is placed in the <body>:
    </script>
  </head>

  <body>
    <!--Div that will hold the pie chart-->
      <div id="chart_div1"></div>
    <br/>
  </body>
</html>
2.2. Pie chart ('corechart' type)
This article will use this chart:

Below is the code of the HTML page, that generates the creation of a pie chart. Save this code with the *.html extension (or download the corechart.html file at the end of this article) and open this file in a browser.
<html>
  <head>
    <!--Load the AJAX API-->
    <script type="text/javascript" src="https://www.gstatic.com/charts/loader.js"></script>
    <script type="text/javascript">

      google.charts.load('current', {'packages':['corechart']});
      google.charts.setOnLoadCallback(drawChart2);
      function drawChart2() {
        var data2 = google.visualization.arrayToDataTable([
          ['Symbols', 'Profit'],
          ['Si-6.16', 82.00],
          ['Si-9.16', 56.00],
          ['SBRF-9.16', 546.00],
        ]);

        var options2 = {
            title: 'Profit by Symbols, %',
            pieHole: 0.4,
            width: 440,
            height: 400,
        };
        var chart = new google.visualization.PieChart(document.getElementById('chart_div2'));
        chart.draw(data2, options2);
      }

    </script>
  </head>

  <body>
    <!--Div that will hold the pie chart-->
      <div id="chart_div2"></div>
    <br/>
  </body>
</html>
Functionally, the blocks are arranged in the same manner as in the above example, with only slight changes in data representation. For a pie chart, the data should be specified as follows:
        var data2 = google.visualization.arrayToDataTable([
          ['Symbols', 'Profit'],
          ['Si-6.16', 82.00],
          ['Si-9.16', 56.00],
          ['SBRF-9.16', 546.00],
        ]);

        var options2 = {
            title: 'Profit by Symbols, %',
            pieHole: 0.4,
            width: 440,
            height: 400,
        };
and since the plotted chart is of the 'corechart' type, the block that points to the container looks as follows:
        var chart = new google.visualization.PieChart(document.getElementById('chart_div2'));
        chart.draw(data2, options2);
2.3. Histogram ('bar' type) + pie chart ('corechart' type) + histogram ('bar' type)
The code of this example is saved in the bar_corechart_bar.html file and is available for download at the end of the article. The example itself looks like this (image is scaled down):

A configuration where different chart types are present simultaneously is a more complex case, as it is necessary to correctly arrange the drawChart***() functions on the page, as well as the blocks that point to the container for displaying the chart. When placing charts of several types (for example, histogram and pie chart) in a single page, they are included the following way:
google.charts.load('current', {'packages':['bar', 'corechart']});The general scheme of the bar_corechart_bar.html file will be:
<html>
  <head>
    <!--Load the AJAX API-->
    <script type="text/javascript" src="https://www.gstatic.com/charts/loader.js"></script>
    <script type="text/javascript">

      google.charts.load('current', {'packages':['bar', 'corechart']});
      google.charts.setOnLoadCallback(drawChart1);
      google.charts.setOnLoadCallback(drawChart2);
      google.charts.setOnLoadCallback(drawChart4);
      function drawChart1() {
        var data1 = ...

        var options1 = ...

        var chart = new google.charts.Bar(document.getElementById('chart_div1'));
        chart.draw(data1, options1);
      }

      function drawChart2() {
        var data2 = ...

        var options2 = ...

        var chart = new google.visualization.PieChart(document.getElementById('chart_div2'));
        chart.draw(data2, options2);
      }

      function drawChart4() {
        var data4 = ...

        var options4 = ...

        var chart = new google.charts.Bar(document.getElementById('chart_div4'));
        chart.draw(data4, options4);
      }

    </script>
  </head>

  <body>
    <!--Div that will hold the pie chart-->
      <table>
        <tr>
          <td><div id="chart_div1"></div></td>
          <td><div id="chart_div2"></div></td>
          <td><div id="chart_div4"></div></td>
      </table>
    <br/>
  </body>
</html>
The drawChart1 and drawChart4 functions draw the histograms, the drawChart2 function draws the pie chart.
3. Running analytics charts from the terminal (for the current trading account)
The simplest option is to use a small script. When attached to chart, it starts the browser and displays the analytics charts of trades distribution depending on the entry time. The important thing is to specify the start date for plotting the analytics (the "start" input parameter):
//+------------------------------------------------------------------+
//|                                                  test_report.mq5 |
//|                        Copyright 2016, MetaQuotes Software Corp. |
//|                                             https://www.mql5.com |
//+------------------------------------------------------------------+
#property copyright "Copyright 2016, MetaQuotes Software Corp."
#property link      "https://www.mql5.com"
#property version   "1.00"
#property script_show_inputs
//---
input datetime start=D'2010.05.11 12:05:00';
#include <DistributionOfProfits.mqh>
//---
CDistributionOfProfits Analysis;
//+------------------------------------------------------------------+
//| Script program start function                                    |
//+------------------------------------------------------------------+
void OnStart()
  {
//---
   Analysis.AnalysisTradingHistory(start);
   Analysis.ShowDistributionOfProfits();
  }
//+------------------------------------------------------------------+
Since the "DistributionOfProfits.mqh" file uses a call to the system DLL, it is necessary to allow DLL imports when running the script:

4. Running analytics charts from the strategy tester
For example, let us use the "MACD Sample.mq5" expert from the standard delivery set (data catalog\MQL5\Experts\Examples\MACD\MACD Sample.mq5). Copy this expert to a separate folder, so that the changes made would not affect the original file. Then rename it to "MACD Sample report.mq5". Make the following changes to the EA:
//+------------------------------------------------------------------+
//|                                           MACD Sample report.mq5 |
//|                   Copyright 2009-2016, MetaQuotes Software Corp. |
//|                                              https://www.mql5.com |
//+------------------------------------------------------------------+
#property copyright   "Copyright 2009-2016, MetaQuotes Software Corp."
#property link        "https://www.mql5.com"
#property version     "5.50"
#property description "It is important to make sure that the expert works with a normal"
#property description "chart and the user did not make any mistakes setting input"
#property description "variables (Lots, TakeProfit, TrailingStop) in our case,"
#property description "we check TakeProfit on a chart of more than 2*trend_period bars"

#define MACD_MAGIC 1234502
//---
#include <Trade\Trade.mqh>
#include <Trade\SymbolInfo.mqh>
#include <Trade\PositionInfo.mqh>
#include <Trade\AccountInfo.mqh>
#include <DistributionOfProfits.mqh>
//---
input double InpLots          =0.1; // Lots
input int    InpTakeProfit    =50;  // Take Profit (in pips)
input int    InpTrailingStop  =30;  // Trailing Stop Level (in pips)
input int    InpMACDOpenLevel =3;   // MACD open level (in pips)
input int    InpMACDCloseLevel=2;   // MACD close level (in pips)
input int    InpMATrendPeriod =26;  // MA trend period
//---
int ExtTimeOut=10; // time out in seconds between trade operations
CDistributionOfProfits ExtDistribution;
//+------------------------------------------------------------------+
//| MACD Sample expert class                                         |
//+------------------------------------------------------------------+
class CSampleExpert
  {
protected:
Add the OnTester() function at the very end:
//+------------------------------------------------------------------+
//| Tester function                                                  |
//+------------------------------------------------------------------+
double OnTester()
  {
//---
   double ret=0.0;
   ExtDistribution.AnalysisTradingHistory(0);
   ExtDistribution.ShowDistributionOfProfits();
//---
   return(ret);
  }
Before starting the tester, it is necessary to allow the use of the DLL in the terminal settings:

This resulted in a page with analytics charts, where a chart of profit/loss distribution by hours can be seen:

It is evident which hours had the profitable positions opened and which had the unprofitable ones. The two time intervals with losses have been marked on the chart. What if we limit trading in the specified unfavorable hours? Or maybe go even further - reverse the trade signals to the opposite ones, in order to get profit instead of losses? Readers are welcome to test this themselves.
Interesting results can also be obtained by running a multi-currency EA in the strategy tester. As an example, the free Multicurrency Expert from the CodeBase was used. In addition, the "#include <DistributionOfProfits.mqh>" file was specified and the "CDistributionOfProfits ExtDistribution" variable was declared in the header of the EA, and the "OnTester()" function was added at the end of the code. After a single run, the following statistics had been received: "TestAnalysis.htm".
Note that all the charts are interactive. For example, in the first histogram — "Profit/loss by symbols (Summary)" — the values for each symbol can be viewed by hovering any of the columns:


Now the pie charts: they show the contribution of each symbol to the profits and losses during trading:


The rest of the charts show the profitability for every symbol, depending on the position entry time:
This is the "quiet" optimization without a fuss
The task on plotting trade distributions has been completed. At that, the trade history is consolidated to positions, and all analytical charts are plotted exclusively for the positions. Profit or loss of the position is analyzed by entry time in three ways: by hours, by days of the week and by months.
With the help of the source codes provided in the article, any strategy can be checked for favorable and unfavorable hours and days for trading. And who knows, perhaps, instead of one initial strategy you might get a couple of new ones, for example, a trend and a counter trend strategy. Or it may become clear, which trading session (Asian, European or American) should be avoided rather than traded. Feel free to try this "quiet" optimization method, which does not require any additional runs in the strategy tester.
Changes
Briefly about the changes that have been made to the code, after the first publication of the article.
"DistributionOfProfits.mqh" v.1.027: Introduced protection of the program operation during optimization. The constructor contains the file name "Non File", and two public functions perform the check of the MQL_OPTIMIZATION constant:
//+------------------------------------------------------------------+
//| Constructor                                                      |
//+------------------------------------------------------------------+
CDistributionOfProfits::CDistributionOfProfits(void) : m_name_file("Non File"),
                                                       m_color_loss("ed7d31"),
                                                       m_color_profit("5b9bd5"),
                                                       m_width("440"),
                                                       m_height("400"),
                                                       m_data_number(1)
  {
  }
//+------------------------------------------------------------------+
//| Analysis Trading History                                         |
//+------------------------------------------------------------------+
bool CDistributionOfProfits::AnalysisTradingHistory(const datetime start_time=0)
  {
//---
   if(MQLInfoInteger(MQL_OPTIMIZATION))
      return(false);
//+------------------------------------------------------------------+
//| Show Distribution Of Profits (start of the browser)              |
//+------------------------------------------------------------------+
void CDistributionOfProfits::ShowDistributionOfProfits(void)
  {
//---
   if(MQLInfoInteger(MQL_OPTIMIZATION))
      return;
"DistributionOfProfits.mqh" v.1.033: Now it is possible to analyze the positions in money, in points, in money and in points.
The analysis type is set as follows:
//+------------------------------------------------------------------+
//|                                                  test_report.mq5 |
//|                        Copyright 2016, MetaQuotes Software Corp. |
//|                                             https://www.mql5.com |
//+------------------------------------------------------------------+
#property copyright "Copyright 2016, MetaQuotes Software Corp."
#property link      "https://www.mql5.com"
#property version   "1.00"
#property script_show_inputs
//+------------------------------------------------------------------+
//| type of report                                                   |
//+------------------------------------------------------------------+
enum ANALYSIS_TYPE
  {
   ONLY_MONEY=0,        // in money
   ONLY_POINTS=1,       // in points
   MONEY_AND_POINTS=2,  // in money and points
  };
//---
input datetime start=D'2016.06.28 09:10:00';
input ANALYSIS_TYPE report_type=MONEY_AND_POINTS;
//---
#include <DistributionOfProfits.mqh>
//---
CDistributionOfProfits Analysis;
//+------------------------------------------------------------------+
//| Script program start function                                    |
//+------------------------------------------------------------------+
void OnStart()
  {
//---
   Analysis.SetTypeOfAnalysis(report_type);
   Analysis.AnalysisTradingHistory(start);
   Analysis.ShowDistributionOfProfits();
  }
//+------------------------------------------------------------------+
Translated from Russian by MetaQuotes Ltd.
Original article: https://www.mql5.com/ru/articles/2626
 Portfolio trading in MetaTrader 4
 MQL5 vs QLUA - Why trading operations in MQL5 are up to 28 times faster?
 The Easy Way to Evaluate a Signal: Trading Activity, Drawdown/Load and MFE/MAE Distribution Charts
 Cross-Platform Expert Advisor: Orders
- Free trading apps
- Over 8,000 signals for copying
- Economic news for exploring financial markets
You agree to website policy and terms of use
Is there any way to add the Average Equity Drawdown by hour?
You need to assign start-up capital, and then work by analogy.