
Identifying Trade Setups by Support, Resistance and Price Action
Table of Contents
- Introduction
- 1. Looking at Support and Resistance
- 2. Identifying High-Probability Setups from Price Action
- 3. MQL4 Code for Price Action Setups
- 4. Combining Support/Resistance with Price Action
Introduction
This article covers a trading methodology that can be used in any Forex, stock, or commodity market, as well as MQL4 code examples that can be used in an Expert Advisor based on this methodology.
Price action and the determination of support and resistance levels are the key components of the system. Market entry is entirely based on those two components. Reference price levels will be explained along with effective ways of choosing them. The MQL4 examples include parameters for minimizing risk. This is done by keeping market exit references and stops relatively close to the entry prices.
There is an additional benefit of allowing higher volume trades, regardless of account size. Lastly, options for determining profit targets are discussed, accompanied by MQL4 code that enables profitable market exit during a variety of conditions.
1. Looking at Support and Resistance
If you look at any price chart, for any market, having any timeframe, two facts will become apparent that are based on characteristics which consistently appear. One of these facts is that the market price shown at any point in time does not stay the same for very long. Given enough time, the market price will have significantly changed. Any price shown on the chart can be used as a reference level.
Certain prices, however, act as better references than others. We will get to that shortly. The second aforementioned fact is that any chart will have certain prices at which point the market trend will reverse. Often times, the market will repeatedly reach these price levels and change direction shortly after. These are the support and resistance levels that virtually any trader has heard of. Support is a price level below which the market will not drop. Resistance is a price above which the market will not go.
Also known as tops and bottoms, these price levels send the message that this is as far as the market will go (for now) and reversals will begin near these levels. Support and resistance levels are good prices to use as reference levels, as they signify prices at which a new trend can start with higher probability. Other prices, found approximately midway between two relative support and resistance levels, are also good reference levels. We will refer to these as midpoints.
Any portion of a price chart can be marked off with horizontal lines at relevant support, resistance, and midpoint prices to be used as references. An example of this is shown in Fig. 1 below.
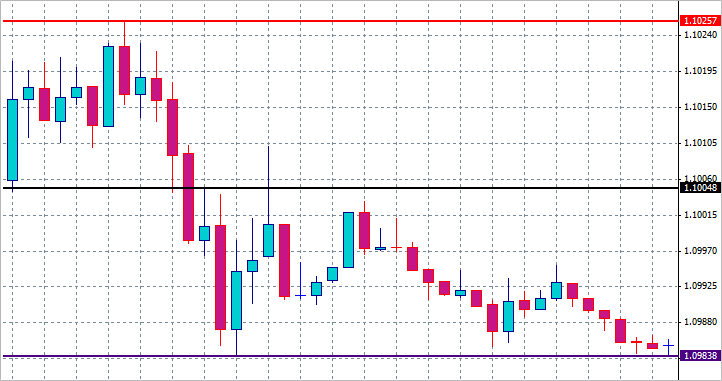
Fig. 1. Support, resistance, and midpoint
The bottom purple line indicates support at 1.09838. The top red line indicates resistance at 1.10257.
Approximately halfway between the two is a black line, the midpoint, at 1.10048. The exact determination of support and resistance is subjective and can vary based on your own choices of possible market entries and exits. You might want to open a position at or near a very specific price. Or, the exact entry price might not matter as much and any one among a wider range of prices will suffice. It all depends on your individual trading style and profit goals.
As a result, the distance between your support and resistance reference points can vary greatly. They are only references to be used in defining proper trade conditions.
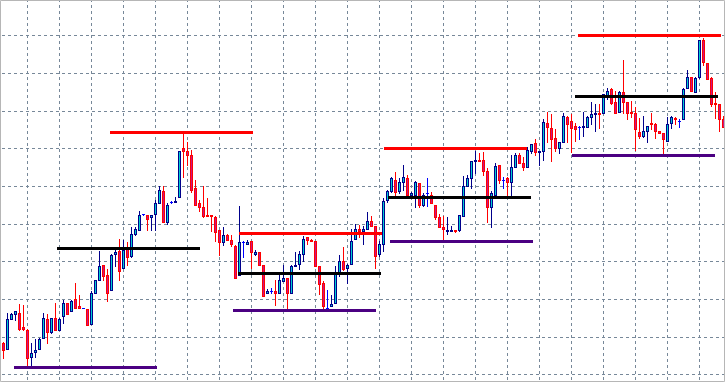
Fig. 2. Support and Resistance price ranges
Fig. 2 shows four different support and resistance price ranges on a 1-minute chart.
Some of the ranges are wider and some are narrower. As mentioned, the price levels are marked off subjectively, but it's obvious that they occur at the tops and bottoms (and midway between) of short-term trends.
Figures 3 through 6 are examples of support and resistance ranges marked off over both longer and shorter time periods on 1-minute charts.
Figures 3-4 show a bull market and figures 5-6 show a bear market.
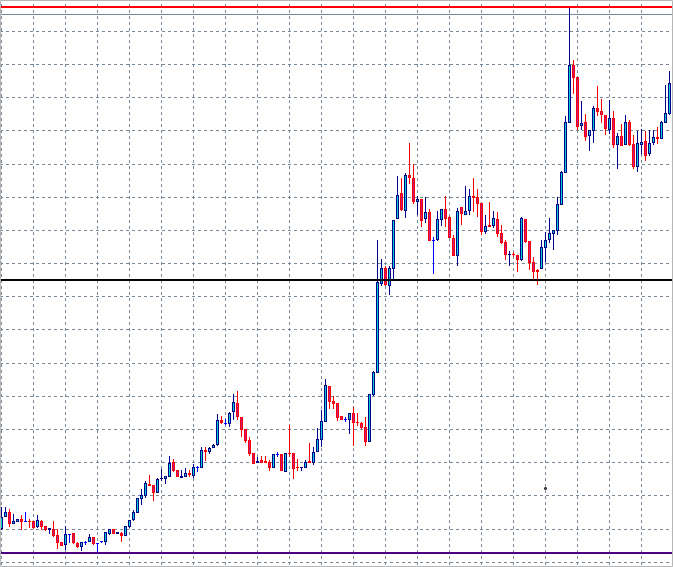
Fig. 3. Wide bull market
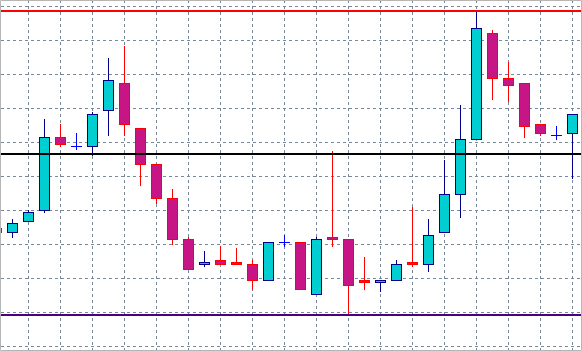
Fig. 4. Narrow bull market
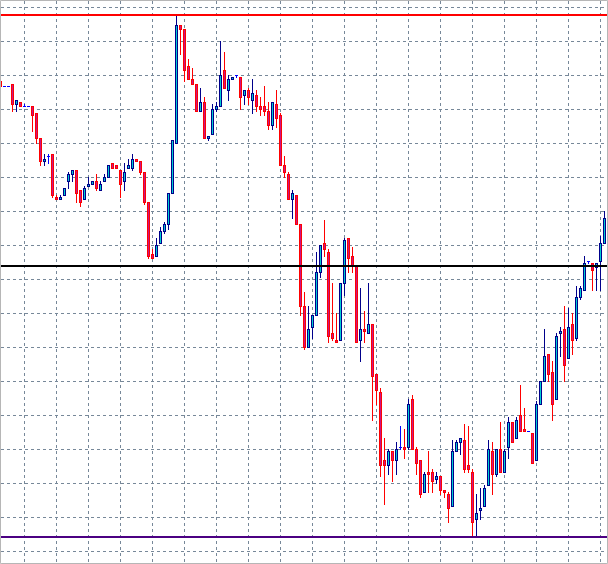
Fig. 5. Wide bear market
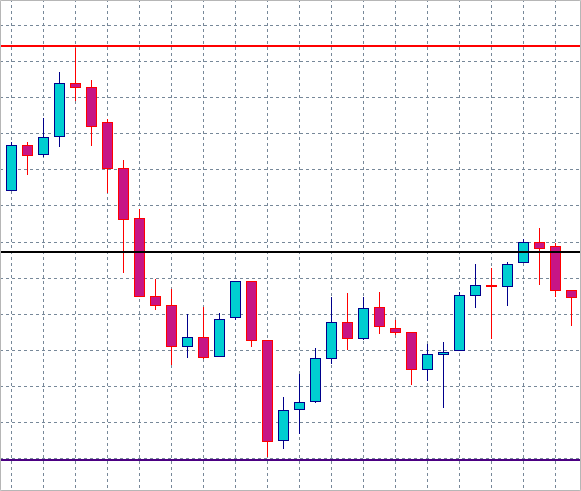
Fig. 6. Narrow bear market
These reference price levels indicate areas to watch for specific types of price action. A trade setup occurs when these types of price action are seen on a chart.
2. Identifying High-Probability Setups from Price Action
There are a variety of double candlestick patterns that provide a high probability trade setup. Three that are considered will be described here. Occurrences of these patterns are watched for near the support and resistance levels that are being used as possible entry references. As a side note, every example presented from now on will be shown with 1-minute candlesticks. This timeframe will always be used because of the precise entry points that this system utilizes, as well as its tight range of Stop Loss orders.
Every one of the following three patterns is comprised of two 1-minute candlesticks. When one of these patterns is seen near a reference price level (support, resistance or midpoint), market entry occurs exactly at the opening price of the next (third) 1-minute candlestick. Examples of this will be shown after the three patterns are described.
The first pattern, Pattern 1, is comprised of a candlestick that has a "wick" that is longer than its body, and a second candlestick that closes past the first in the opposite direction of the first candlestick's wick. The wick is the straight vertical line indicating the price range between either the high and Open/Close of a candlestick above its body, or the range between the low and the Open/Close below its body. "Doji" candlesticks could be included as the first candlestick in the pattern.

Fig. 7. Bullish Pattern 1

Fig. 8. Bearish Pattern 1
Figure 7 shows a bullish pattern and Fig. 8 shows a bearish pattern.
These patterns are similar to the "Hammer" candlestick patterns, but are not as specific, as doji's can be included as well as any combination of up or down candles.
Fig. 9 shows a bullish trend that begins with this type of pattern.
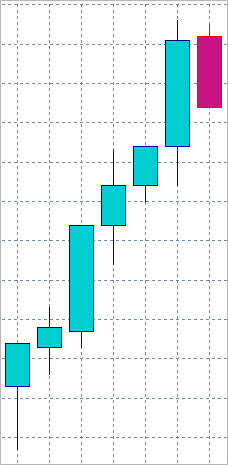
Fig. 9. Bullish Trend
The second pattern, Pattern 2, consists of two candlesticks where the second candle has a body that is virtually the same length as the first candle's body.
The bodies of both candles also have approximately the same open and close prices. It should be noted that the length of the bodies of both candles, and their corresponding open and close prices, do not have to match exactly. Examples of these patterns are shown in Fig. 10, a bearish pattern, and Fig. 11, which is a bullish pattern.
These patterns are known as "Tweezers". Fig. 12 shows a bearish trend that starts with a Tweezer pattern.

Fig. 10. Bearish Pattern 2

Fig. 11. Bullish Pattern 2
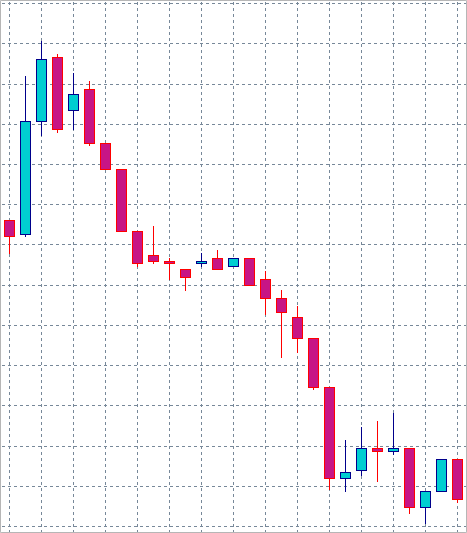
Fig. 12. Bearish Trend
The last pattern, Pattern 3, is more of a general pattern in that it consists of virtually any type of candlestick in the first position and a second candlestick that closes completely past the first. Fig. 13 shows a bullish pattern and Fig. 14 shows a bearish pattern.
Fig. 15 shows a bullish trend beginning with this type of pattern.

Fig. 13. Bullish Pattern 3

Fig. 14. Bearish Pattern 3
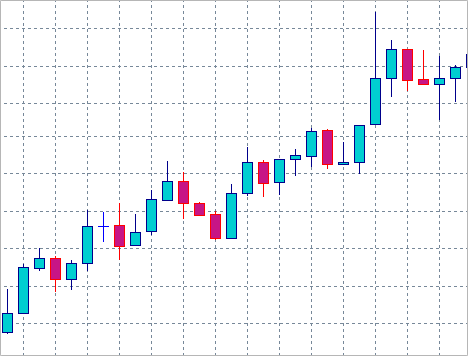
Fig. 15. Bullish Trend
When you look at a pair of 1-minute candlesticks that form one of these three patterns, you should consider one other factor in choosing whether or not to enter the market at that point in time.
And that is the difference between the potential entry price and the nearby support or resistance price used as a reference. If the entry price is too far from the reference level, you might not want to open a position, regardless of the price action pattern.
As mentioned previously, actual market entry occurs at the exact moment that the next 1-minute candlestick opens. In other words, 2 candlesticks form one of the described patterns and then a third candlestick opens. It is right at that opening price that a market order is placed. This will be illustrated in the following section that covers the MQL4 code used for these setups. Obviously, because price action is a key element of these types of trade setups, market orders are always used for entry. Pending orders for entry are never used.
3. MQL4 Code for Price Action Setups
Now that the methodology behind the trading system's entries has been covered, the code for its implementation will be explained.
The following blocks of code can be used in EAs based on price action and support/resistance levels. First, you will define your variables. Some of the variables will consist of recent open, high, low, and close prices of 1-minute candlesticks. Each of these four prices will be found for the current 1-minute candlestick and the two previous candles. This is done by using iOpen(), iHigh(), iLow(), and iClose().
Since you will be looking for a fully-formed two candle pattern, the candle that forms two minutes prior to the current one will be the first in the pattern (for example, the left candle in Fig. 7). That candlestick will be labeled Candle1. The next candlestick that is formed one minute later will be labeled Candle2 (the right candle in Fig. 7).
The current candlestick will be labeled Candle3, and will be forming to the right of Candle2. Because real-time price action is being monitored, it is from this perspective of the current and two previous candlesticks that the Expert Advisor will operate.
double O1=NormalizeDouble(iOpen(Symbol(),PERIOD_M1,2),4);
The above code will define the opening price of Candle1.
Because the value of this variable will be a decimal, the double data type is used. "O1" refers to the Open price of the first candle in the pattern. iOpen() provides this data with Symbol() used as the first parameter so that it works with any symbol on the chart from which the EA is operating.
"PERIOD_M1" specifies the 1-minute timeframe and the last parameter, having a value of 2 in this case, defines the shift relative to the current candlestick. A shift of 0 would indicate the current candle, 1 would indicate one candlestick back, and 2 indicates two candlesticks back.
Correspondingly, O1, H1, L1 and C1 refer to the Open, High, Low, and Close prices of Candle1, respectively. The O2, H2, L2, C2, and O3, H3, L3, C3 refer to the same prices for Candles 2 and 3.
The following code block is an example of these variable definitions.
//---- Candle1 OHLC
double O1=NormalizeDouble(iOpen(Symbol(),PERIOD_M1,2),4);
double H1=NormalizeDouble(iHigh(Symbol(),PERIOD_M1,2),4);
double L1=NormalizeDouble(iLow(Symbol(),PERIOD_M1,2),4);
double C1=NormalizeDouble(iClose(Symbol(),PERIOD_M1,2),4);
//---- Candle2 OHLC
double O2=NormalizeDouble(iOpen(Symbol(),PERIOD_M1,1),4);
double H2=NormalizeDouble(iHigh(Symbol(),PERIOD_M1,1),4);
double L2=NormalizeDouble(iLow(Symbol(),PERIOD_M1,1),4);
double C2=NormalizeDouble(iClose(Symbol(),PERIOD_M1,1),4);
//---- Candle3 OHLC
double O3=NormalizeDouble(iOpen(Symbol(),PERIOD_M1,0),4);
double H3=NormalizeDouble(iHigh(Symbol(),PERIOD_M1,0),4);
double L3=NormalizeDouble(iLow(Symbol(),PERIOD_M1,0),4);
double C3=NormalizeDouble(iClose(Symbol(),PERIOD_M1,0),4);
The conditional statements will be described next. Specifically, the conditionals that would define an occurrence of one of the three primary 2-candlestick patterns.
An instance of Pattern 1, described in the previous section and shown in Fig. 7 above, would have occurred if the following statement was true.
if(C1 >= O1 && L1 < O1 && ((O1-L1)>(C1-O1)) && C2 >= O2 && C2 > H1 && L2 > L1)
This pattern requires six conditions to be met. The first, C1>=O1, states that Candle1 has to be an upside candle, or its opening price can equal its closing price. L1<O1 states that Candle1's low price has to be lower than its opening price. The next condition requires that the difference between Candle1's open and low prices has to be greater than the difference between Candle1's close and open prices. This means that Candle1 must have a downside wick that is longer than its body.
The fourth condition refers to Candle2 and requires that its close price greater or at least equal to its open price. C2>H1 necessitates that Candle2 closes above the high price of Candle1. Lastly, the low price of Candle2 must be higher than the low price of Candle1.
If all these conditions are met at the occurrence of Pattern 1, the following code will place a BUY market order.
This order will have a 0.1 lot volume, a slippage of 5, a Stop Loss of 10 pips below the Bid, and a Take Profit of 50 pips above the Bid.
 //---- Pattern 1 - bullish
 if(C1 >= O1 && L1 < O1 && ((O1-L1)>(C1-O1)) && C2 >= O2 && C2 > H1 && L2 > L1)
  {
   OrderSend(Symbol(),OP_BUY,0.1,Ask,5,Bid-10*Point,Bid+50*Point);
   return;
  }
Alternatively, in order to place a SELL market order, the conditions will be changed to allow for a bearish pattern similar to Fig. 8. Also, the OrderSend() function parameters will differ accordingly.
This code would place an order similar to that shown above, only in the opposite direction:
 //---- Pattern 1 - bearish
 if(C1 <= O1 && H1 > O1 && ((H1-O1)>(O1-C1)) && C2 <= O2 && C2 < L1 && H2 < H1)
  {
   OrderSend(Symbol(),OP_SELL,0.1,Bid,5,Ask+10*Point,Ask-50*Point);
   return;
  }
Similar code will be used to place market orders when instances of Pattern 2 and Pattern 3 occur.
A bullish Pattern 2 (tweezers) will have the following required conditions:
 //---- Pattern 2 - bullish
 if(C1 < O1 && C2 > O2 && ((O1-C1)>(H1-O1)) && ((O1-C1)>(C1-L1)) && ((C2-O2)>(H2-C2)) && ((C2-O2)>(O2-L2)) && O2 <= C1 && O2 >= L1 && C2 >= O1 && C2 <= H1)
  {
   OrderSend(Symbol(),OP_BUY,0.1,Ask,5,Bid-10*Point,Bid+50*Point);
   return;
  }
A bearish Pattern 2 would have this code:
 //---- Pattern 2 - bearish
 if(C1 > O1 && C2 < O2 && ((C1-O1)>(H1-C1)) && ((C1-O1)>(O1-L1)) && ((O2-C2)>(H2-O2)) && ((O2-C2)>(C2-L2)) && O2 >= C1 && O2 <= H1 && C2 <= O1 && C2 >= L1)
  {
   OrderSend(Symbol(),OP_SELL,0.1,Bid,5,Ask+10*Point,Ask-50*Point)
   return;
  }
Lastly, Pattern 3 has the following conditions for both bullish and bearish setups, respectively:
 //---- Pattern 3 - bullish
 if(C1 > O1 && ((C2-O2)>=(H2-C2)) && C2 > O2 && C2 > C1)
  {
   OrderSend(Symbol(),OP_BUY,0.1,Ask,5,Bid-10*Point,Bid+50*Point);
   return;
  }

 //---- Pattern 3 - bearish
 if(C1 < O1 && ((O2-C2)>=(C2-L2)) && C2 < O2 && C2 < C1)
  {
   OrderSend(Symbol(),OP_SELL,0.1,Bid,5,Ask+10*Point,Ask-50*Point)
   return;
  }
Some of the order parameters, such as the Stop Loss and Take Profit, can also be set as variables, instead of being explicitly stated as in the examples above.
4. Combining Support/Resistance with Price Action
Now it is time to combine the price action code with additional code that monitors support and resistance prices as your reference levels.
The EA will watch for the market to reach a certain price level. Once this level is reached, it will look for the types of price action represented by Patterns 1-3. It can be all of those three patterns, bullish or bearish, or only one or a small number of them. The following code uses two more variables to check if the market has reached a certain price, in this case 1.09000 for EURUSD.
For this example, the EURUSD market is trading below 1.09000 at the time that this code becomes active.
double ref=1.09000;
int refhit=0;

if(O2 < ref && C3 >= ref)
  {
   refhit=1;
   return;
  }
The variable ref denotes a reference price level (support, resistance, or midpoint) that is being watched. The other variable, refhit, describes the current market state as having hit the reference price level, or not having reached it yet. Refhit is an integer having a value of 0 or 1. The default value is 0, it indicates that the reference price level has not been hit.
The conditions shown below the variables would, if met, register the market immediately hitting the reference level if and when that occurs. These two variables will now be added to the previously described price action code.
To conclude the EURUSD example, a bullish Pattern 3 setup will be watched for above 1.09000.
This is how the Pattern 3 code will be modified:
  if(refhit==1 && C1 > O1 && ((C2-O2)>=(H2-C2)) && C2 > O2 && C2 > C1 && C1 > ref && C2 > ref)
  {
   OrderSend(Symbol(),OP_BUY,0.1,Ask,5,Bid-10*Point,Bid+50*Point);
   return;
  }
The first additional condition, refhit==1, requires the market to have reached or surpassed the defined value for the ref variable, in this case 1.09000. Remember that the market is trading below 1.09000 before it reaches it. The last two new conditions that were added require both candles of Pattern 3 to close above the ref variable of 1.09000.
For the last example, Fig. 16 shows EURUSD trading between a short term support and resistance range of 1.07660 and 1.07841, respectively.
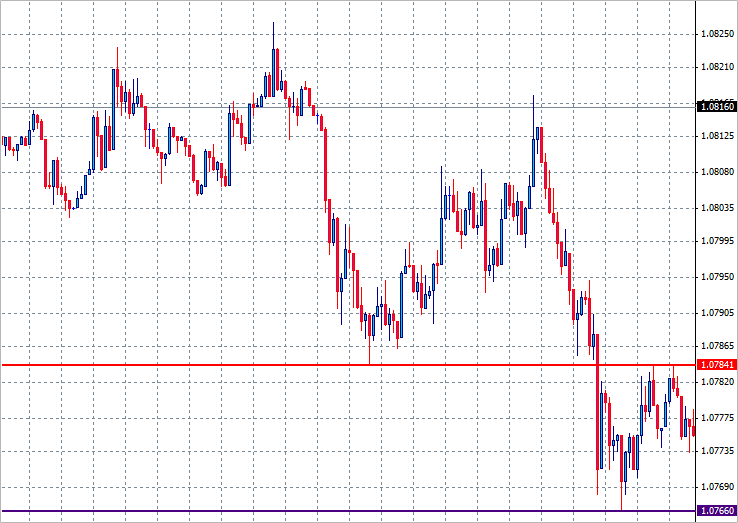
Fig. 16. EURUSD
At the far right section of the image, you can see that the market is trading almost halfway between the two levels.
A long entry will be watched for, near the support level of 1.07660. Because markets do not always reach the exact prices used for support or resistance, a nearby price will be used as a reference level.
In this case it will be 1.07690, a price 3 pips above support. Bullish setups utilizing Patterns 1 through 3 will be watched for.
//---- Variables defined ------------------
//---- Candle1 OHLC
double O1=NormalizeDouble(iOpen(Symbol(),PERIOD_M1,2),4);
double H1=NormalizeDouble(iHigh(Symbol(),PERIOD_M1,2),4);
double L1=NormalizeDouble(iLow(Symbol(),PERIOD_M1,2),4);
double C1=NormalizeDouble(iClose(Symbol(),PERIOD_M1,2),4);
//---- Candle2 OHLC
double O2=NormalizeDouble(iOpen(Symbol(),PERIOD_M1,1),4);
double H2=NormalizeDouble(iHigh(Symbol(),PERIOD_M1,1),4);
double L2=NormalizeDouble(iLow(Symbol(),PERIOD_M1,1),4);
double C2=NormalizeDouble(iClose(Symbol(),PERIOD_M1,1),4);
//---- Candle3 OHLC
double O3=NormalizeDouble(iOpen(Symbol(),PERIOD_M1,0),4);
double H3=NormalizeDouble(iHigh(Symbol(),PERIOD_M1,0),4);
double L3=NormalizeDouble(iLow(Symbol(),PERIOD_M1,0),4);
double C3=NormalizeDouble(iClose(Symbol(),PERIOD_M1,0),4);

double ref=1.07690;
int refhit=0;
//-----------------------------------------

int start()
 {
 //---- Reference check
 if(O2 < ref && C3>=ref)
  {
   refhit=1;
   return;
  }
 //--- Pattern 1 - bullish
 if(refhit==1 && C1 >= O1 && L1 < O1 && ((O1-L1)>(C1-O1)) && C2 >= O2 && C2 > H1 && L2 > L1 && C1 > ref && C2 > ref)
  {
   OrderSend(Symbol(),OP_BUY,0.1,Ask,5,Bid-10*Point,Bid+100*Point);
   return;
  }
 //--- Pattern 2 - bullish
 if(refhit==1 && C1 < O1 && C2 > O2 && ((O1-C1)>(H1-O1)) && ((O1-C1)>(C1-L1)) && ((C2-O2)>(H2-C2)) && ((C2-O2)>(O2-L2)) && O2 <= C1 && O2 >= L1 && C2 >= O1 && C2 <= H1 && C1 > ref && C2 > ref)
  {
   OrderSend(Symbol(),OP_BUY,0.1,Ask,5,Bid-10*Point,Bid+100*Point);
   return;
  }
 //--- Pattern 3 - bullish
 if(refhit==1 && C1 > O1 && ((C2-O2)>=(H2-C2)) && C2 > O2 && C2 > C1 && C1 > ref && C2 > ref)
  {
   OrderSend(Symbol(),OP_BUY,0.1,Ask,5,Bid-10*Point,Bid+100*Point);
   return;
  }
 //---
return;
}
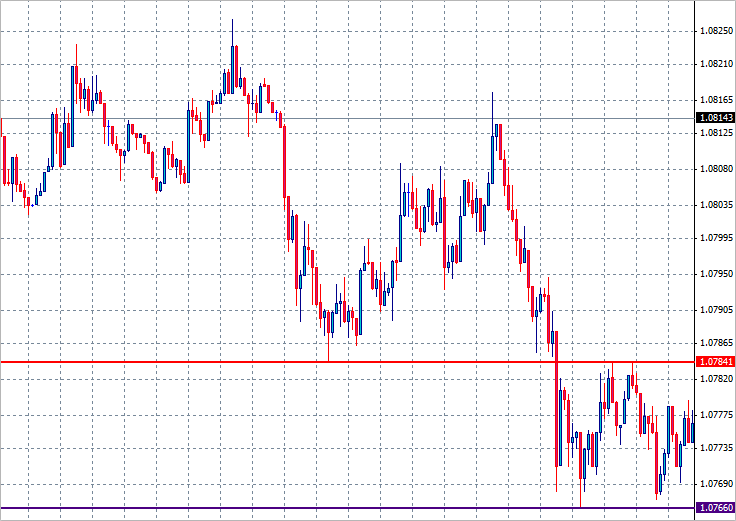
Fig. 17. EURUSD reversal
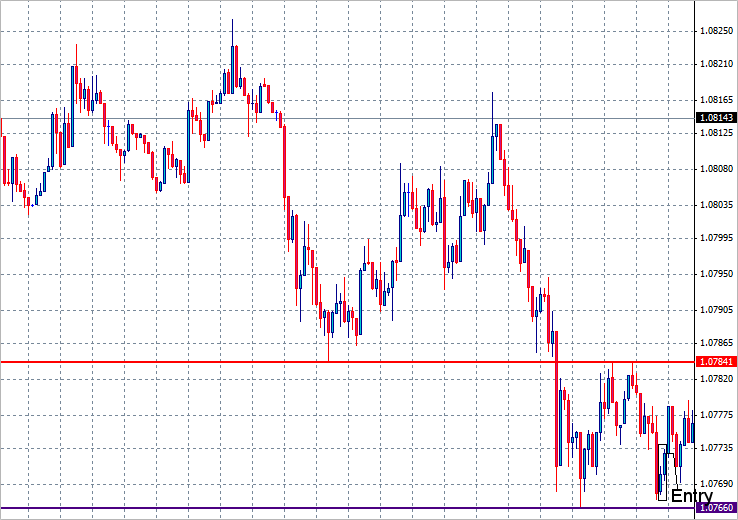
Fig. 18. EURUSD entry
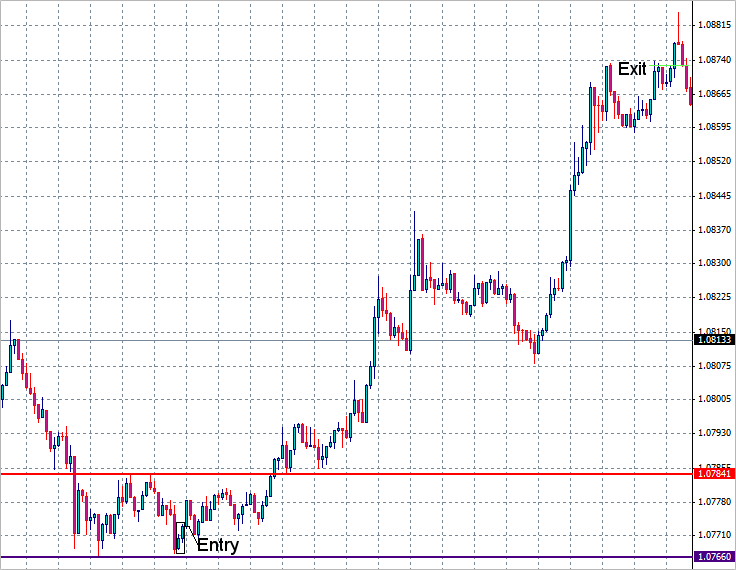
Fig. 19. EURUSD exit
All of the code sections for the bullish patterns require that the market reaches down to 1.07690 and that both Candles 1 and 2 close above it.
Also, the Take Profit levels were doubled from the previous examples. Fig. 17 shows that the market did turn downwards and slightly passed 1.07690, reaching 1.07670 before turning back upwards. This caused refhit to change to a value of 1.
Soon after reversing back upwards, a bullish Pattern 3 formed. This is where a market BUY order was placed and a position opened at 1.07740, as indicated in Fig. 18. (At the opening of Candle 3, the Bid was 1.07720. Due to an allowed slippage of 5, the order was filled at 1.07740.) From that point, the market began a strong trend upwards as shown in Fig. 19. The Stop Loss price was never hit and the position was closed at the Take Profit of 1.08740.
Conclusion
As can be seen by the examples included here, the use of price action in combination with the monitoring of support and resistance levels can be extremely effective in determining trade setups.
The MQL4 code that is included and explained is obviously partial and in and of itself does not constitute an EA. These code examples are to be used as building blocks for a complete Expert Advisor. The primary goal was to illustrate the concepts behind the trading methodology. Other price action patterns can be coded for both market entry and exit. Good luck in all your trading endeavors.
 Tips for Selecting a Trading Signal to Subscribe. Step-By-Step Guide
 Statistical Verification of the Labouchere Money Management System
 MQL5 Cookbook: Implementing an Associative Array or a Dictionary for Quick Data Access
- Free trading apps
- Over 8,000 signals for copying
- Economic news for exploring financial markets
You agree to website policy and terms of use
So it looks for the montly support and resistant level correct me if I'm wrong. And thank you author for sharing great informations.
Not monthly. H4
This is the code for SandR and looking for big trends how I solved it:
Hi Oliver: Can you post the Ea? It´s still working? Thanks.
I have a question, checking your algorithm to have a trade open signal you need O2 < ref and C1 > ref, it's a very difficult situation. It's like that or it's an error??
Thank's!