
Strategy Tester: Modes of Modeling during Testing

Introduction
Many programs of technical analysis allow to test trading strategies on history data. In the most cases, the testing is conducted on already completed data without any attempts to model the trends within a price bar. It can be made quickly, but not precisely enough.
It is important to choose a relevant way of modeling price bars to make a quality testing of a trading strategy. Indeed, there cannot exist an ideal situation when there is a full tick history for an extremely accurate testing. It is very difficult for a normal trader to find the full tick history for a period of several years, in order to analize it.
To solve this problem, the data of more precise periods can be used as reference points with modeling price changes between them.
Ways of Modeling Price Bars
There are three ways of modeling development of bars used in MetaTrader 4 Client Terminal:
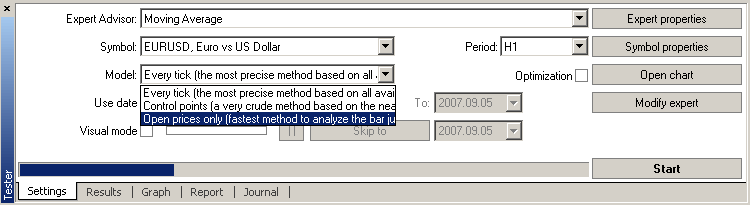
- Every tick (the most precise method based on all available least timeframes)
- Control points (a very crude method based on the nearest less timeframe)
- Open prices (quick method on completed bars, only for Expert Advisors that explicitly control bar opening)
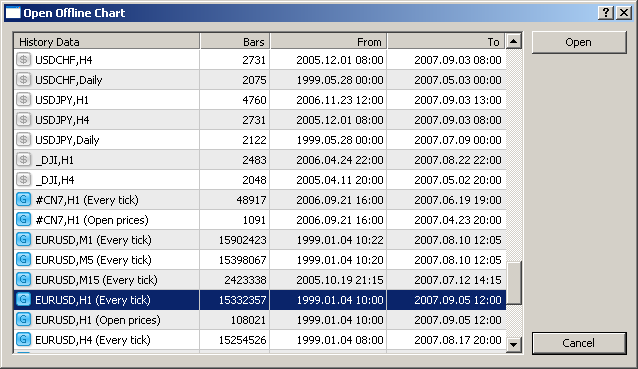
Intermediate price bars are generated before testing starts, the results being saved in file (for example: /tester/history/eurusd_1440_1.fxt). Every time the Start button is clicked, Tester will newly generate the file containing the testing sequence of ticks. Fxt-files are easy to open in the terminal as offline charts via File -> Open offline.
The use of data cached before allows to perform tests on the basis of the own intermediate data. To do so, it is sufficient to save file in a proper format (*.FXT format, completely open)into /tester/history/ directory. These files are easy to open in terminal as offline charts through File -> Open offline.
Examples of Modeling
Let us begin with the simplest modeling method based on a one-hour chart. Now, let us study the one-hour bar (September, 5 2007, 10:00) highlighted with red:
Open Price
Some traders do not wish to depend on particularities of intrabar modeling, so they create Expert Advisors trading on the bars already completed. The fact that the current price bar is fully completed can only be known when the next one appears. These are the Expert Advisors, for which the mode of "Open Price" modeling is intended.
In this mode, first, bar is opened (Open = High = Low = Close, Volume=1), and this allows the Expert Advisor to identify the end of completion of the preceding price bar. It is this incipient bar, on which the Expert Advisor's testing is launched. At the next stage, the current bar fully completed is yielded, but no testing is performed on it!
Control Points (the nearest less timeframe)
Method of modeling control points is intended for crude estimate of Expert Advisors trading within a bar. To use this method, historical data of the nearest less timeframe must be available. In the some cases, the data available from a smaller timeframe do not completely cover the time span of the timeframe under test. If there are no data of a smaller timeframe, the bar evolution is generated on basis of predefined wave templates, as it was the case in the preceding third version of MetaTrader 3 Client Terminal.
As soon as historical data of the less timeframe appear, these are these data that are interpolated. However, the really existing OHLC prices of the less timeframe appear as control points. In the most cases, the results of tests of Expert Advisors by method of control points can be considered as estimated results only, not as final ones. Such results are of intermediate, estimated nature. The chart below shows how the on-hour bar of 2007.09.05 10:00 developed by method of control points.
Every Tick (available least timeframes)
This mode allows to model price movement within a bar in the most precise way. Unlike
"control points", the every-tick method uses for generation not only
data of the nearest smaller timeframe, but also those of all available smaller
timeframes. At that, if there are data of more than one timeframe for a certain
time span available simultaneously, the data of the smaller timeframe are used
for generation. Like the preceding method, this method generates control points
based on the OHLC data of the smallest available timeframe. To generate price movements
between control points, interpolation based on the predefined templates is used,
too, so the availability of one-minute data that cover the entire testing range
is extremely desirable. It may happen that several identical ticks are generated
one after another. In this case, duplicated quotes are filtered out, and the volume
of the last one of such successive quotes is fixed.
A possible large amount of tick data generated must be considered. This may influence consumption of operating system and speed of testing.
Using the Range of Dates when Modeling
The range of dates can be used for both Expert Advisor's testing and for generation of testing sequence of bars. There is often no need to generate data of the whole history, especially for Every Tick modeling, where the amount of unused data can be very large. So, if at the initial generation of testing sequence there was a possibility to use the range of dates, then bars exceeding the given range are not generated, but just overwritten in the output sequence. The data are not excluded from the sequence in order to be able to calculate indicators correctly for the whole history obtained. It must be noted that the first 100 bars are not generated either, this limitation does not depend on the set up range of dates.
Referencing M1 Timeframe
To check the accuracy of intrabar modeling, the minutes chart of September, 5 2007, between 10:00 and 11:00 p.m. will be used.
Since the mean tick volume of each bar within this range does not exceed 5, the
sequence was generated with the minimal use of interpolation. Practically all prices
are really existing OHLC prices.
Conclusions
Maximally precise testing can be performed and simulation veracity can be well assured if there are auxiliary smaller timeframes available that 100-% cover the timeframe under test. I.e., the problem of a qualitative every-tick testing turns into the search for detailed historical data...
Translated from Russian by MetaQuotes Ltd.
Original article: https://www.mql5.com/ru/articles/1511
 Testing Features and Limits in MetaTrader 4
 Features of Custom Indicators Creation
 What the Numbers in the Expert Testing Report Mean
 Features of Experts Advisors
- Free trading apps
- Over 8,000 signals for copying
- Economic news for exploring financial markets
You agree to website policy and terms of use
Once there's no smaller time frames then 1 minute, does the Every Tick method generates prices within an 1 minute bar at a 1 min time frame?
Why does the OPEN PRICE ONLY setting, generates orders at time =0 and at time =21:00?
dear all,
I tested my EA and my modeling quality is 90% (start from 1st february 2008 till 14th july 2008).
with use trade: "everytick...."
but when I extended the period of testing (older than january 2008),
the modeling quality shown "N/A".
Could anyone explain to me how the MetaTrader calculate the Modeling Quality so the result of modeling quality could change dramatically like the data I shown above??
Many thanks for your help.
Rgds,
Michael
Hi,
Since most of the articles regarding testing of trading algos are old I wonder if there is any updates. Particularly I'm interested in finding out if I can download the sample of rearranged (bootstrapped) forex rates to MetaTrader 4 and apply testing on those samples?
Thanks