
Mechanical Trading System "Chuvashov's Triangle"
Introduction
The article deals with possibilities of calculating the location of bars and trend lines' intersection time in prospect. Trend lines generation principles are close to those of Т. DeMark ones related to building TD at the last time intervals.
The offered application can be integrated into more complex trading system as its part, though it is a full-fledged automated Expert Advisor.
Basic principles of Building Intersecting Channels
The essence of "Chuvashov's Triangle" pattern lies in the idea that we always have the last two lower and two upper fractals at any point in time. Trend lines are drawn through the two upper and two lower fractals.
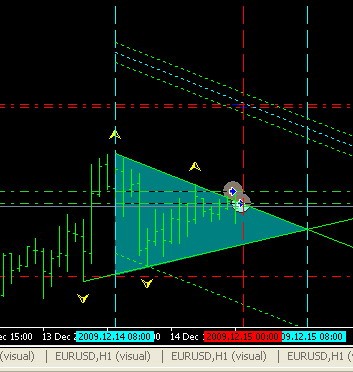
If these 2 lines intersect when continued to the right generating a triangle, then we have a pattern called "Chuvashov's Triangle". Intersection point of these two working lines is called Apex. Number all 4 fractals according to the sequence of their occurrence (left to right).
Draw the vertical line through the second left fractal. Also, draw the vertical line through the Apex. The number of candlesticks between these two vertical lines, including the candlesticks on the lines, is divided by 3, rounded, set to the left of Apex and the third vertical line is drawn.
The distance between the vertical drawn through the second fractal and the middle vertical will form the actual breakthrough area.
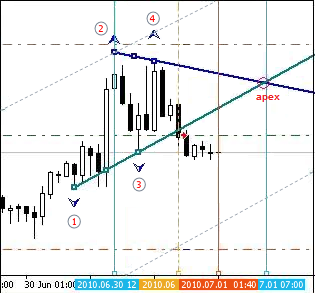
Fig. 1. Drawing the triangle
Let's move to drawing the triangle.
There may exist multiple positions of the last 4 fractals, at which it is either impossible to draw the triangle or it turns out to be too short or long.
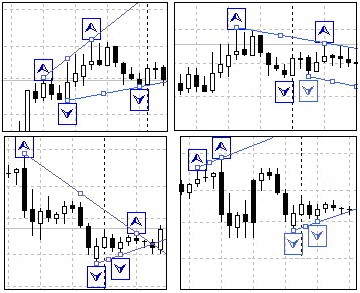
Fig. 2. Examples of fractals' unfavorable location
Therefore, it is necessary to introduce a number of conditions that are sufficient for drawing the triangle:
Some conditions of the triangle lines' convergence:
- The first fractals of the upper and lower lines should be spaced more than 20-30 pips apart by height (this value can be specified more exactly during the tests).
- The size between the first fractals of the upper and lower lines should be smaller than the size between the second fractals of these lines.
- The upper line's first fractal should be lower than the second fractal of the same line, while the lower line's first fractal should be above the lower line's second one.
These additional conditions have been considered in the program block of the pattern forming conditions.
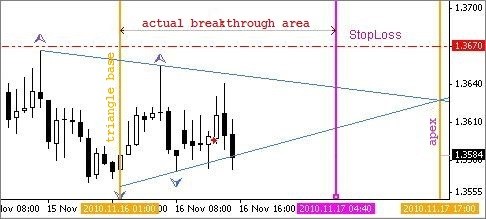
Fig. 3. Actual breakthrough area
It seems to be clear but let's move to Fig. 3. How can we define the number of the bar, at which the intersection of two working lines will occur?
At the moment of the line breakthrough, it is not yet known if this breakthrough is actual, though it is already the time to enter the market! Actual breakthrough area calculation block solves this issue using time parameters, i.e. defines intersection of working lines in the time range.
We know that each bar appears on the chart after a certain time. For example, new bars appear on H1 once an hour. Knowing the rate of price change per unit time of each of the two lines, it is possible to calculate the time of intersection. Knowing the amount of time from the Triangle's "base" up to the intersection moment, it is possible to calculate the number of bars (units of time) before intersection. Actual breakthrough area is defined in the same block.
The Expert Advisor is designed on a block-by-block basis.
The most frequently repeated functional blocks are typically located at the beginning of the program: opening and closing of positions, functions for drawing signs and lines. The main executable program also contains separate blocks, such as:
- Block for searching upper and lower fractals;
- Block of the pattern forming conditions;
- Block for the actual breakthrough area calculation;
- Block of position opening conditions.
The fragment of the functional blocks is shown below.
// --------------------------------------------------------------------+
void Op_Sell_Ch()
  {
  if(!OrderSend(Symbol(),OP_SELL,Lots,Bid,2,Ask+SL_S*Point,
      Bid-TP_S*Point," ",Magic,0,Red))
      { Print("  SELL order open error  # ",GetLastError()); }
      return(0);
     }
// --------------------------------------------------------------------+
void Op_Buy_Ch()
  {
  if(!OrderSend(Symbol(),OP_BUY,Lots,Ask,2,Bid-SL_B*Point,
      Ask+TP_B*Point," ",Magic,0,Blue))
      { Print("  SELL order open error  # ",GetLastError()); }
      return(0);
     }
//+--------------------------------------------------------------------+
void Close_S_Ch()
  {
  if(!OrderClose(OrderTicket(),OrderLots(),Ask,2,Aqua))
      {Print(" Cl.ord.# ",OrderTicket()," Error # ",GetLastError());}
      return(0);
     }
//+--------------------------------------------------------------------+
Searching for upper and lower reference points for building the triangle's working lines is provided in the bars' sorting loop according to the rules of fractals creation.
The numbering of reference points is performed considering that "indexing the elements of time series is conducted backwards, from the last to the first one. The current bar, which is the very last in the array, has an index of 0".
// ====================================================================+
// (upper and lower fractals searching block) ---------------------------+
   for (i=M;i<=N;i++) // reference points (fractals) searching loop
    {//loop b
   // searching for upper fractals -----------------------------------------+
   if(High[i]>High[i+1] && High[i]>High[i+2] &&
      High[i]>High[i-1] && High[i]>High[i-2])
     {// frac_b
      Tfnb++;   // counter
   // ----------------------------
     if(Tfnb==1)
           {             // for the 1 st fractal: price, index, time.
           TF1B=High[i]; Tf1b=i; timf1b=iTime(Symbol(),Period(),i);
      }//-counter_1
   // ----------------------------
          if(Tfnb==2)
           {//counter_2                       // price, index, time.
            TF2B=High[i]; Tf2b=i; timf2b=iTime(Symbol(),Period(),i); break;
           }//-counter_2
        // ----------------------------
     }//-frac_b
    }//-b loop
// --------------------------------------------------------------------+
   for (i=M;i<=N;i++) // reference points (fractals) searching loop
    {//s loop
   // searching for lower fractals ------------------------------------------+
   if(Low[i]<Low[i+1] && Low[i]<Low[i+2] &&
      Low[i]<Low[i-1] && Low[i]<Low[i-2])
     {// frac_s
      Tfns++;
     if(Tfns==1)
           {//counter_1                    // price, index, time.
           TF1S=Low[i]; Tf1s=i; timf1s=iTime(Symbol(),Period(),i);
           }//-counter_1
           if(Tfns==2)
            {//counter_2                    // price, index, time.
            TF2S=Low[i]; Tf2s=i; timf2s=iTime(Symbol(),Period(),i); break;
           }//-counter_2
     }//-frac_s
    }//- loop s
// ---------------------------(upper and lower fractals searching block)-+
The following conditions have been included to the working lines' convergence block to form the triangle:
- The first fractals should be spaced more than 20-30 pips apart;
- The first fractals of one working line should be less than the second fractals of another one;
- All 4 reference points are different from "0", i.е. they have real values;
- Time parameters of reference points should be different from "0";
- The first upper reference point is below the second upper one and the first lower point is higher than the second lower point;
- The difference between the lines' second fractals should not exceed 150 pips.
// ---------------------------------------------------------------------------+
   if((TF1B-TF1S)>25*Point &&
      Tf1b<=Tf2s && Tf1s<=Tf2b &&
      TF1B>0 && TF1S>0 && TF2B>0 && TF2S>0 &&
      timf1b!=0 && timf2b!=0 && timf1s!=0 && timf2s!=0 &&
      TF1B<TF2B && TF1S>TF2S &&
      (TF2B-TF2S)/Point<150)
    {// triangle drawing conditions
//===========================================================================+
After fulfilling preliminary conditions, calculate the rates of price changes for upper and lower working lines:
// -----------------------------------------------------------------------------+
   // -   (block Price change rate calculation)(upper and lower pips per one bar)
   if(TF1B!=TF2B) {RatePriceH=MathAbs((TF2B-TF1B)/(Tf2b-Tf1b));} // for the upper
   if(TF1S!=TF2S) {RatePriceS=MathAbs((TF1S-TF2S)/(Tf2s-Tf1s));} // for the lower
   // Print(" RatePriceS= ",RatePriceS); Print(" RatePriceH= ",RatePriceH);
// -------------------------------------(block Price change rate calculation)---+
At this point, 4 last fractals are located according to the triangle forming conditions though it is not clear yet how far the Apex will be and where the actual breakthrough area will be located. Apex calculation depends on the location of the second fractal out of the last four ones during their generation (from left to right on the chart).
The starting point for the long working line should be defined as a vertical's intersection point drawn through the second fractal of the short working line by the long one. In this respect, the further program algorithm is branched into two directions of the actual breakthrough areas calculation: "long" upper and "long" lower working line.
Basic code fragments concerning one of the directions are shown below. The second direction is calculated using the same algorithm.
// жжжжжжжжжжжжжжжжжжжжжжжжжжжжжжжж 1. upper working line is longer than the lower one  жжжжжжжжжжжжжжжжжжжжжжжжжжжжжжжжжжжжжж+
// - (block of searching for the working line's intersection point) ----------------------------------------------------------+
// If the upper working line is longer than the lower one - find the intersection point on 50 bars
   if(Tf2b>Tf2s && TF2B>TF1B && TF2S<TF1S)
    {// The upper working line is longer
     // the starting price for calculation of values at each bar of the upper working line
     Starting_Price_H=TF2B-RatePriceH*(Tf2b-Tf2s);
     // the starting price for calculation of values at each bar of the upper working line
     Starting_Price_S=TF2S;
     //the time of drawing the vertical line at the triangle's base
     time_starting=timf2s;
     // ------------------------------------
    for(int k=1;k<=50;k++)
    {//50b loop
     PricB[k]=Starting_Price_H-RatePriceH*k;      // minus fall rate
     PricS[k]=Starting_Price_S+RatePriceS*k;      // plus rising rate
                            //       if prices of the upper and lower lines' projections coincide or the price of the upper one
    if(PricB[k]<=PricS[k])  // has become less than that of the lower one, then there is the intersection with the working line
     {//there is the intersection
     P_Tria=PricB[k-1];                                        // working line intersection price (-1) - should be one bar less
     cut_left=k;  break;                                       //     number of bars from the base up to the intersection point
     }//-there is an intersection
    }//-50b loop
// -------------------------------------- (block of searching for working line's intersection point)--------------------------+
Now, we can start calculating the actual breakthrough area's time parameters:
// ---------------------------------------------------------------------------+
// - (block of calculating time intervals for the actual breakthrough area)-----------+
// Introduce two additional limitations:
// 1. The Apex should not be located more than 50 bars far from the triangle's base
// 2. The Apex should not be located closer than 15 bars to the triangle's base.
   if(cut_left<50 && cut_left>12)
    {//triangle with all limitations
     time_Apex=timf2s+cut_left*T_period;                        // Apex generation time
     //  divide the number of bars by three, take 2/3 and round them off to the integer
     // value: MathRound(cut_left/3*2) -number of bars for the actual breakthrough area
     time_bar_zona=time_starting+MathRound(cut_left/3*2)*T_period;          //area time
     //      pattern creation conditions fulfilled, actual breakthrough area calculated
     PatternTch=true;                          // "Chuvashov's Triangle" pattern formed
     }//-triangle with all limitations
// ------------(block of calculating time intervals for the actual breakthrough area)-+
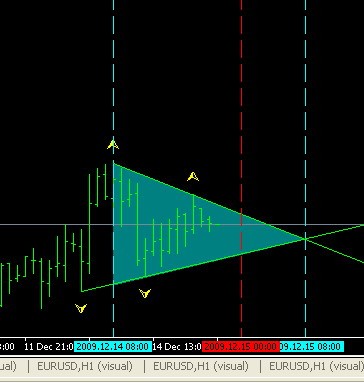
Now, after the pattern has been formed, the triangle drawing block can start its operation:
// - (block of drawing the triangle after the pattern has been formed) ---+ if(PatternTch==true) {//there is a pattern Del_Frb(); Del_Frs(); // delete previous upper and lower fractals CreateArrow_Frb(); CreateArrow_Frs(); // draw upper and lower fractals Create_Tr_H(); Create_Tr_S(); // draw upper and lower trend lines CreateLzona(); CreateLbasis(); CreateLApex(); // draw vertical lines CreateTriangleH(); // draw the triangle by the upper line ObjectDelete("TRS"); // delete the triangle drawing by the lower line // -----(block of drawing the triangle after the pattern has been formed)-+The screenshot below displays the operation of "Chuvashov's Triangle" pattern drawing block:
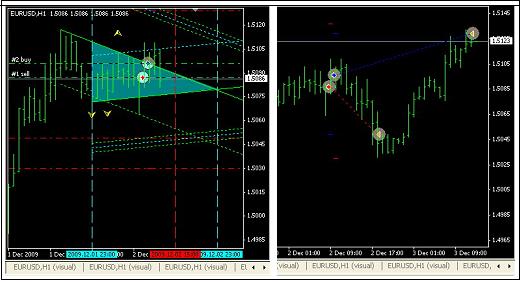
The block for opening positions steps into action then.
If conditions for position opening are fulfilled, the drawing of the channel with the surpassed working line is calculated. The channel is created.
StopLoss and TakeProfit will be calculated considering money management system requirements and position will be opened (in this case, the BUY one - see the screenshot below).
However, positions can be opened in both directions if conditions for opening in both directions are fulfilled (see the screenshot below).
The program then tracks the pattern's life time.
If the current time exceeds the time of the actual breakthrough, the program introduces a ban on opening positions. If the current time exceeds the Apex one, the program deletes all pattern drawings cleaning the chart from the already unnecessary signs and lines.
Pattern's life block code is shown below.
// - (block defining the pattern's life time) -------------------------------+
// if the current time exceeds the actual breakthrough area boundary's time, the pattern loses its power
   if((TimeCurrent()-time_bar_zona)>=T_period)
    {
     PatternTch=false; // the pattern is outdated - introduce the ban on opening positions
    }
    // after the current time exceeds the Apex one
    if((TimeCurrent()-time_Apex)>=T_period)
     {
      // delete pattern signs and lines from the chart
      Del_Frs(); Del_Frb(); Del_TrLin();
      // delete the lines of channel profit size by the upper working line
      ObjectDelete("Tr_B1h"); ObjectDelete("Tr_B1hh"); ObjectDelete("Tr_B1hs");ObjectDelete("Tr_B1s");
      // delete the lines of channel profit size by the lower working line
      ObjectDelete("Tr_S1s"); ObjectDelete("Tr_S1sh"); ObjectDelete("Tr_S1ss");ObjectDelete("Tr_S1h");
      // delete the vertical lines of the actual breakthrough area
      ObjectDelete("L1");ObjectDelete("zona");ObjectDelete("Ap");
      ObjectDelete("TRH"); ObjectDelete("TRS");
     }
// --------------------(block defining the pattern's life time)-+
Results of this block operation are displayed on the right side of the previous screenshot.
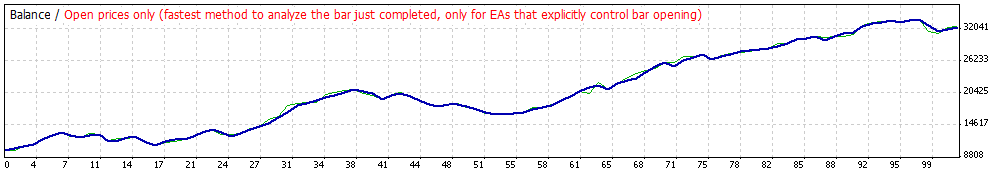
The Expert Advisor presented here showed positive result as a mechanical trading system during the automatic testing:
- Gross profit and gross loss ratio P/F = 38869/16480 = 2.36 (more than 2);
- Number of deals = 101 (not less than 100);
- Drawdown percetnage = 25,18% (see attached file).
The short conclusion is as follows:
The described technique can be used by traders as a trading system component but position opening filters should be added as an improvement.
The filters proposed herein above can be improved as recommended by the author of the technique Stanislav Chuvashov.
Notes to the attached files:
- Triangle_H1_v46.mq4 – offered МТС
- Strategy_Tester_Report_46.zip – test result
- table_3.zip – for fans of analysis
Translated from Russian by MetaQuotes Ltd.
Original article: https://www.mql5.com/ru/articles/1364
 LibMatrix: Library of Matrix Algebra (Part One)
 Reading RSS News Feeds by Means of MQL4
 Three Aspects of Manual Trading Automation. Part 1: Trading
- Free trading apps
- Over 8,000 signals for copying
- Economic news for exploring financial markets
You agree to website policy and terms of use
Hello,
Please see images:
Unless you have a better understanding, the correct would be:
The size between the first fractals of the upper and lower lines should be HIGHER than the size between the second fractals of these lines.
The upper line's first fractal should be UPPER than the second fractal of the same line, while the lower line's first fractal should be BELOW the lower line's second one.
Following this thought,the text of image below also should be corrected:
So:
Please, if I'm wrong, then I'm sorry!!! ;)
hello there,
your article is very very interesting, thank you for sharing, I read this theory, it's owesome and also the automating work you did is very important, I test out the expert in my demo account but unfortunality doesnot open any positions, I wonder about the setting, can you help please, thank you in advance.