Crazy Color Cloud
- Indicateurs
- Igor Gerasimov
- Version: 2.2
- Mise à jour: 10 avril 2023
- Activations: 5
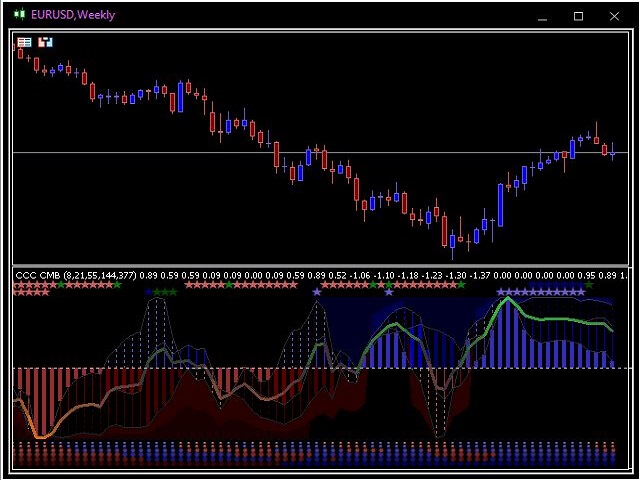
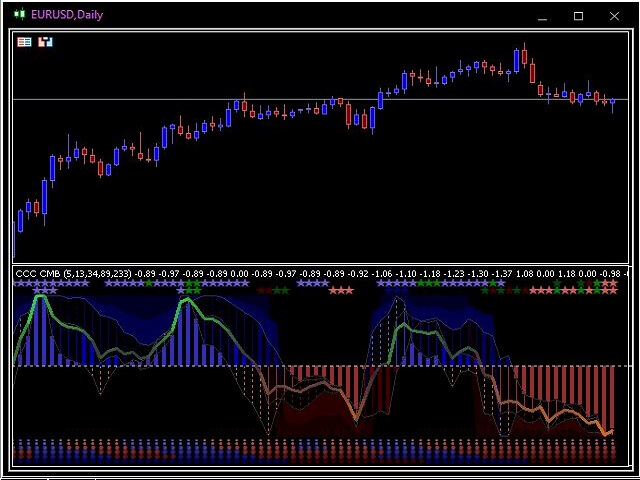
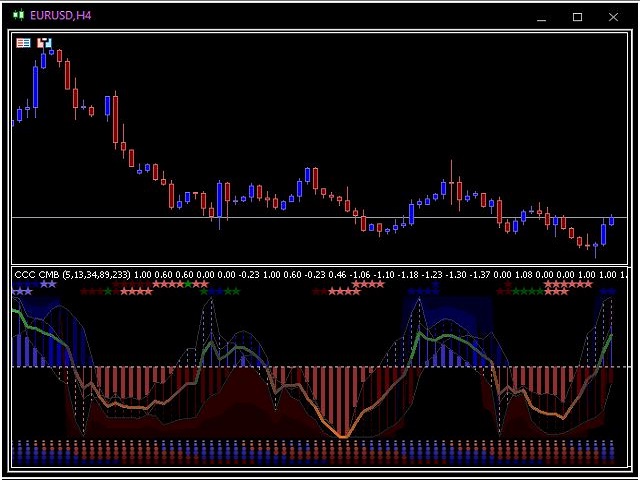
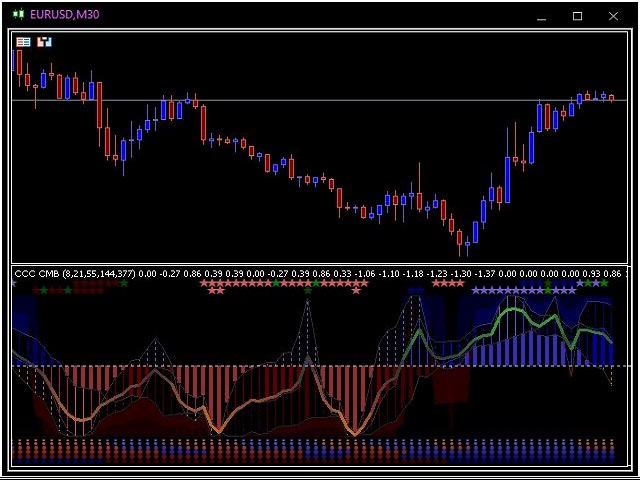
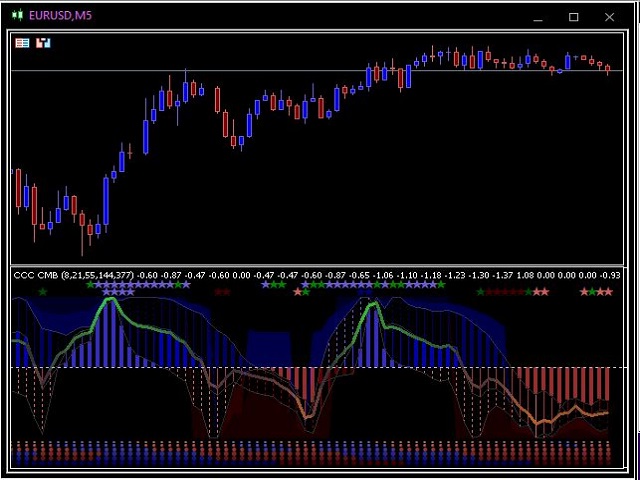
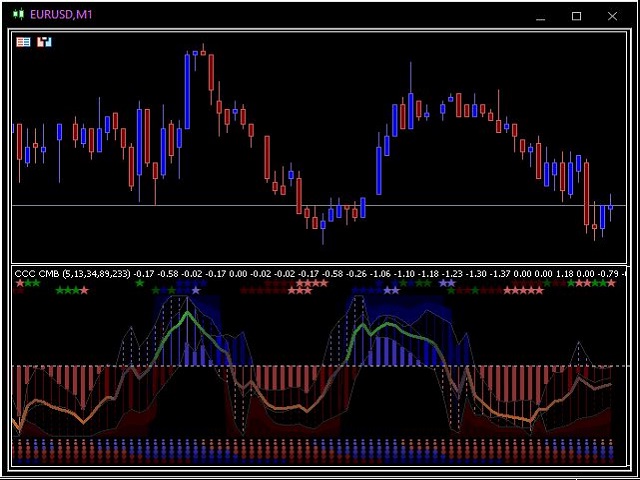
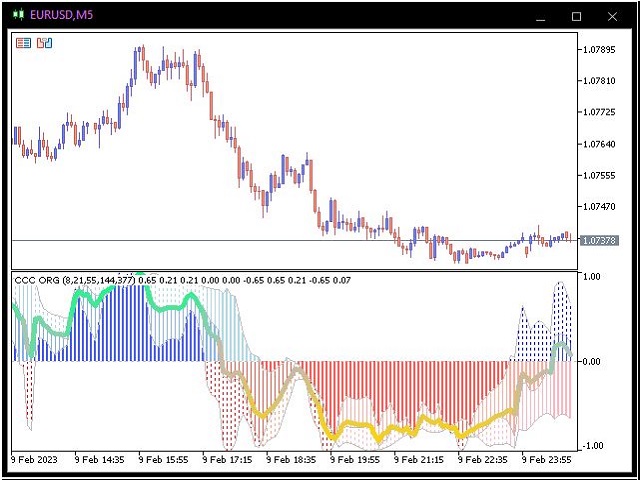
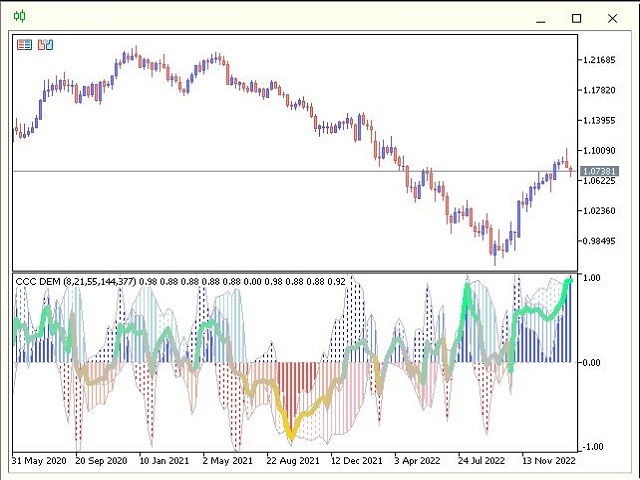
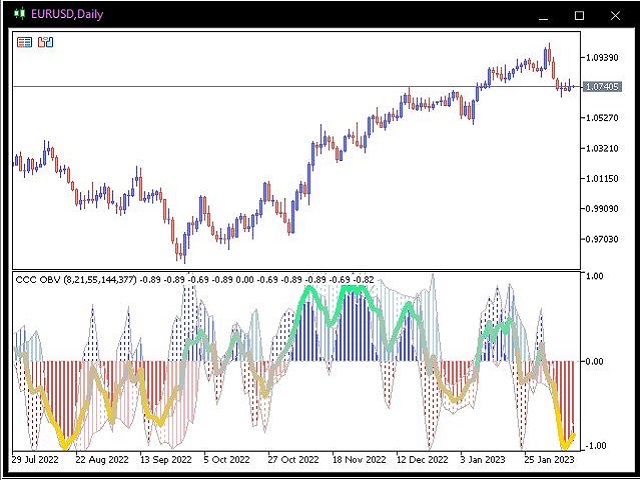
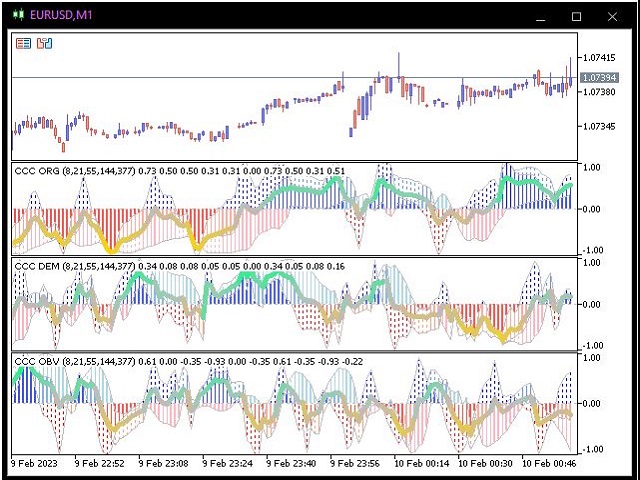
Cet indicateur affiche des informations de prix filtrées
sous la forme de trois histogrammes colorés et d'une ligne colorée commune.
C'est un indicateur très coloré et magnifique.
Idéal pour déterminer la force et la direction du mouvement des prix.
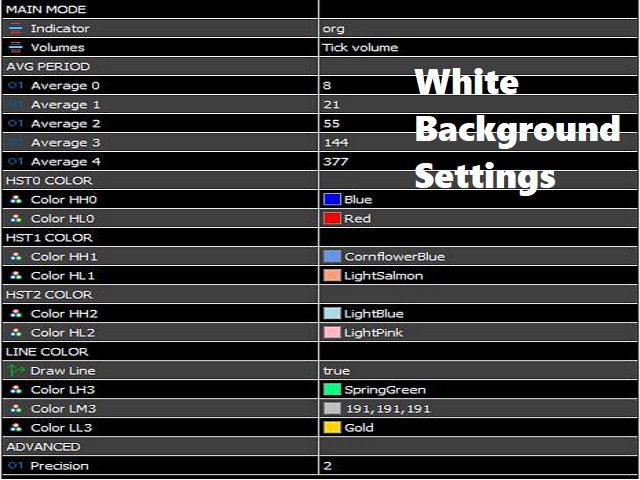
Cet indicateur a des réglages très simples :
1) choix de trois options pour le calcul de l'indicateur :
- original,
- démarqueur,
- volume d'équilibre.
2) sélection de cinq périodes différentes.
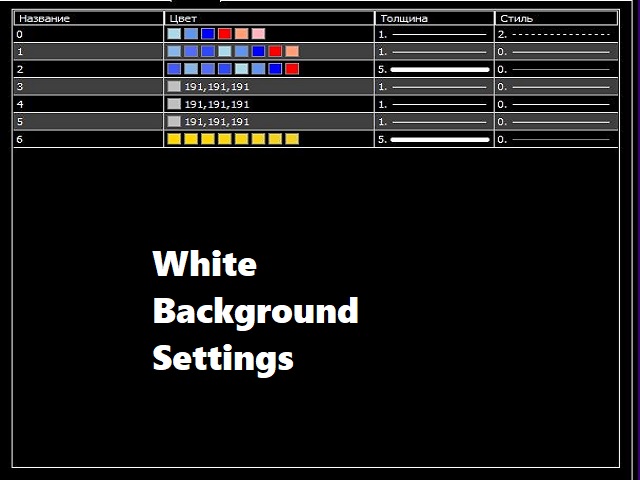
3) sélection de la couleur affichée.
4) choix de la précision.
//////////////////////////////////////////////// /////////
J'espère que cet indicateur vous sera très utile pour réussir vos échanges.
Bonne chance.