Little trade helper
- Indicateurs
- Profalgo Limited
- Version: 1.0
- Activations: 10
Little Trade Helper is a fine tool for manual traders.
When switching to another timeframe, the indicator will immediately adjust and re-calculate all levels, or you can choose (in the parameters) to always calculate the levels based on a fixed timeframe. That way, no matter which timeframe you set on the chart, the levels will remain the same.
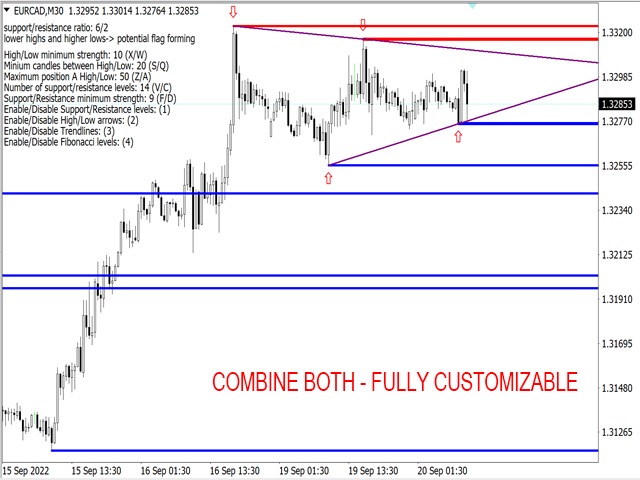
The indicator will also put out some basic information about what the price is doing. For example “uptrend”, “downtrend”, “potential flag is forming” etc…
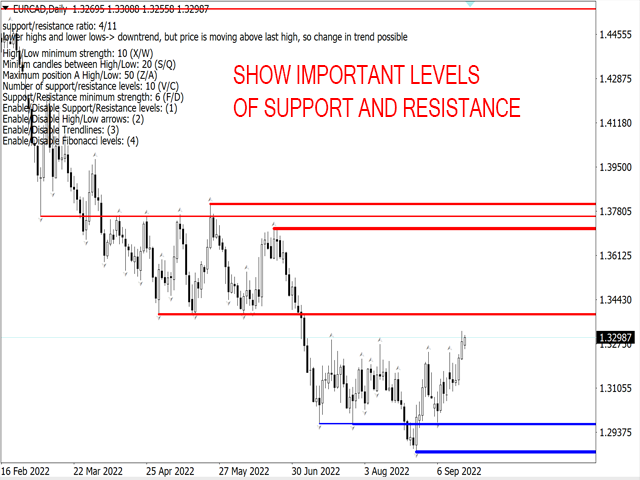
Support/Resistance levels
These levels are drawn on strong highs and lows of the past. You can configure how strong the levels must be, before drawing them, and you can also choose how far to go back in history.
The levels drawn will be (by default) “blue” for support levels, and “red” for resistance levels. The thickness of the line will determine how strong the level is.
Parameters:
Number_of_levels: this will determine how many lines to draw. The more lines, the more it will go back in history
Line Thickness: Default is set to “variable”, based on the strength of the level. But you can force them all to be thin or bigger. The most recent support and resistance will always be drawn a bit thicker though
Timeframe_sup_res: either choose the timeframe of the chart, or a fixed one to use, no matter which timeframe is selected on the chart
Support/Resistance minimum strength (0-10): the higher the value, the more strict the levels will be, that are drawn on the chart
HIGH/LOW settings
The Highs and Lows, which you can set up here, are used for A) drawing the trend lines, and B) for the comment about the price (“uptrend”, “downtrend”, etc..)
Parameters:
MinimumCandlesBetweenHL: the minimum number of candles between the 2 consecutive highs or 2 consecutive lows drawn on the chart.
High/Low Minimum strength (0-10): determines how strong a high or low must be, to be selected as a valid high or low
Maximum position first High/Low: to limit the indicator of going to far in history for selecting the most current high or low
High/Low Arrow size: size of the arrow drawn on the chart
Fibonacci settings
The indicator can also draw a simple Fibonacci graph on the chart, based on the highs and lows set up above
Trendlines
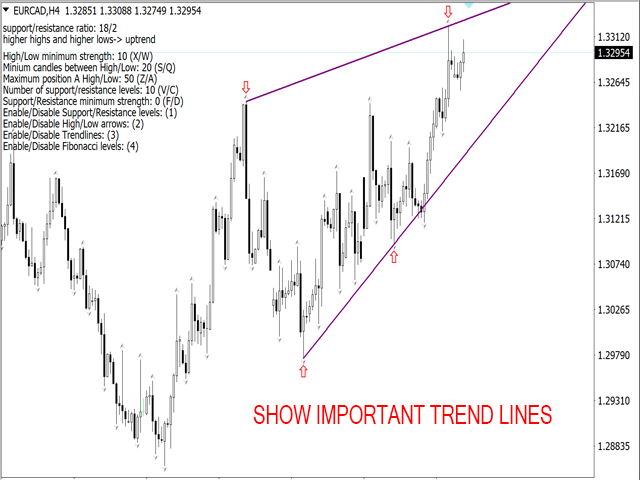
Trendlines can be drawn, based on the highs and lows set up above
Color settings
Here you can set the colors of all graphical elements.
Key Bindings
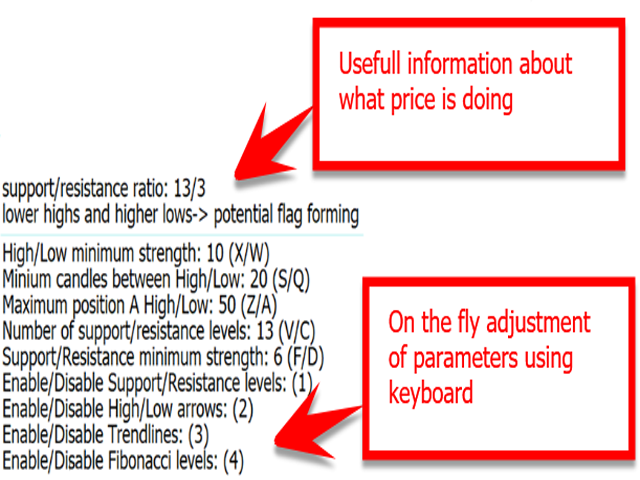
You can bind keyboards keys to change “on the fly” certain parameters that will determine the support/resistance levels calculation and high/lows. On the top left of the chart, there will be a menu showing all the keys that are linked to which action.
(NOTE: The “enable/Disable” keys (1,2,3 and 4) are not the numbers on the numpad, but on the keyboard above AZERTY (or QWERTY))

