Volatility analyzer with alerts for MT5
- Indicateurs
- STE S.S.COMPANY
- Version: 1.0
- Activations: 10
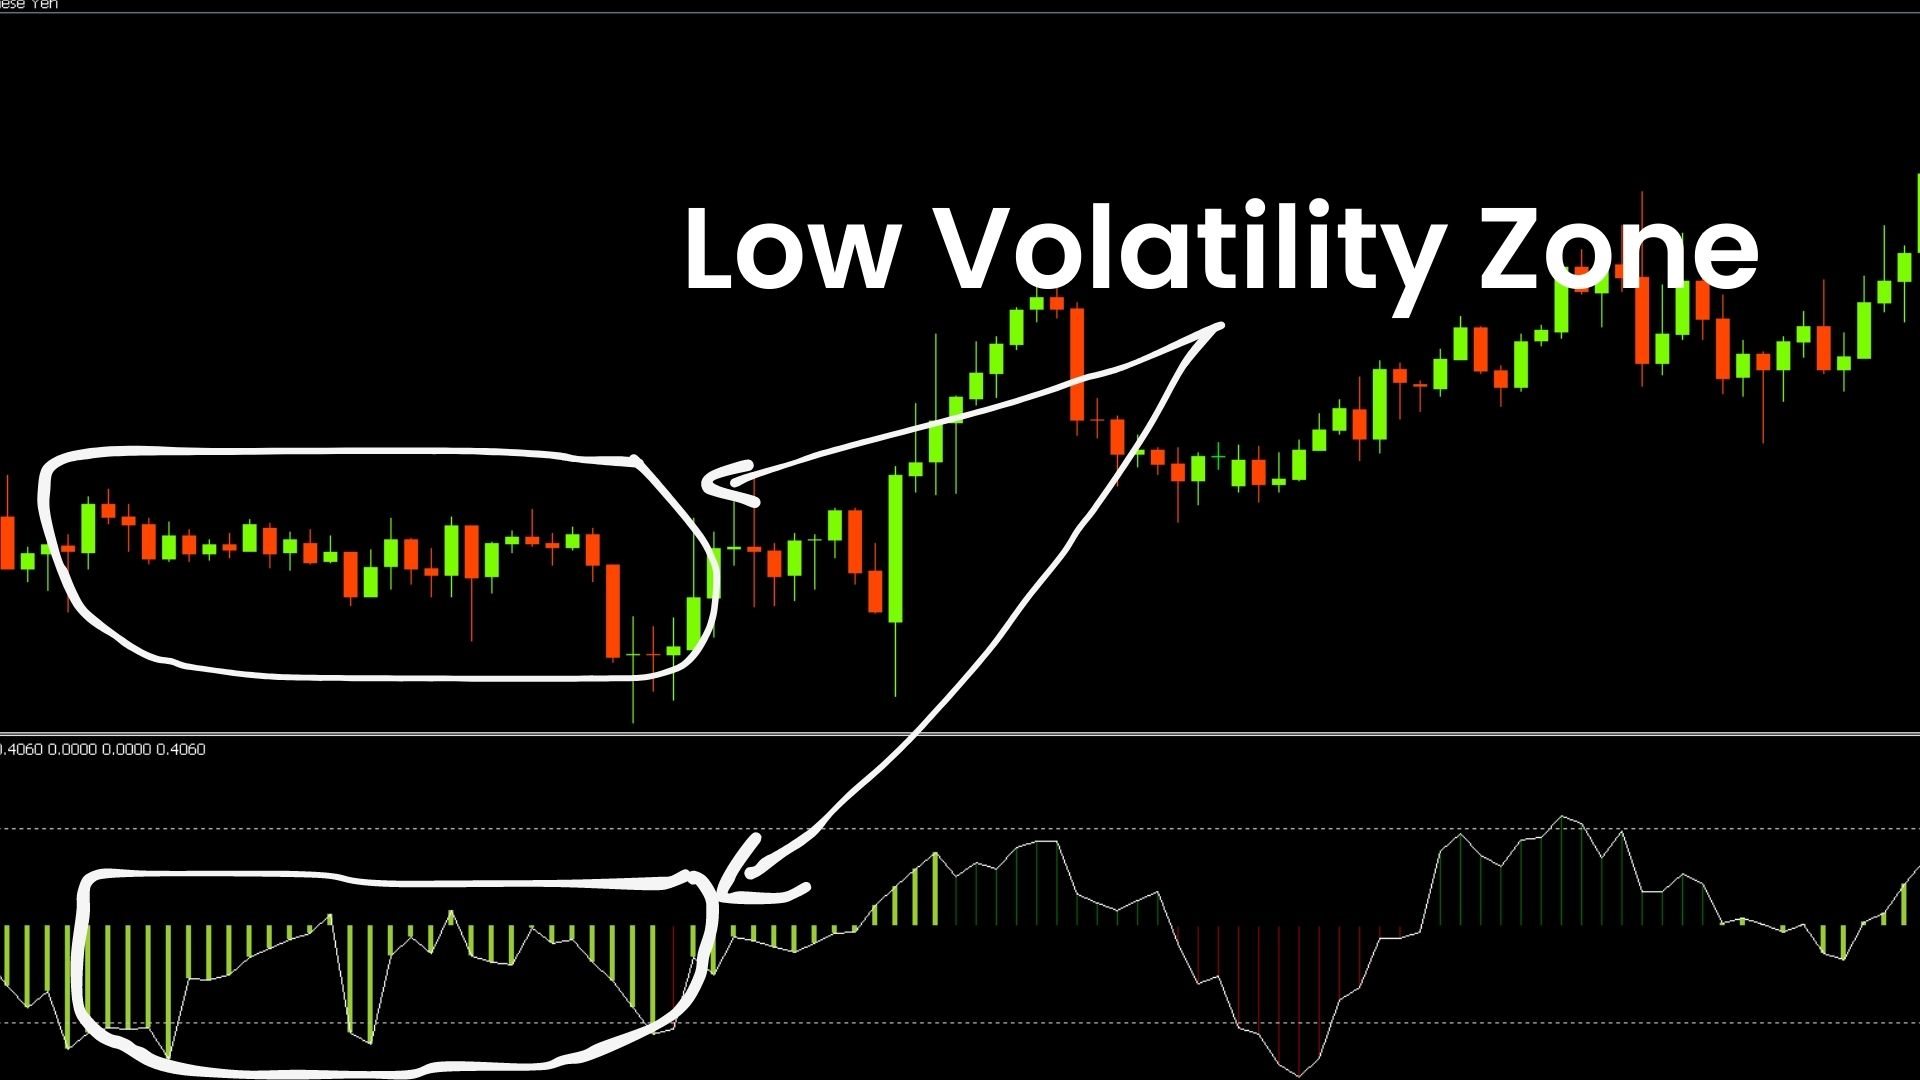
L'analyseur de volatilité est un indicateur de momentum, qui capitalise sur la tendance des prix à éclater fortement après s'être consolidés dans une fourchette de négociation étroite. L'indicateur utilise également un oscillateur de momentum pour montrer la direction attendue du mouvement lorsque la compression se déclenche. Cet histogramme oscille autour de la ligne zéro, l'augmentation de l'élan au-dessus de la ligne zéro indique une opportunité d'achat long, tandis que l'élan tombant en dessous de la ligne zéro peut indiquer une opportunité de court-circuit.
OFFRE À DURÉE LIMITÉE : L'indicateur est disponible pour seulement 50 $ et à vie. (Prix d'origine 125$)
Principales caractéristiques
- Détecteur de tendance latérale.
- Détecteur de faible volatilité.
- Détecteurs de haute volatilité haussière et baissière.
- Travailler avec tous les délais et toutes les paires.
- Fournissez des alertes contextuelles et des alertes de notification Push.
Contact
Si vous avez des questions ou si vous avez besoin d'aide, n'hésitez pas à me contacter par message privé.
Avertissement
Tous nos indicateurs et outils sont disponibles uniquement via la boutique officielle Metatrader (MQL5 Market).
Indicateurs de prime
En accédant à notre profil MQL5, vous pouvez retrouver tous nos indicateurs gratuits et premium. Pour accéder à notre profil, cliquez ici.
Auteur
SAYADI ACHREF , ingénieur logiciel fintech et fondateur de Finansya Lab.


Excellent and Accurate indicator and very supportive seller!