Weis Wave Double Side
- Indicateurs
- Eduardo Da Costa Custodio Santos
- Version: 1.0
- Activations: 5
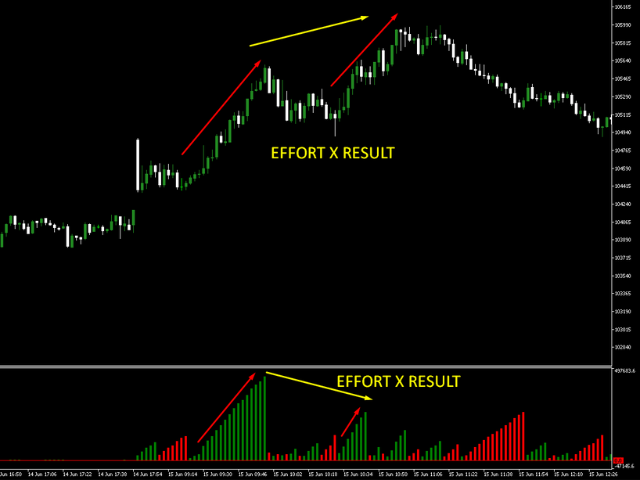
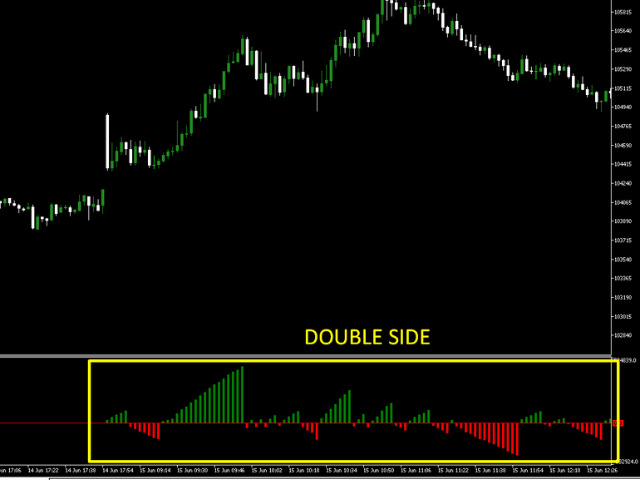
L'indicateur latéral Weis Wave Bouble pour MT5 fait partie de la boîte à outils (Wyckoff Academy Wave Market) L'indicateur latéral Weis Wave Bouble pour MT5 a été créé sur la base de la Weis Wave déjà établie créée par David Weis. L'indicateur Weis Wave Double Side lit le marché par vagues comme cela a été fait par R. Wyckoff en 1900. Il aide à identifier l'effort x le résultat, la cause et l'effet, et l'offre et la demande Son différentiel est qu'il peut être utilisé en dessous de l'axe zéro, améliorant encore plus lecture de l'opérateur indicateur créé sur la base de la théorie de R. Wyckoff voir les images comment l'indicateur est lu.