Round Price Levels MT5
- Indicateurs
- Robert Gerald Wood
- Version: 1.0
- Activations: 5
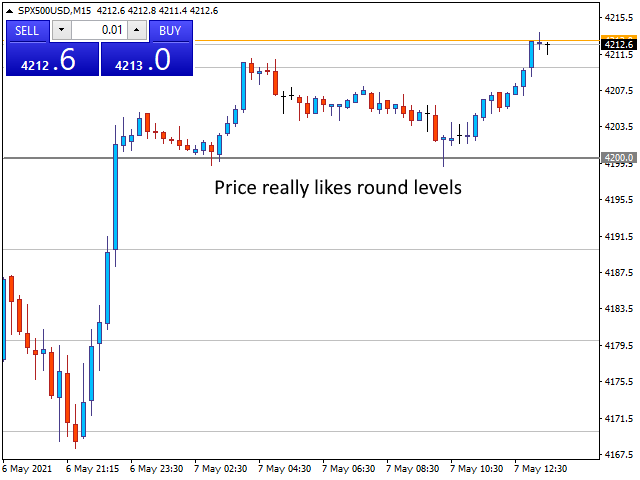
Les marchés aiment vraiment les chiffres ronds et ils agissent souvent comme un soutien dans un marché en baisse ou comme une résistance lorsque les prix augmentent.
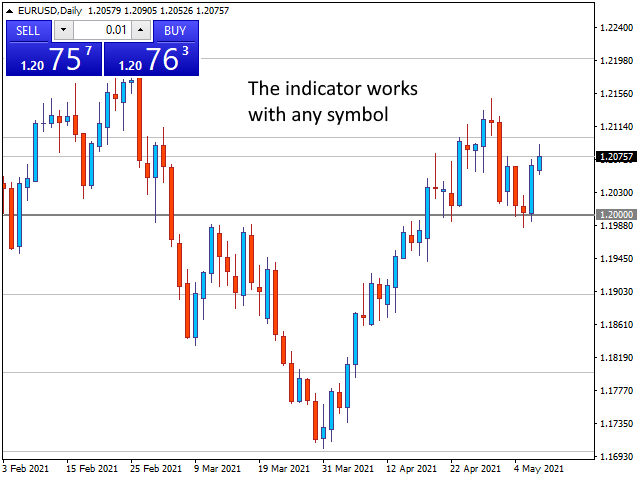
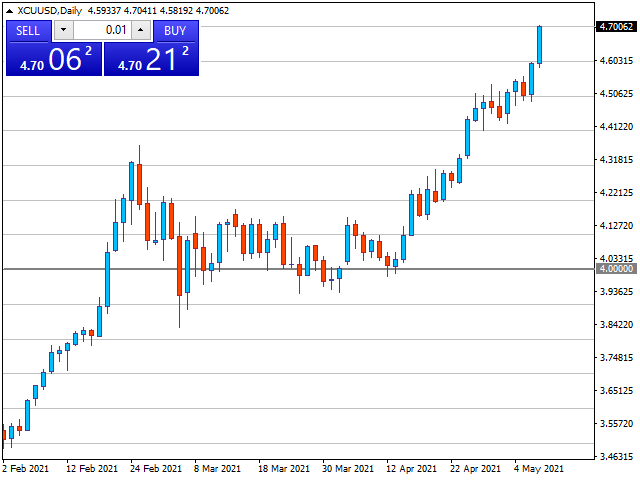
Cet indicateur est conçu pour dessiner des niveaux de prix à des valeurs rondes. Il le fait automatiquement, mais vous avez également la possibilité de remplacer cela et de déterminer les niveaux que vous souhaitez voir.
Un niveau rond peut être aussi simple que des étapes de 10, donc 10, 20, 30 etc. ou si vous travaillez avec le Forex, peut-être que vous voulez voir des changements à 0,1 ou 0,01.
L'indicateur dessine deux classes de ligne, Major et Minor, chacune avec un format différent. Cela vous permet de voir les changements entre deux changements de niveau différents en même temps.
Alerte
L'indicateur inclut la possibilité d'émettre des alertes aux niveaux de prix majeur, mineur ou les deux lorsque le prix se situe à une distance configurable.
Configuration automatique
Par défaut, l'indicateur déterminera un niveau approprié pour les prix majeurs et mineurs. Il le fait en utilisant un paramètre DensityIndex configurable qui contrôle le nombre de lignes que vous souhaitez voir à l'écran à tout moment.
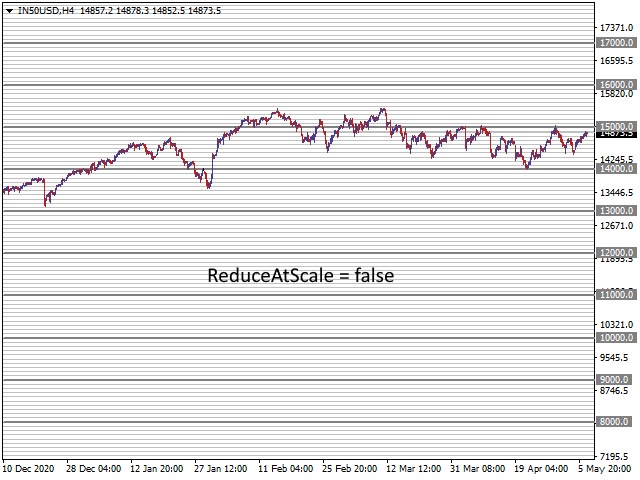
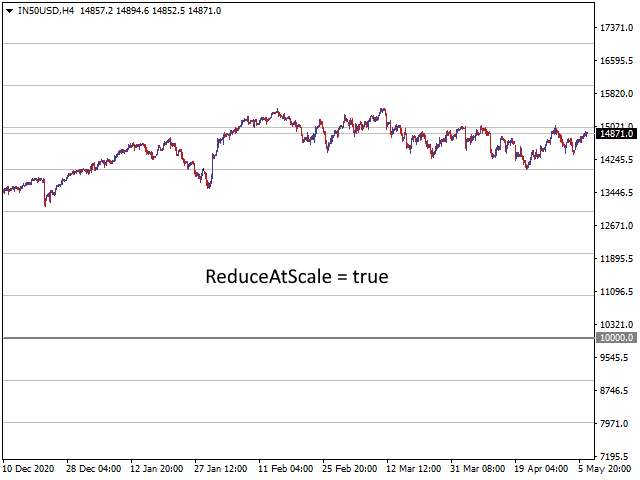
Si vous définissez votre propre mise à l'échelle, à l'aide des paramètres MajorGap et MinorGap, vous pouvez toujours obtenir que l'indicateur limite le nombre de lignes dessinées à l'écran en utilisant le paramètre ReduceAtScale.
Veuillez consulter les captures d'écran pour une idée plus claire de cette fonctionnalité.
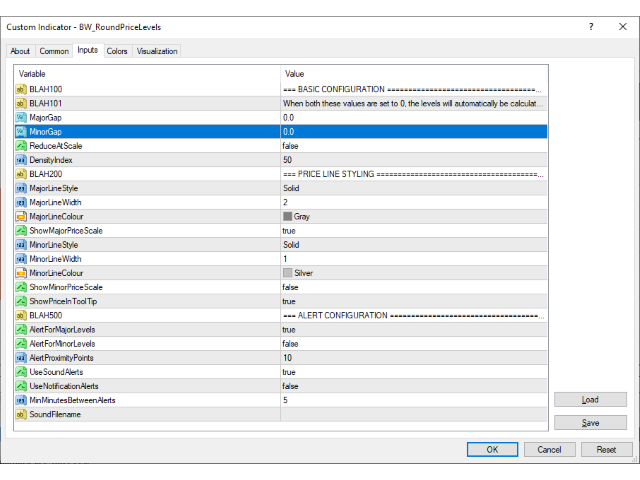
PARAMÈTRES
CONFIGURATION DE BASE
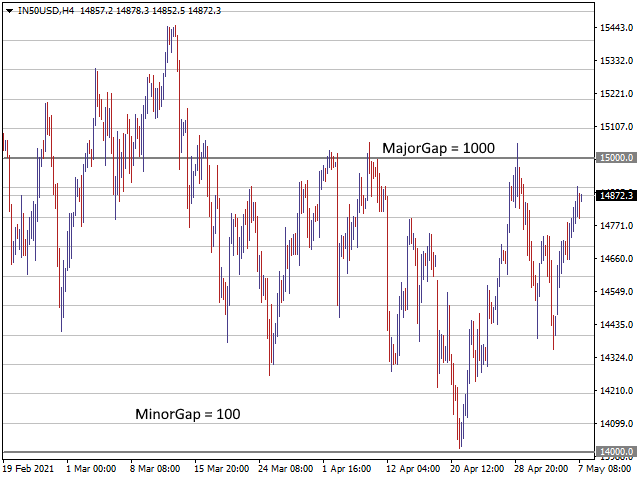
Écart majeur
Lorsqu'il est réglé sur 0,0, l'indicateur calculera automatiquement une échelle appropriée
Écart mineur
Lorsqu'il est réglé sur 0,0, l'indicateur calculera automatiquement une échelle appropriée
Réduire à l'échelle
Lorsqu'il est vrai, l'indicateur prendra en compte l'échelle du graphique et réduira le nombre de niveaux dessinés si nécessaire.
Indice de densité
Nombre maximal de valeurs mineures avant réduction automatique.
STYLE DE LA LIGNE DE PRIX
MajorLineStyle
Le style de ligne à tracer, plein, pointillé, pointillé. Sélectionnez dans la liste des valeurs prises en charge par le système.
MajorLineWidth
La largeur de la ligne à tracer. Si vous souhaitez utiliser un style autre que SOLID, cette valeur doit être égale à 1.
MajorLineColour
La couleur pour tracer la ligne.
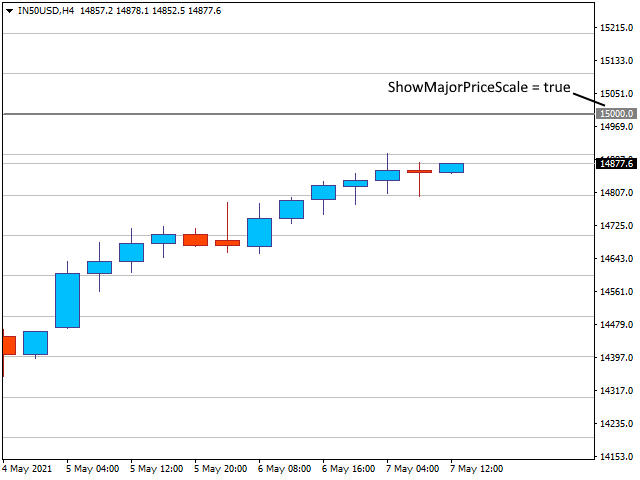
AfficherMajorPriceScale
Lorsque c'est vrai, les principaux niveaux de prix seront mis en surbrillance dans l'échelle de prix à droite du graphique.
Style de ligne mineure
Le style de ligne à tracer, plein, pointillé, pointillé. Sélectionnez dans la liste des valeurs prises en charge par le système.
MinorLineWidth
La largeur de la ligne à tracer. Si vous souhaitez utiliser un style autre que SOLID, cette valeur doit être égale à 1.
Couleur de la ligne mineure
La couleur pour tracer la ligne.
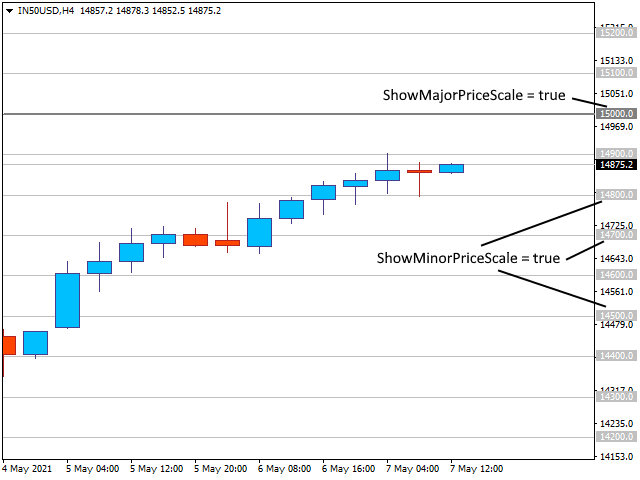
Afficher l'échelle de prix mineure
Lorsque cela est vrai, les niveaux de prix mineurs seront mis en évidence dans l'échelle de prix à droite du graphique.
AfficherPriceInToolTip
Lorsqu'il est vrai, la valeur du prix de la ligne s'affichera sous forme d'info-bulle lorsque le curseur de la souris la survolera. Utile si vous avez désactivé les échelles de prix.
CONFIGURATION D'ALERTE
AlertForMajorLevels
Lorsqu'il est vrai, déclenche des alertes pour la proximité des prix avec les principaux niveaux de prix
AlertForMinorLevels
Lorsque vrai, déclenche des alertes pour la proximité des prix avec les niveaux de prix mineurs
Points de proximité d'alerte
À quel point le prix actuel doit être proche d'un niveau pour déclencher une alerte. L'alerte est déclenchée si le prix actuel se situe dans les points AlertProximityPoints d'un niveau.
Utiliser les alertes sonores
Émettre un son lorsqu'une alerte est déclenchée.
Utiliser les alertes de notification
Envoyez une notification à l'aide du système de notifications MT4 lorsqu'une alerte est déclenchée. Voir le menu principal Outils> Options puis sélectionnez l'onglet Notifications et configurez-le. Vous aurez également besoin de l'application Apple ou Android.
MinMinutesBetweenAlerts
Après avoir déclenché une alerte, le système attendra ce nombre de minutes avant de permettre à une autre alerte de se déclencher.
NomFichierSon
Un son d'alerte est intégré, mais si vous souhaitez en utiliser un autre, vous pouvez spécifier le nom du fichier ici. Les fichiers doivent se trouver dans le dossier MQL/Files du terminal.