• Aperçu
  • Avis (2)
  • Commentaires (3)
  • Nouveautés

MR Range Breakouts 5

5
" A trading range occurs when a financial instrument trades between constant high and low prices over a period of time. The upper part of the trading range of a financial instrument often provides price resistance, while the lower part of the trading range usually offers price support.  Traders can enter in the direction of a breakout or breakdown from a trading range... "

This is the "Classical Theory" understanding of ranges. We have a different understanding of the nature of ranges and the processes that occur within them. Therefore, we at "Masters of Risk" created our indicator to cover all our requirements. "MR Range Breakouts" indicator was created from scratch by us according to the author's methodology. It is based on the concept of "Auction Market Theory" developed by J. Peter Steidlmayer and "Locked-in Range" market analysis method developed by Tom Leksey. Both concepts largely overlap with our understanding of the processes in the "Range" and show how market participants interact. Since there is no established terminology for ranges in the "Classical Theory" we will use our own terminology!!!

To give you some idea, we will briefly introduce the processes that take place in the range:
1. When we have two extremes and the price has tested at least 75% of the distance between them in the form of a corrective movement, we say that a “Balance” has been established between buyers and sellers. Usually, the intentions to achieve a "Balance" of prices are known only by the "Big" players in the markets. If the price continues or makes a new impulse, renews one of the extremes and does not return to them again in the form of a correction, we say that the "Balance" is broken and we now have an "Imbalance".
2. If, after reaching a "Balance" between buyers and sellers, the price continues to move between two price extremes, we say that a "Range" has developed between the two price extremes. Here, along with the "Big" market players, the "Professional" traders also enter positions.
3. When the prices remain in the "Range" for a longer time, this "Range" is also seen (perceived) by the "Non-professional" market participants. Usually their stop-losses are placed above or below the boundaries of the "Range". This is where we say we have an "Open Range" because all market participants can actively enter positions and trade the distance between the two extremes that define the upper and lower boundaries of the "Range."
4. When enough participants accumulate in the "Range" with their stop-losses, some of the "Big" players try to close the "Range" of the prices by exiting it at the expense of these stop-losses. If they succeed and then there is a "correction" beyond the "Range", we say that the "Open Range" is locked by these "Big" players and we have a "Range of Buyers" or a "Range of Sellers".
5. If another portion of the "Big" players decide they don't like it and return the price to the "Range" and test a minimum of 75% of the distance between the two extremes that define the boundaries of the "Range", then we say we have an "Extending" of the boundaries of the "Open Range". In this case, the distance between the upper and lower boundaries of the "Open Range" is updated and a new range test distance of 75% is determined.
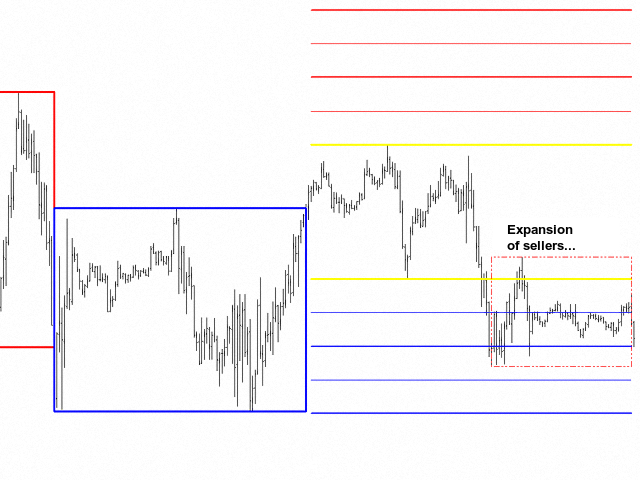
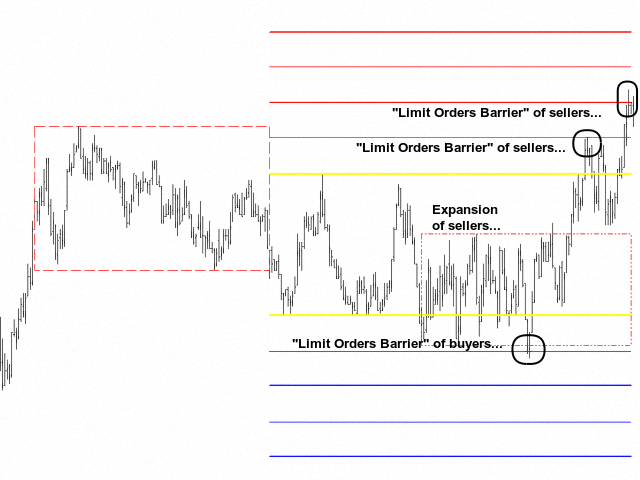
6. If these “Big” players fail to return the price to at least 75% after exiting the range, then we say that there is a struggle for dominance of different groups of "Big" players. This usually happens at the upper or lower boundaries of the "Open Range" and between the "Limit Orders Barriers". Then we say that we have an "Expansion" of sellers or an "Expansion" of buyers.
7. According to our experience with the indicator, the best places to enter a position are in the "Limit Order Barriers" area in the direction of the trend. For example, if we have a downtrend, we are looking for a sell entry in the "Limit Orders Barriers" area of sellers, and accordingly, if we have an uptrend, we are looking for a buy entry in the "Limit Orders Barriers" area of buyers. Of course, all our decisions must be confirmed by other indicators in these zones.

What the indicator shows:
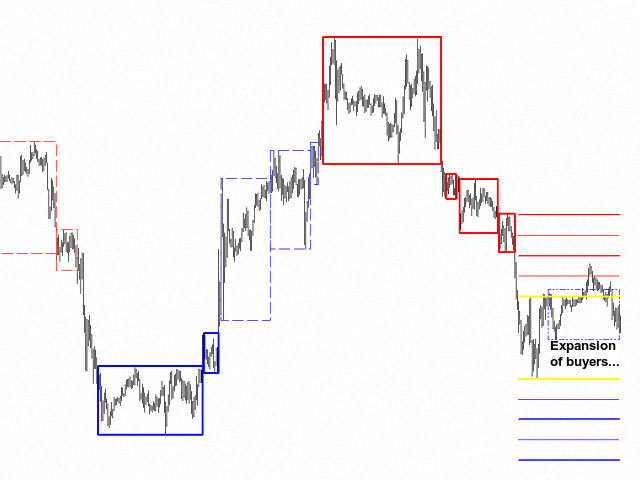
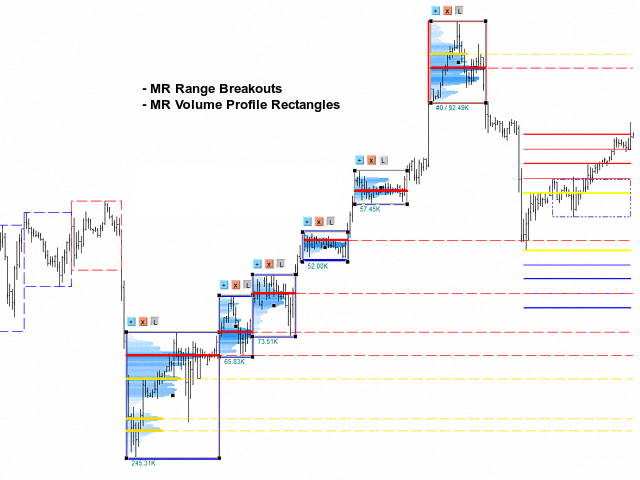
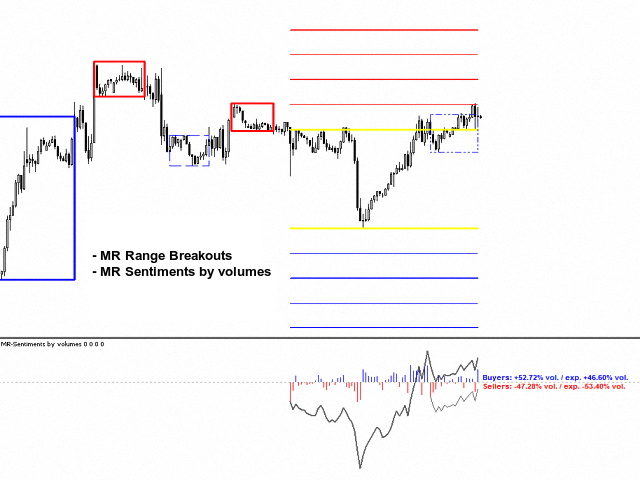
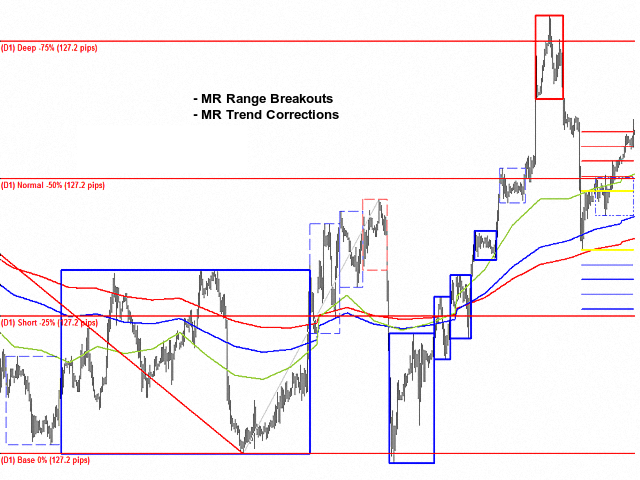
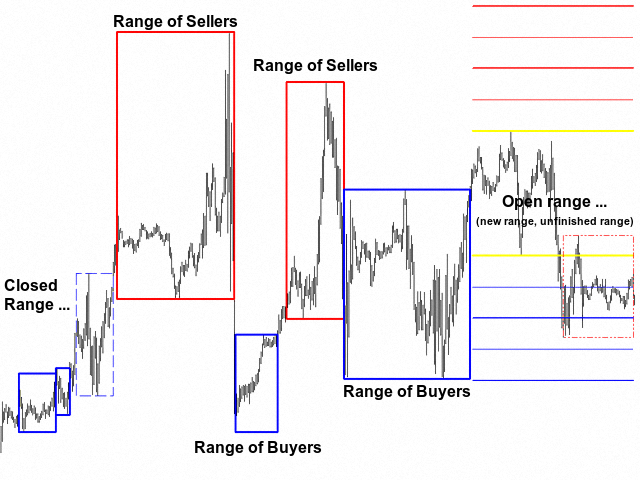
  • "Red" rectangles show "Ranges of Sellers", where buyers remain in "Locked-in Range", and sellers win. If you place a volume profile in "Range of Sellers", in the area below the "POC" volume there are buyers locked in range.
  • "Blue" rectangles show "Ranges of Buyers", where sellers remain in "Locked-in Range", and buyers win. If you place a volume profile in "Range of Buyers", in the area above the "POC" volume there are sellers locked in range.
  • "Dashed" rectangles show closed "Ranges" - the places where the price absorbed the volumes in the Ranges.
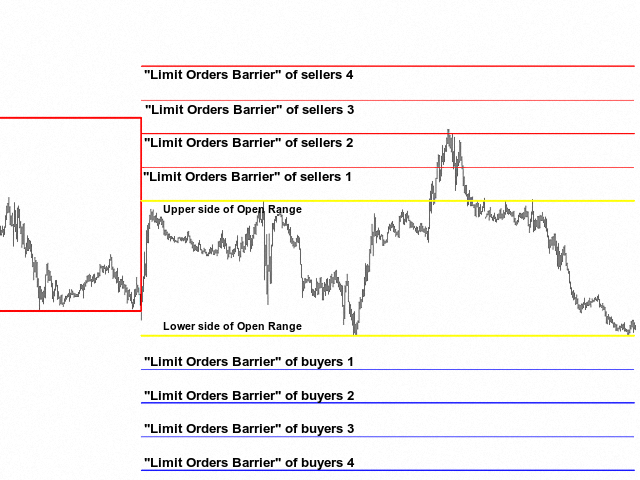
  • "Yellow" lines show the upper and lower boundaries of the "Open Range" - it is not yet determined whether this will be a range of buyers or sellers. "Open Range" is a new and not yet finished range. In it, positions are recruited for the "Big" players, there is a struggle for initiative between the "Big" players, various tools are used in the confrontation between them. Unfortunately, this is also the place where "non-professional" market participants lose their money, because they don't understand the processes that go on in the range...
  • "Blue (dash dot dot)" rectangle indicates the beginning of the buyers "Еxpansion" initiative. It shows the struggle between the "Big" players in the market, the potential expansion of the "Open Range" boundary or the possible formation of a new "Open range".
  • "Red (dash dot dot)" rectangle indicates the beginning of the sellers "Еxpansion" initiative. It shows the struggle between the "Big" players in the market, the potential expansion of the "Open Range" boundary or the possible formation of a new "Open range".
  • "Red" lines above the "Open Range" indicate the possible areas of "Limit Orders Barriers" of sellers.
  • "Blue" lines below the "Open Range" indicate the possible areas of "Limit Orders Barriers" of buyers.
"Limit Orders Barrier is a structure that is designed to restrict price movement in any direction by constantly placing limit orders against the movement. Typically observed above and below accumulation (range, balance)."

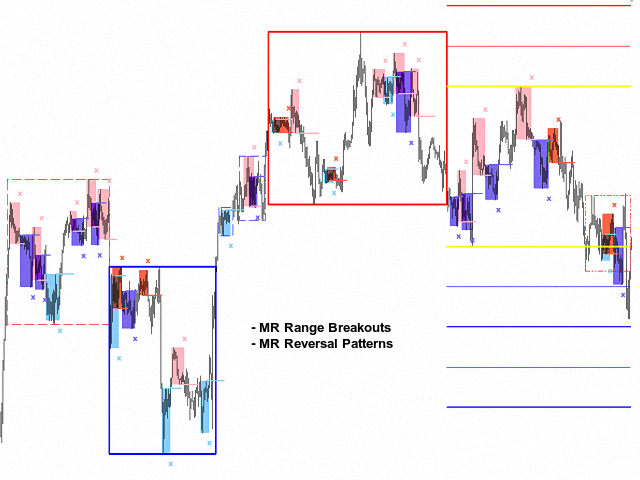
        • In combination with the "MR Reversal Patterns" indicator, you can see how buyers and sellers are distributed in the "Range". Since every trader waits for confirmation that their market entry is correct, the appearance of "Reversal Patterns" in the "Range" forms the accumulation of the open positions in a place, that we define as a "Point of Control" in the Volume Profile of the Range ". During the movement of the price in a trend, you can see how "Balances" are formed according to the "Auction Market Theory".
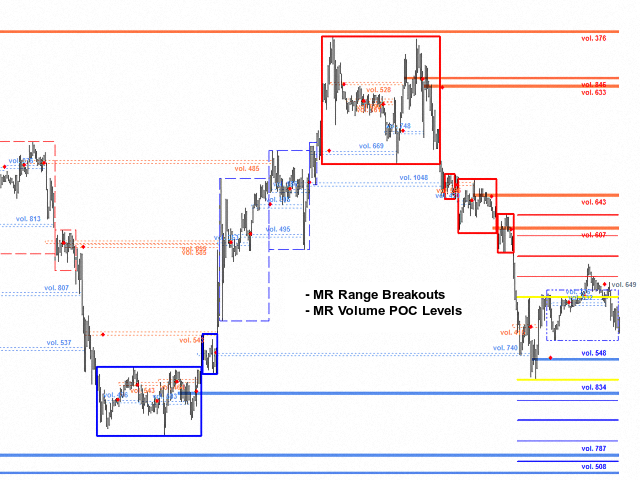
        • In combination with the "MR Volume POC Levels" indicator, you can see where important volumes are left after the exit from the "Balances" and "Ranges". In addition, you can see how the volumes are absorbed in the "Range" and accumulate positions of buyers and sellers.
          • In combination with the "MR Volume Profile Rectangles" indicator, you can see where the places with the highest concentration of the open positions. In "Range of Sellers", buyers remain in "Locked-in Range" - in the area below "POC" volume, while in "Range of Buyers", sellers remain in "Locked-in Range" - in the area above "POC" volume.
          • In combination with the "MR Sentiments by volumes" indicator, you can see the "Sentiments" inside the range. When we also have an "Expansion" of the sellers or the buyers, you can see the imbalance of all participants in the range to those in the "Expansion".
          • In combination with the "MR Trend Corrections" indicator, you can track the places where the volumes accumulate in the "Balances" and "Ranges" along the trend. Then the volumes of these places are absorbed in the "Correction" movements.

          Note:

          The indicator synchronizes the data from the time frames on which it works. Please wait a few seconds when needed...
          There may be slight differences between the figures, that are drawn on the chart of the time frame, that you selected in the indicator settings and the figures, that are drawn on the chart of the smaller time frames. This is related to the decomposition of the bar from the selected time frame to the smaller time frames. The bar of the selected time frame has a different structure of the smaller time frames. This is not a mistake!!! This is the option we have adopted to correctly determine the inputs and outputs of the ranges.

          If you liked the indicator, please support our work by giving 5 stars!!!

          For MetaTrader 4 https://www.mql5.com/en/market/product/63855


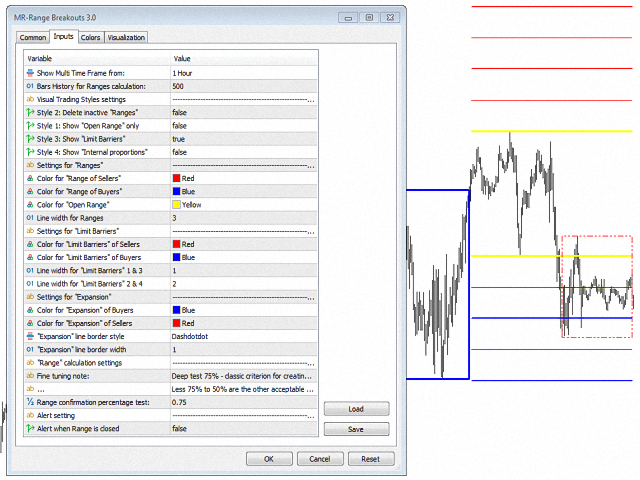
          Indicator settings:

          Show Multi Time Frame from: - Multi time frame on which to calculate the indicator. By default, the indicator works with data from time frame H4.
          Bars History for Ranges calculation: - Number of bars on which the indicator works from multi time frame H4.

          Section "Visual Trading Styles Settings"
          Style 1: Delete inactive "Ranges" - Shows or deletes "Ranges" closed by the price and shown with a dashed line.
          Style 2: Show "Open Range" only - Show only "Open Range" when this option is selected.
          Style 3: Show "Limit Barriers" - Shows or not "Limit Orders Barriers".
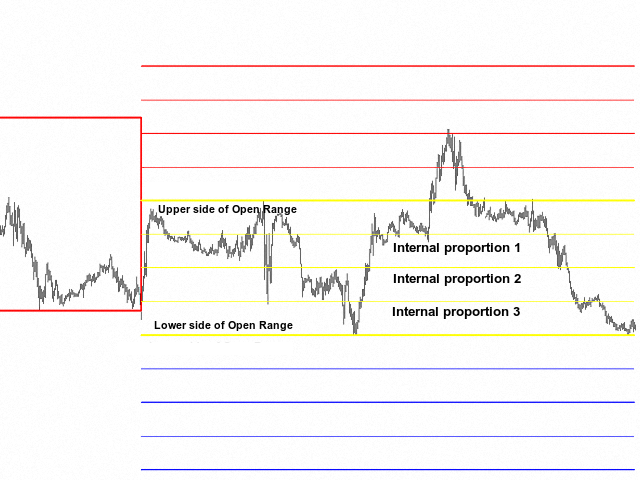
          Style 4: Show "Internal proportions" - Shows or not "Internal proportions" in the "Open Range".

          Section "Settings for Ranges"
          Color for "Range of Sellers" - You can select a color for "Range of Sellers".
          Color for "Range of Buyers" - You can select a color for "Range of Buyers".
          Color for "Open Range" - You can select a color for "Open Range".
          Line width for Ranges - You can select the line width for all non-closed Ranges.

          Section "Settings for Limit Barriers"
          Color for "Limit Barriers" of Sellers - You can select a color for "Limit Orders Barriers" of sellers.
          Color for "Limit Barriers" of Buyers - You can select a color for "Limit Orders Barriers" of buyers.
          Line width for "Limit Barriers" 1 & 3 - You can select the line width for "Limit Orders Barriers" 1 and 3. According to our research, these lines are less important to contain the price movement.
          Line width for "Limit Barriers" 2 & 4 - You can select the line width for "Limit Orders Barriers" 2 and 4. According to our research, these lines are more important to contain the price movement.

          Section "Settings for Expansion"
          Color for "Expansion" of Buyers - You can select a color for "Expansion" of buyers.
          Color for "Expansion" of Sellers - You can select a color for "Expansion" of sellers.
          "Expansion" line border style - You can select the line style for "Expansion".
          "Expansion" line border width - You can select the line width for "Expansion".

          Section "Range calculation settings"
          Range confirmation percentage test: - You can choose another setting to fulfill the "Range" formation criterion. By default, we set the test distance between two extremums equal to 75%. Other acceptable values are to 50%.

          Section "Alert setting"
          Alert when Range is closed - Displays an аlert when a "Range" is closed by the price movement and it is shown with a dashed line.

            Avis 2
            Jason Matthew Scott
            376
            Jason Matthew Scott 2022.07.27 01:02 
             

            Masters of Risk indicators (all 4 in the series) is a serious product for serious traders. MR Reversals are not a quick fix; however, I believe the trading style will work well for any trader willing to put in the work to learn the process and theory behind the indicators and overall trading strategy. More importantly, the developers of the MR indicators stand by their product. Svetoslav has been helping me learn the MR trading strategy - which goes way above and beyond the indicators. We have exchanged nearly 50 emails over the past 30-60 days. I have purchased 25+ indicators to help me get a better handle on institutional-level trading volumes and price action, I believe the MR indicator series is the only product that has put all of the pieces together in one system. As a trader you must still be committed to learning and applying yourself further every day, no tool/indicator will do your job for you. If you want long-term success as a trader - in almost any market - I believe the MR strategy can fill the gaps and provide the solutions for continued success. THANK YOU SVETOSLAV!!

            Enot_B
            46
            Enot_B 2021.11.01 20:12 
             

            Отличный индикатор!

            Produits recommandés
            The best time to trade Using this Indicator is when the time reach exactly hour,half,45 minutes,15 minutes and sometimes 5 minutes.. This indicators is helpful to those who trade boom and crash indecies.How to read this indicator first you'll see Blue allow and Red allow all these allows used to indicate or to detect the spike which will happen so the allow happens soon before the spike happen.This indicator works properly only in boom and crash trading thing which you have to consider when
            Owl Smart Levels MT5
            Sergey Ermolov
            4.47 (36)
            Version MT4   |  FAQ L' indicateur Owl Smart Levels est un système de trading complet au sein d'un seul indicateur qui comprend des outils d'analyse de marché populaires tels que les fractales avancées de Bill Williams , Valable ZigZag qui construit la structure d'onde correcte du marché et les niveaux de Fibonacci qui marquent les niveaux exacts d'entrée. sur le marché et les endroits où prendre des bénéfices. Description détaillée de la stratégie Mode d'emploi de l'indicateur Conseiller-Assis
            Noize Absorption Index - is the manual trading system that measures the difference of pressure between bears forces and bulls forces. Green line - is a noize free index that showing curent situation. Zero value of index shows totally choppy/flat market.Values above zero level shows how powerfull bullish wave is and values below zero measures bearish forces.Up arrow appears on bearish market when it's ready to reverse, dn arrow appears on weak bullish market, as a result of reverse expectation.
            Double HMA MTF for MT5
            Pavel Zamoshnikov
            5 (2)
            This is an advanced multi-timeframe version of the popular Hull Moving Average (HMA) Features Two lines of the Hull indicator of different timeframes on the same chart. The HMA line of the higher timeframe defines the trend, and the HMA line of the current timeframe defines the short-term price movements. A graphical panel with HMA indicator data from all timeframes at the same time . If the HMA switched its direction on any timeframe, the panel displays a question or exclamation mark with a tex
            Orbit Rage Final 2
            BILLY ARANDUQUE ABCEDE
            Note : i only sell this EA on MQL5, any other sellers is fake. Orbit Rage Final, a cutting-edge trading strategy meticulously designed around the bull/bear candle approach and divergence analysis. This powerful tool is engineered to empower you to shape the life you desire. To embark on this transformative journey, simply download and seamlessly integrate it into your MetaTrader 4 platform by placing it in the experts advisors folder. Orbit Rage Final revolutionizes trading by offering a risk-f
            KT Renko Patterns MT5
            KEENBASE SOFTWARE SOLUTIONS
            KT Renko Patterns scans the Renko chart brick by brick to find some famous chart patterns that are frequently used by traders across the various financial markets. Compared to the time-based charts, patterns based trading is easier and more evident on Renko charts due to their uncluttered appearance. KT Renko Patterns features multiple Renko patterns, and many of these patterns are extensively explained in the book titled Profitable Trading with Renko Charts by Prashant Shah. A 100% automate
            Magic EA MT5
            Kyra Nickaline Watson-gordon
            Magic EA is an Expert Advisor based on Scalping, Elliot Waves and with filters such as RSI, Stochastic and 3 other strategies managed and decided with the robot smartly. Large number of inputs and settings are tested and optimized and embedded in the program thus inputs are limited and very simple. Using EA doesn't need any professional information or Forex Trading Knowledge. EA can trade on all symbols and all time frames, using special and unique strategies developed by the author. The EA
            The new update makes this indicator a complete tool for studying, analyzing and operating probabilistic patterns. It includes: On-chart Multi-asset percentage monitor. Configurable martingales. Twenty-one pre-configured patterns, including Mhi patterns and C3. An advanced pattern editor to store up to 5 custom patterns. Backtest mode to test results with loss reports. Trend filter. Hit operational filter. Martingale Cycles option. Various types of strategies and alerts. Confluence between patter
            Your Trend Friend
            Luigi Nunes Labigalini
            The trend is your friend! Look at the color of the indicator and trade on that direction. It does not  repaint. After each candle is closed, that's the color of the trend. You can focus on shorter faster trends or major trends, just test what's most suitable for the symbol and timeframe you trade. Simply change the "Length" parameter and the indicator will automatically adapt. You can also change the color, thickness and style of the lines. Download and give it a try! There are big movements
            Le niveau Premium est un indicateur unique avec une précision de plus de 80 % des prédictions correctes ! Cet indicateur a été testé par les meilleurs Trading Specialists depuis plus de deux mois ! L'indicateur de l'auteur que vous ne trouverez nulle part ailleurs ! À partir des captures d'écran, vous pouvez constater par vous-même la précision de cet outil ! 1 est idéal pour le trading d'options binaires avec un délai d'expiration de 1 bougie. 2 fonctionne sur toutes les paires de de
            Mine Farm
            Maryna Kauzova
            5 (1)
            Mine Farm is one of the most classic and time-tested scalping strategies based on the breakdown of strong price levels. Mine Farm is the author's modification of the system for determining entry and exit points into the market... Mine Farm - is the combination of great potential with reliability and safety. Why Mine Farm?! - each order has a short dynamic Stop Loss - the advisor does not use any risky methods (averaging, martingale, grid, locking, etc.) - the advisor tries to get
            Cet indicateur vous montrera les valeurs TP et SL (dans cette devise) que vous avez déjà définies pour chaque commande sur les graphiques (fermées à la ligne de transaction/commande) qui vous aideront beaucoup à estimer vos profits et pertes pour chaque commande. Et il vous montre également les valeurs PIP. le format affiché est "Valeurs monétaires de nos valeurs de profit ou de perte / PIPs". La valeur TP sera affichée en couleur verte et la valeur SL sera affichée en couleur rouge. Pour tou
            - This is the exact conversion from TradingView: "Support/Resistance" By "BarsStallone". - This indicator lets you read the buffers for R/S values. - This is a non-repaint and light processing load indicator. - This is not a multi time frame indicator If you want the multi time frame version you should create a personal order and I deliver two files that you need them both to have the multi time frame indicator running on your system. - The MT4 version of the indicator is not light load from pr
            Volality Index scalper indicator  Meant for Volality pairs such as Volality 10, 25, 50, 75 and 100 The indicator works on all timeframes from the 1 minute to the monthly timeframe the indicator is non repaint the indicator has 3 entry settings 1 color change on zero cross 2 color change on slope change 3 color change on signal line cross Orange line is your sell signal Blue line is your buy signal.
            Matrix Arrow EA MT5
            Juvenille Emperor Limited
            5 (4)
            Matrix Arrow EA MT5  est un conseiller expert unique qui peut échanger les signaux MT5 de l'indicateur Matrix Arrow avec un panneau de commerce sur le graphique, manuellement ou à 100% automatiquement.  Matrix Arrow Indicator MT5  déterminera la tendance actuelle à ses débuts, en rassemblant des informations et des données à partir d'un maximum de 10 indicateurs standard, qui sont: Indice de mouvement directionnel moyen (ADX) Indice de canal de matières premières (CCI) Bougies classiques Heiken
            PZ Trend Trading MT5
            PZ TRADING SLU
            3.67 (3)
            Trend Trading is an indicator designed to profit as much as possible from trends taking place in the market, by timing pullbacks and breakouts. It finds trading opportunities by analyzing what the price is doing during established trends. [ Installation Guide | Update Guide | Troubleshooting | FAQ | All Products ] Trade financial markets with confidence and efficiency Profit from established trends without getting whipsawed Recognize profitable pullbacks, breakouts and early reversals The ind
            To download MT4 version please click here . This is the exact conversion from TradingView: "WaveTrend [LazyBear]" By "zeusuk3". One of the coolest indicators out there to detect overbought and oversold zones. It can be used as a part of more complicated strategy and for confirming a potential trade setup. There are buffers to use in EAs also. The indicator is loaded light and non-repaint. - You can message in private chat for further changes you need. Thanks for downloading 
            How to use Pair Trading Station Pair Trading Station is recommended for H1 time frame and you can use it for any currency pairs. To generate buy and sell signal, follow few steps below to apply Pair Trading Station to your MetaTrader terminal. When you load Pair Trading Station on your chart, Pair Trading station will assess available historical data in your MetaTrader platforms for each currency pair. On your chart, the amount of historical data available will be displayed for each currency pai
            WanaScalper
            Isaac Wanasolo
            1 (1)
            A scalping indicator based on mathematical patterns, which on average gives signals with relatively small SL, and also occasionally helps to catch big moves in the markets (more information in the video) This indicator has three main types of notifications: The first type warns of a possible/upcoming signal on the next bar The second type indicates the presence of a ready signal to enter the market/open a position The third type is for SL and TP levels - you will be notified every time price r
            The Antique Trend Indicator is a revolutionary trend trading and filtering solution with all the important features of a trend tool built into one tool! The Antique Trend indicator is good for any trader, suitable for any trader both for Forex and binary options. There is no need to configure anything, everything has been perfected by time and experience, it works great during flats and trends. The Antique Trend indicator is a tool for technical analysis of financial markets, reflecting curre
            For a trader, trend is our friend. This is a trend indicator for MT5, can be used on any symbol. just load it to the terminal and you will see the current trend. green color means bullish trend and red means bearlish trend. you can also change the color by yourself when the indicator is loaded to the MT5 terminal the symbol and period is get from the terminal automaticly. How to use: I use this trend indicator on 2 terminals with different period  for the same symbol at same time. for example M5
            Daily Retracement EA
            Brieuc Francois Constant Leysour
            This expert advisor is engineered to capitalize on market patterns. It employs a sophisticated algorithm to filter the market, detect its trend and exploit retracement patterns effectively. This is a REAL trading strategy, it involves NO MARTINGALE, NO GRID, NO HEDGING or other dangerous methods. All trades have a hard stop loss, and you can choose how much risk to take per trade. LIMITED TIME SALE! Secure your copy today for only $99. Available at this price until April 14, then the sale will
            Tool for Identifying Potential Reversal Points and Trend Direction This tool is excellent for identifying potential reversal points and trend direction in the market. It works well with confirming indicators such as MACD, Stochastic, RSI - standard indicators available on all MT5 platforms. Together with them, it forms a reliable strategy. In the settings, you can adjust the channel distance and period. It is recommended to enter a trade when the signal line crosses the upper channel bounda
            This indicator uses a mathematical calculation algorithm . This algorithm calculates the remainder between the updated model and the actual values and produces the possible progress of the graph on the graph. It is not a super prophet in trading, but it is very good for the trader when entering the market and to analyze it before entering. Applicable for all currencies. Данный индикатор использует алгоритм математических вычислений . Данный алгоритм вычисляет остаток между обновленной моделью и
            This is the famous Sunflower indicator for Metatrader5. This indicator marks possible tops and bottoms on price charts. The indicator identifies tops and bottoms in the asset's price history, keep in mind that the current sunflower of the last candle repaints, as it is not possible to identify a top until the market reverses and it is also not possible to identify a bottom without the market stop falling and start rising. If you are looking for a professional programmer for Metatrader5, please
            Exclusive FOREX account HEDGE FuzzyLogicTrendEA is based on fuzzy logic strategy based on  analysis 5 indicators and filters. When the EA analysis all this indicators, it decides, based on its fuzzy strategy, which trade will be better: sell or buy. As additional functions, it´s possible defines spread maximum, stop loss and others. Recomm. Symbol: EURUSD, AUDUSD, GBPUSD, NZDUSD, USDCAD, AUDCAD, EURCAD e USDJPY Recomm. timeframe: H1. Backtest were done on EURUSD, H1, 01/07/2023 - 26/0
            To download MT4 version please click here . - This is the exact conversion from TradingView: "Trend Direction Force Index - TDFI [wm]" By "causecelebre". - This indicator uses multiple levels of averaging to detect trend strength. - You can optimize filter low and filter high levels to achieve best results. - You have access to buffers to use in EAs. - This is a light-load processing and non-repaint indicator. - You can message in private chat for further changes you need.
            | Fully-automated Smart Money Concept (ICT) inspired trading solution with multi-strategy capabilities | Built by a grid trader >> for grid traders.  This is MT5 version, click  here  for  Blue CARA MT4  (settings and logics are same in both versions)     Real monitoring signal  -->  Cara Gold Intro Blue CARA EA   ('CARA') - short for  C omprehensive  A lgorithmic   R esponsive   A dvisor is a next-gen  multi-currency    multi-timeframe  EA base on the widely known (and perhaps the most popul
            Magic Finger can help you identify trends and trading opportunities clearly. The finger points to the open position signal, and the discoloration line is confirmed by the trend. If you are a day trader, you can choose to trade during a period of active trading, referring to the discoloration line as the basis for the next order, finger signal as a filter. If you are a trend trader, you can choose a period above H1, wait for the appearance of the finger signal in the key price area, and enter
            Banana Binary MT5 Signal
            Nirundorn Promphao
            1 (1)
            Promotion $66 lifetime for you. The principle of this indicator is very simple: detecting the trend with Moving Average, then monitoring the return point of graph by using the crossing of Stochastic Oscillator and finally predicting BUY and SELL signal with arrows, alerts and notifications. The parameters are fixed and automatically calculated on each time frame. Example: If you install indicator on EURUSD, timeframe M5: the indicator will detect the main trend with the Moving Average on this
            Les acheteurs de ce produit ont également acheté
            Atomic Analyst MT5
            Issam Kassas
            3.64 (11)
            Tout d'abord, il convient de souligner que cet indicateur de trading n'est ni repainting, ni redrawing et ne présente aucun délai, ce qui le rend idéal à la fois pour le trading manuel et automatisé. L'Analyste Atomique est un indicateur d'action sur les prix PA qui utilise la force et le momentum du prix pour trouver un meilleur avantage sur le marché. Équipé de filtres avancés qui aident à éliminer les bruits et les faux signaux, et à augmenter le potentiel de trading. En utilisant plusieur
            FX Volume MT5
            Daniel Stein
            4.94 (17)
            Obtenez votre mise à jour quotidienne du marché avec des détails et des captures d'écran via notre Morning Briefing ici sur mql5 et sur Telegram ! FX Volume est le PREMIER et SEUL indicateur de volume qui fournit un VRAI aperçu du sentiment du marché du point de vue d'un courtier. Il fournit des informations impressionnantes sur la façon dont les acteurs institutionnels du marché, comme les courtiers, sont positionnés sur le marché des changes, bien plus rapidement que les rapports COT. Voir c
            Advanced Supply Demand MT5
            Bernhard Schweigert
            4.53 (15)
            La meilleure solution pour tout commerçant débutant ou expert ! Cet indicateur est un outil de trading unique, de haute qualité et abordable car nous avons intégré un certain nombre de fonctionnalités propriétaires et une nouvelle formule. Avec cette mise à jour, vous pourrez afficher des zones à double horaire. Vous pourrez non seulement afficher un TF plus élevé, mais afficher les deux, le graphique TF, PLUS le TF supérieur : AFFICHAGE DES ZONES NICHÉES. Tous les traders Supply Demand vont ado
            XQ Indicator MetaTrader 5
            Marzena Maria Szmit
            5 (1)
            Step into the realm of Forex trading with confidence and precision using XQ, a cutting-edge Forex indicator designed to elevate your trading game to unprecedented heights. Whether you're a seasoned trader or just stepping into the world of currency exchange, XQ Forex Indicator empowers you with the insights and signals needed to make informed trading decisions. The signal conditions are a combination of three indicators, and XQ Forex Indicator only display  medium and long-term trends . The ind
            TrendMaestro5
            Stefano Frisetti
            note: this indicator is for METATRADER4, if you want the version for METATRADER5 this is the link:  https://www.mql5.com/it/market/product/108106 TRENDMAESTRO recognizes a new TREND in the bud, he never makes mistakes. The certainty of identifying a new TREND is priceless. DESCRIPTION TRENDMAESTRO identifies a new TREND in the bud, this indicator examines the volatility, volumes and momentum to identify the moment in which there is an explosion of one or more of these data and therefore the mome
            Golden Gate Algo MT5
            James David Lane
            4 (6)
            40% DE RÉDUCTION POUR NOËL ! AUGMENTATION DES PRIX À 250 $ LE 1er JANVIER ! Présentation de GoldenGate Entries : une solution de trading de pointe ! Découvrez une approche révolutionnaire du trading avec GoldenGate Entries (GGE), un indicateur avancé conçu pour améliorer votre expérience de trading. GGE offre un ensemble complet de fonctionnalités pour donner aux utilisateurs la précision et la confiance nécessaires dans leurs décisions de trading. Paires : Toutes (FX - Matières premières
            Bill Williams Advanced
            Siarhei Vashchylka
            5 (3)
            Bill Williams Advanced is designed for automatic chart analysis using Bill Williams' "Profitunity" system. The indicator analyzes four timeframes at once. Manual (Be sure to read before purchasing) Advantages 1. Automatically analyzes the chart using the "Profitunity" system of Bill Williams. The found signals are placed in a table in the corner of the screen. 2. Equipped with a trend filter based on the Alligator indicator. Most of the system signals are recommended to be used only accordi
            PZ Swing Trading MT5
            PZ TRADING SLU
            5 (4)
            Swing Trading is the first indicator designed to detect swings in the direction of the trend and possible reversal swings. It uses the baseline swing trading approach, widely described in trading literature. The indicator studies several price and time vectors to track the aggregate trend direction and detects situations in which the market is oversold or overbought and ready to correct. [ Installation Guide | Update Guide | Troubleshooting | FAQ | All Products ] Profit for market swings with
            Professional Scalping Tool on Deriv Attention! The indicator will be sold in limited quantities!!! Description: This trading indicator is designed for professional traders focused on scalping. Designed with the market in mind, it provides highly accurate spike trading signals. It works on the M1 timeframe and supports the following symbols: Boom 300 Index, Boom 500 Index, Boom 1000 Index, Crash 300 Index, Crash 500 Index, Crash 1000 Index. Functional Features: - Direction: - Trading is ca
            A key element in trading is zones or levels from which decisions to buy or sell a trading instrument are made. Despite attempts by major players to conceal their presence in the market, they inevitably leave traces. Our task was to learn how to identify these traces and interpret them correctly. Reversal First Impulse levels (RFI)   -  Version MT4                  INSTRUCTIONS                 RUS                 ENG                         R ecommended to use with an indicator   -  TREND PRO  
            TPA True Price Action indicator reveals the true price action of the market makers through 100% non-repainting signals strictly at the close of a candle! TPA shows entries and re-entries, every time the bulls are definitely stronger than the bears and vice versa. Not to confuse with red/green candles. The shift of power gets confirmed at the earliest stage and is ONE exit strategy of several. There are available now two free parts of the TPA User Guide for our customers. The first "The Basics"
            IVISTscalp5
            Vadym Zhukovskyi
            5 (3)
            Nous vous présentons l'indicateur iVISTscalp5, qui est non seulement unique, mais également efficace dans les opérations de trading. Cet indicateur est basé sur des données temporelles et est le résultat de nombreuses années d'expérience et d'analyse approfondie des marchés financiers. L'indicateur iVISTscalp5 est un excellent outil pour le trading manuel. La commodité, la simplicité et la visualisation - toute la complexité est cachée à l'intérieur. Nous avons simplifié au maximum les paramètre
            [ MT4 Version ] Backtesting Simulator Are you tired of spending months on demo or live accounts to test your trading strategies? The Backtesting Simulator is the ultimate tool designed to elevate your backtesting experience to new heights. Utilizing Metatrader historical symbol information, it offers an unparalleled simulation of real market conditions. Take control of your testing speed, test ideas quickly or at a slower pace, and witness remarkable improvements in your testing performance.
            Weis Wave with Alert MT5
            Trade The Volume Waves Single Member P.C.
            4.93 (15)
            Rental/Lifetime Package Options and Privileges  * For optimum results the yearly or lifetime package is suggested due to live training ! Rent Monthly Six Months   Yearly/Lifetime Weis Wave with Speed with Alert+Speed Index x x x Manual  x x x Quick Set up Video x x x Blog x x x Lifetime Updates x x x Setup and Training Material x x Free Rectangle Break Alert Tool      x Discord Access Channel "The SI traders" x 2-hour live methodology training x How to trade with it:    http://
            The indicator is designed to close positions on the market in time. For example: to take profits ahead of schedule if the price has not reached TakeProfit, and the market is turning around. The indicator analyzes the momentum, not the trend. He does not give any information about the trend. The indicator is well suited for finding divergence. The Ershov 38 Parrots indicator dynamically adjusts to the market and detects price movement impulses of medium and high amplitude. It almost does not rea
            VTrende Pro
            Andrii Diachenko
            5 (1)
            VTrende Pro - MTF indicator for trend trading with a display panel for MT5 *** Videos can be translated into any language using subtitles (video language - Russian) Although the signals of the VTrende Pro indicator can be used as signals of a full-fledged trading system, it is recommended to use them in conjunction with the Bill Williams TS. VTrende Pro is an extended version of the VTrende indicator. Difference between Pro version and VTrende: - Time zones - Signal V - signal 1-2 waves
            Multi-currency, multi-timeframe, harmonic pattern indicator AB = CD. Supports sending push notifications about signals to a mobile device, messages on e-mail, as well as messages using alerts on all available currency pairs and timeframes. This indicator was based on the indicator Harmonic ABCD Universal. Version for MetaTrader 5:  https://www.mql5.com/en/market/product/44972 . See also: Harmonic ABCD Universal for MetaTrader 4 . Using modern software development methods has made the indicator a
            Malaysian SNR Levels
            Matthias Horst Pieroth
            This indicator can be used to display Support and Resistance levels according to  the  Malaysian SNR concept , in which Support and Resistance are exact levels of a line chart. Malaysian SNR There are 3 different horizontal levels in Malaysian SNR: A-Level : This level is located at the peak of this line chart. (shape looks like the letter A) V-Level : Level at the valley of a line chart, (shape looks like the letter V) Gap-Leve l: This level is located at the Close/Open gap between two cand
            This is arguably the most complete harmonic price formation auto-recognition indicator you can find for the MetaTrader Platform. It detects 19 different patterns, takes fibonacci projections as seriously as you do, displays the Potential Reversal Zone (PRZ) and finds suitable stop-loss and take-profit levels. [ Installation Guide | Update Guide | Troubleshooting | FAQ | All Products ] It detects 19 different harmonic price formations It plots primary, derived and complementary Fibonacci p
            Native Channels
            BeeXXI Corporation
            5 (2)
            This indicator recognizes all support and resistance levels. A number of unique high-performance techniques have been applied, which made the existence of this indicator possible. All formed channels are naturally visible: horizontal linear linear parabolic cubic (Polynomial 3 degrees - Wave) This is due to a bundle of approximating channels. The formed channels form "standing waves" in a hierarchical sequence. Thus, all support and resistance levels are visible. All parameter management is
            RAD CRITICAL LEVES RAD indicator tracks “Relevant Volume” in real time, identifying accumulation and distribution processes, projecting them in the chart as SUPPORT or RESISTANCE zones. Natural   support   and resistance levels are generated by Volume Accumulation and Distribution processes. As these processes evolve, levels at which the relevant volume in the market place is positioned, become difficult areas to cross upwards or downwards. By using this information, traders can identify very s
            Tricky to find and scarce in frequency, divergences are one of the most reliable trading scenarios. This indicator finds and scans for regular and hidden divergences automatically using your favourite oscillator. [ Installation Guide | Update Guide | Troubleshooting | FAQ | All Products ] Easy to trade Finds regular and hidden divergences Supports many well known oscillators Implements trading signals based on breakouts Displays suitable stop-loss and take-profit levels Configurable oscilla
            "Piranha" - an autonomous trading system that determines overbought and oversold levels on the chart. Red and blue zones represent overbought and oversold levels respectively. Entry points are marked with arrows: a downward arrow in the red zone for "sell" and an upward arrow in the blue zone for "buy". The Take profit level is indicated by the green moving average. Key features: Adjusting the Take profit level as the green moving average changes position. Averaging ability when a new market e
            Big Player Range
            Thalles Nascimento De Carvalho
            5 (2)
            Bienvenue sur l'indicateur "BigPlayerRange", un outil d'analyse technique développé pour identifier les zones d'intérêt significatives des institutions financières sur les marchés. Cet indicateur offre une analyse précise des plages de prix où les principaux acteurs du marché démontrent une activité et un intérêt considérables. Principales caractéristiques : 1. Cartographie des zones d'intérêt institutionnel : "BigPlayerRange" met en évidence avec précision les zones du graphique où les in
            Introduction to X3 Chart Pattern Scanner X3 Cherart Pattern Scanner is the non-repainting and non-lagging indicator detecting X3 chart patterns including Harmonic pattern, Elliott Wave pattern, X3 patterns, and Japanese Candlestick patterns. Historical patterns match with signal patterns. Hence, you can readily develop the solid trading strategy in your chart. More importantly, this superb pattern scanner can detect the optimal pattern of its kind. In addition, you can switch on and off individu
            INDICATEUR basé sur l'INTELLIGENCE ARTIFICIELLE qui génère d'éventuelles entrées d'achat et de vente pour les options binaires. l'indicateur fonctionne sur 3 stratégies différentes : 1) en lisant les volumes, il envoie un signal lorsque le prix doit s'inverser 2) à travers la divergence entre prix et volume, il envoie un signal lorsque la tendance doit se poursuivre ou s'inverser 3) grâce à la convergence entre le prix et le volume, il envoie un signal lorsque la tendance doit se poursu
            MetaForecast M5
            Vahidreza Heidar Gholami
            5 (2)
            MetaForecast prédit et visualise l'avenir de n'importe quel marché en se basant sur les harmoniques des données de prix. Bien que le marché ne soit pas toujours prévisible, s'il y a un motif dans les prix, MetaForecast peut prédire l'avenir aussi précisément que possible. Comparé à d'autres produits similaires, MetaForecast peut générer des résultats plus précis en analysant les tendances du marché. Paramètres d'entrée Past size (Taille passée) Spécifie le nombre de barres que MetaForecast uti
            L'indicateur de Carré Gann est un puissant outil d'analyse du marché basé sur l'article "Formule Mathématique pour les Prédictions de Marché" écrit par W.D. Gann. Cet outil utilise des concepts mathématiques et des théories de Gann pour réaliser une analyse précise du marché. Il utilise les carrés de 144, 90, 52 et aussi le carré de 9. De plus, il intègre la méthode du  pour le carré de 9 et sa relation avec les canaux et le modèle en étoile de ce carré. Manuel d'Utilisateur et Application : Ava
            SMCpro
            Arief
            5 (1)
            SMCpro MT5  Original Price  $440   ---  Currently Price  40% OFF  ( for unlimited use ) Hello World! Introducing.. SMCpro tool and Indicator for  MetaTrader 5 , a cutting-edge feature designed to revolutionize your trading experience. With innovative ICT Smart Money Concept, you gain unparalleled insight into market dynamics, empowering you to make informed trading decisions like never before. Built on the foundation of advanced algorithms and real-time data analysis, SMCpro tool and Indicat
            PZ Day Trading MT5
            PZ TRADING SLU
            2.83 (6)
            This indicator detects price reversals in a zig-zag fashion, using only price action analysis and a donchian channel. It has been specifically designed for short-term trading, without repainting or backpainting at all. It is a fantastic tool for shrewd traders aiming to increase the timing of their operations. [ Installation Guide | Update Guide | Troubleshooting | FAQ | All Products ] Amazingly easy to trade It provides value on every timeframe It displays suitable SL and TP levels It impl
            Plus de l'auteur
            MR Range Breakouts 4
            Sergey Khramchenkov
            5 (1)
            " A trading range occurs when a financial instrument trades between constant high and low prices over a period of time. The upper part of the trading range of a financial instrument often provides price resistance, while the lower part of the trading range usually offers price support.  Traders can enter in the direction of a breakout or breakdown from a trading range... " This is the "Classical Theory" understanding of ranges. We have a different understanding of the nature of ranges and th
            MR Reversal Patterns 4
            Sergey Khramchenkov
            5 (2)
            In the "Masters of Risk" trading system, one of the main concepts is related to places where markets change direction. In fact, this is a change in priority and a violation of the trend structure at the extremes of the market, where supposedly there are or would be stop-losses of "smart" participants who are outside the boundaries of the accumulation of volume. For this reason, we call them "Reversal Patterns" - places with a lot of weight for the start of a new and strong trend. Some of the imp
            The most crucial price level in any "Volume Profile" is the "Point of Control" . Is the price level with the highest traded volume. And mainly, is the level where the big guys start there their positions, so it's an accumulation/distribution level for smart money. The idea of the indicator arose after the "MR Volume Profile Rectangles" indicator was made. When creating the "MR Volume Profile Rectangles" indicator, we spent a lot of time comparing the volumes with those from the volume profil
            MR Reversal Patterns 5
            Sergey Khramchenkov
            5 (1)
            In the "Masters of Risk" trading system, one of the main concepts is related to places where markets change direction. In fact, this is a change in priority and a violation of the trend structure at the extremes of the market, where supposedly there are or would be stop-losses of "smart" participants who are outside the boundaries of the accumulation of volume. For this reason, we call them "Reversal Patterns" - places with a lot of weight for the start of a new and strong trend. Some of the im
            MR Volume POC Levels 4
            Sergey Khramchenkov
            5 (3)
            The most crucial price level in any "Volume Profile" is the "Point of Control" . Is the price level with the highest traded volume. And mainly, is the level where the big guys start there their positions, so it's an accumulation/distribution level for smart money. The idea of the indicator arose after the "MR Volume Profile Rectangles" indicator was made. When creating the "MR Volume Profile Rectangles" indicator, we spent a lot of time comparing the volumes with those from the volume profil
            A "Volume Profile" is an advanced charting indicator that displays total volume traded at every price level over a user specified time period. The main components of the volume profile are POC ( Point Of Control - the price level, at which the maximum number of contracts were executed during a selected period), VAH ( Value Area High - the highest price in the Value Area) and VAL ( Value Area Low - the lowest price in the Value Area). When we settled on the original indicator, we spent a lot o
            MR Dynamic POC 4
            Sergey Khramchenkov
            The most crucial price level in any "Volume Profile" is the "Point of Control" . Is the price level with the highest traded volume. And mainly, is the level where the big guys start there their positions, so it's an accumulation/distribution level for smart money. The idea of the indicator arose after the "MR Volume Profile Rectangles" indicator was made. When creating the "MR Volume Profile Rectangles" indicator, we spent a lot of time comparing the volumes with those from the volume profil
            We publish the indicator as a useful tool in trading and call this indicator the "Swiss Army Knife" because it provides many possibilities and combinations to help understand the material on the "Masters of Risk" trading system. The indicator itself is not part of the tools used in the "Masters of Risk" trading system. The indicator consists of 3 separate multi-timeframe indicators, which in combination with each other help to reduce the "noise" of false signals. The first of the indicators ar
            "Sentiments of traders" in the financial markets is a topic that has been of interest to us for a long time. In time, we could not find the right formula to define these sentiments. We went through many stages in the search for the right methodology - from taking data from external sources to calculate open positions of buyers and sellers to calculating tick volumes, but still we were not satisfied with the results. The calculation of open positions of buyers and sellers from external sources ha
            A "Volume Profile" is an advanced charting indicator that displays total volume traded at every price level over a user specified time period. The main components of the volume profile are POC ( Point Of Control - the price level, at which the maximum number of contracts were executed during a selected period), VAH ( Value Area High - the highest price in the Value Area) and VAL ( Value Area Low - the lowest price in the Value Area). When we settled on the original indicator, we spent a lot o
            MR Dynamic POC 5
            Sergey Khramchenkov
            The most crucial price level in any "Volume Profile" is the "Point of Control" . Is the price level with the highest traded volume. And mainly, is the level where the big guys start there their positions, so it's an accumulation/distribution level for smart money. The idea of the indicator arose after the "MR Volume Profile Rectangles" indicator was made. When creating the "MR Volume Profile Rectangles" indicator, we spent a lot of time comparing the volumes with those from the volume profil
            We publish the indicator as a useful tool in trading and call this indicator the "Swiss Army Knife" because it provides many possibilities and combinations to help understand the material on the "Masters of Risk" trading system. The indicator itself is not part of the tools used in the "Masters of Risk" trading system. The indicator consists of 3 separate multi-timeframe indicators, which in combination with each other help to reduce the "noise" of false signals. The first of the indicators ar
            "Sentiments of traders" in the financial markets is a topic that has been of interest to us for a long time. In time, we could not find the right formula to define these sentiments. We went through many stages in the search for the right methodology - from taking data from external sources to calculate open positions of buyers and sellers to calculating tick volumes, but still we were not satisfied with the results. The calculation of open positions of buyers and sellers from external sources ha
            Filtrer:
            Jason Matthew Scott
            376
            Jason Matthew Scott 2022.07.27 01:02 
             

            Masters of Risk indicators (all 4 in the series) is a serious product for serious traders. MR Reversals are not a quick fix; however, I believe the trading style will work well for any trader willing to put in the work to learn the process and theory behind the indicators and overall trading strategy. More importantly, the developers of the MR indicators stand by their product. Svetoslav has been helping me learn the MR trading strategy - which goes way above and beyond the indicators. We have exchanged nearly 50 emails over the past 30-60 days. I have purchased 25+ indicators to help me get a better handle on institutional-level trading volumes and price action, I believe the MR indicator series is the only product that has put all of the pieces together in one system. As a trader you must still be committed to learning and applying yourself further every day, no tool/indicator will do your job for you. If you want long-term success as a trader - in almost any market - I believe the MR strategy can fill the gaps and provide the solutions for continued success. THANK YOU SVETOSLAV!!

            Sergey Khramchenkov
            2077
            Réponse du développeur Sergey Khramchenkov 2022.07.28 12:22
            Thank you Jason,
            We try to help as much as we can.
            Enot_B
            46
            Enot_B 2021.11.01 20:12 
             

            Отличный индикатор!

            Sergey Khramchenkov
            2077
            Réponse du développeur Sergey Khramchenkov 2021.11.01 20:56
            Спасибо !!!
            Répondre à l'avis
            Version 3.1 2023.03.29
            - Corrected text in indicator settings.
            Version 3.0 2023.03.28
            - Part of the terminology has been changed.
            - "New Range" has been renamed to "Open Range".
            - The "Open Range" is visualized by upper and lower lines.
            - Added more "Limit Barriers".
            - Added "Expansion of Buyers" and "Expansion of Sellers".
            - Improved some technical details.
            Version 2.0 2021.11.01
            Major upgrade of the indicator.
            The formula for determining the ranges has been rewritten.

            Added:
            1. Automatic determination of the area of limit barriers.
            2. Show a potential new range or potential extension of the existing one.